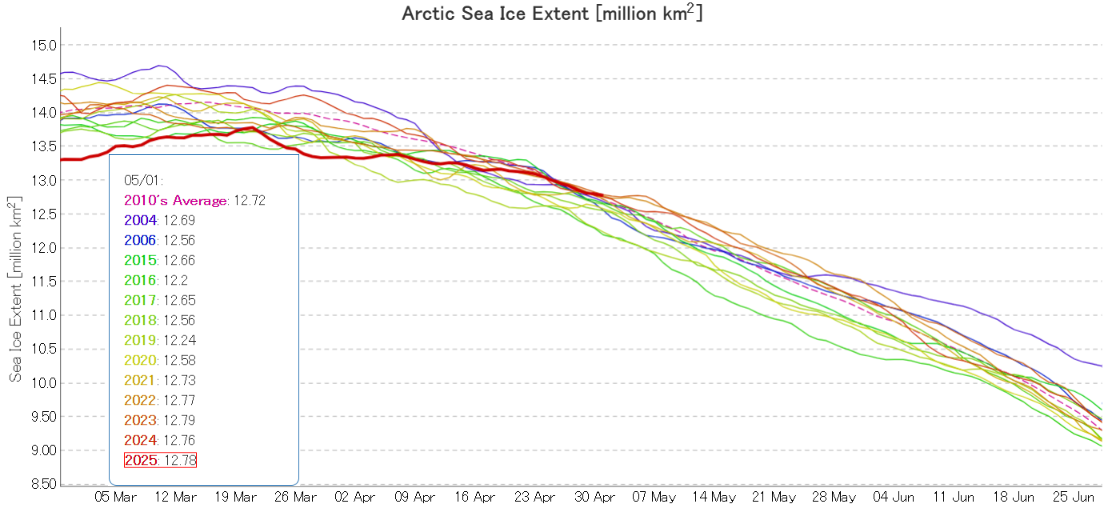
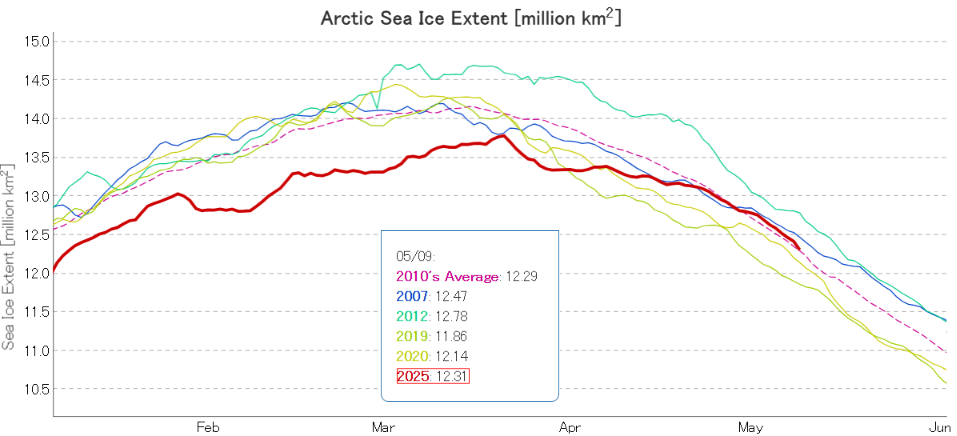
JAXA/ViSHOP extent is no longer “lowest for the date”! After “flatlining” for most of April the metric is now in the midst of a close knit group of the other years in the 2020s:
The high pressure area over the Central Arctic persisted through the second half of April, and so did the consequent drift of ice from the Pacific side of the Arctic to the Atlantic periphery:
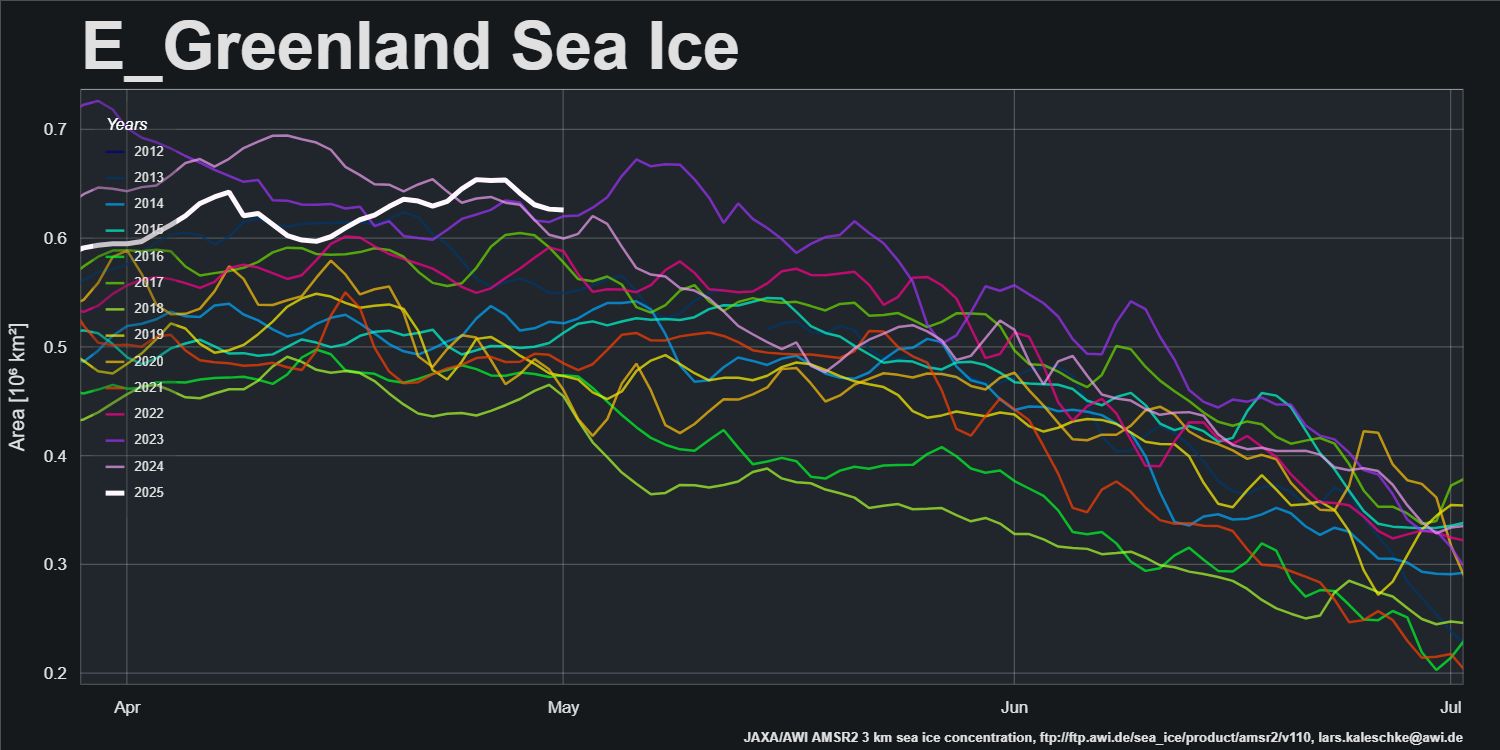
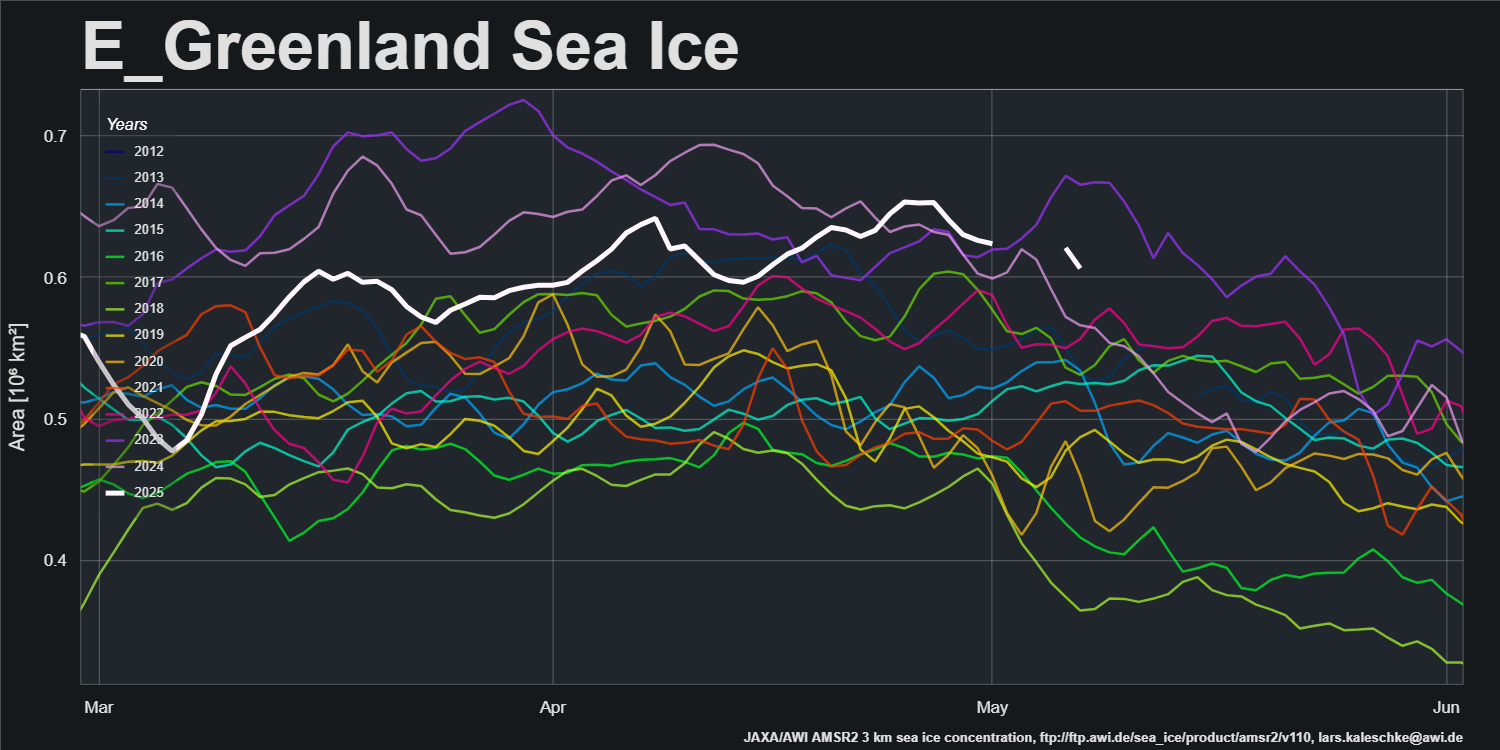
AWI’s sea ice area for the Greenland Sea is currently “highest for the date” in the AMSR2 record that started in July 2012:
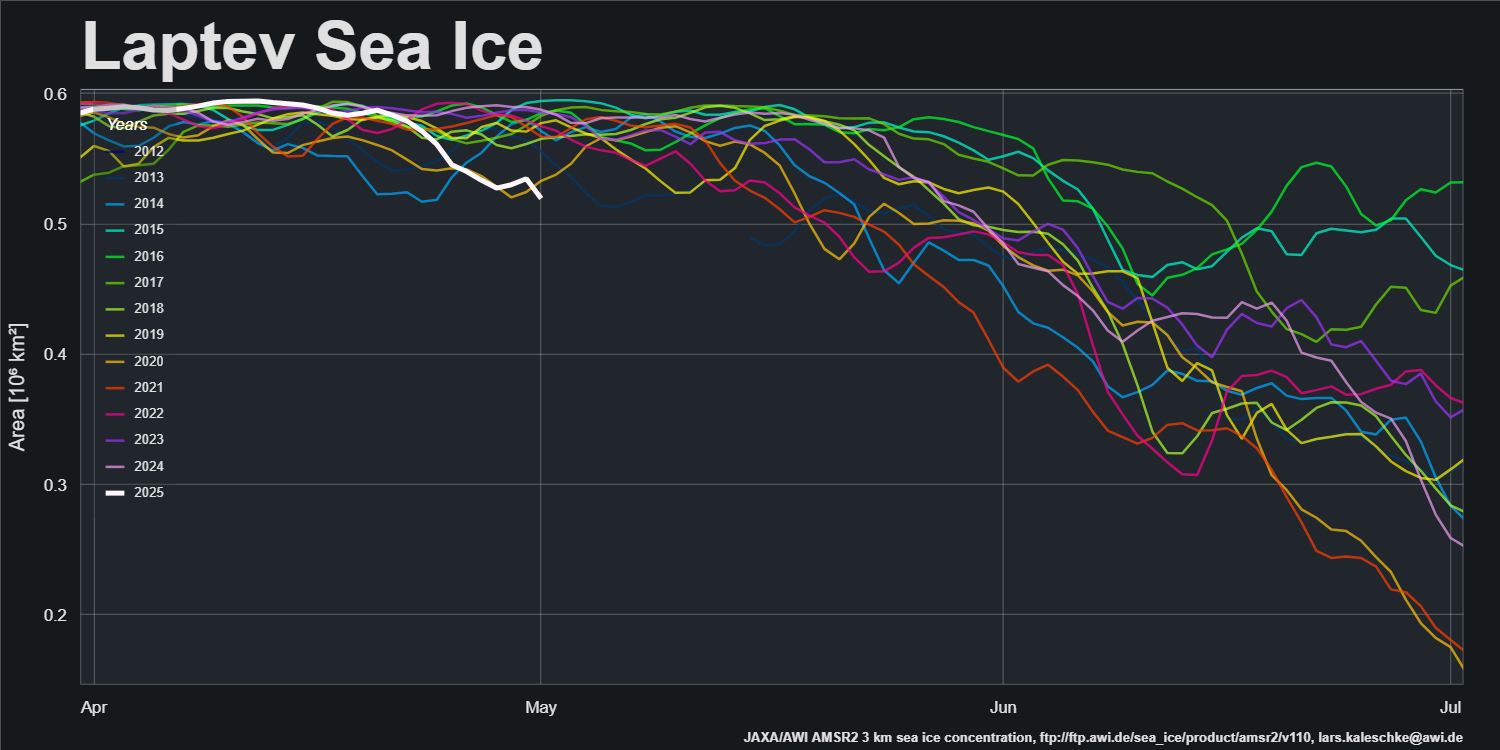
The offshore winds along the Laptev Sea coast have continued, and sea ice area is now “lowest for the date”:
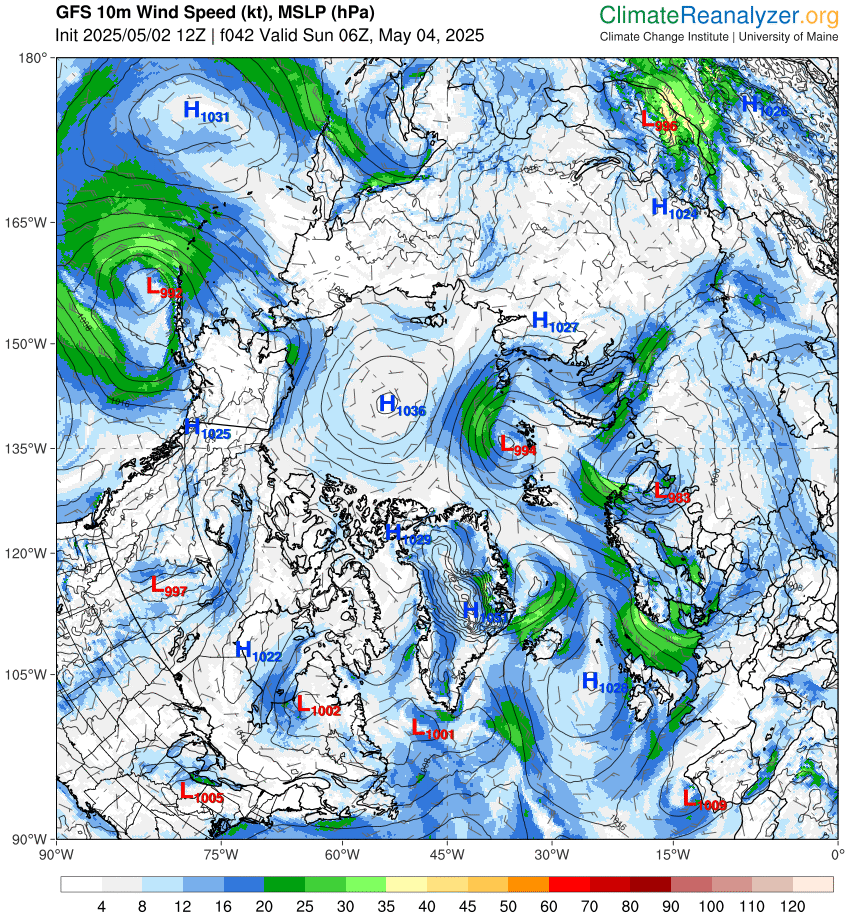
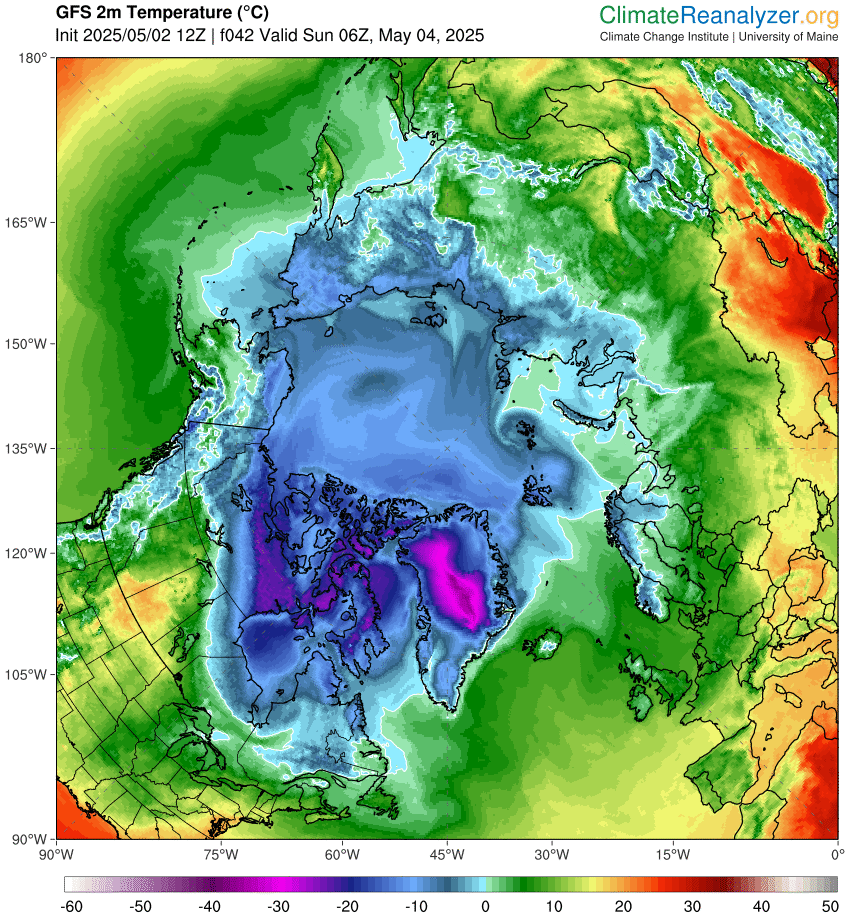
The first signs of a break in the high pressure dominance are appearing. GFS currently forecasts that a low pressure area will enter the Central Arctic, bring above zero temperatures over the Kara Sea on Sunday:
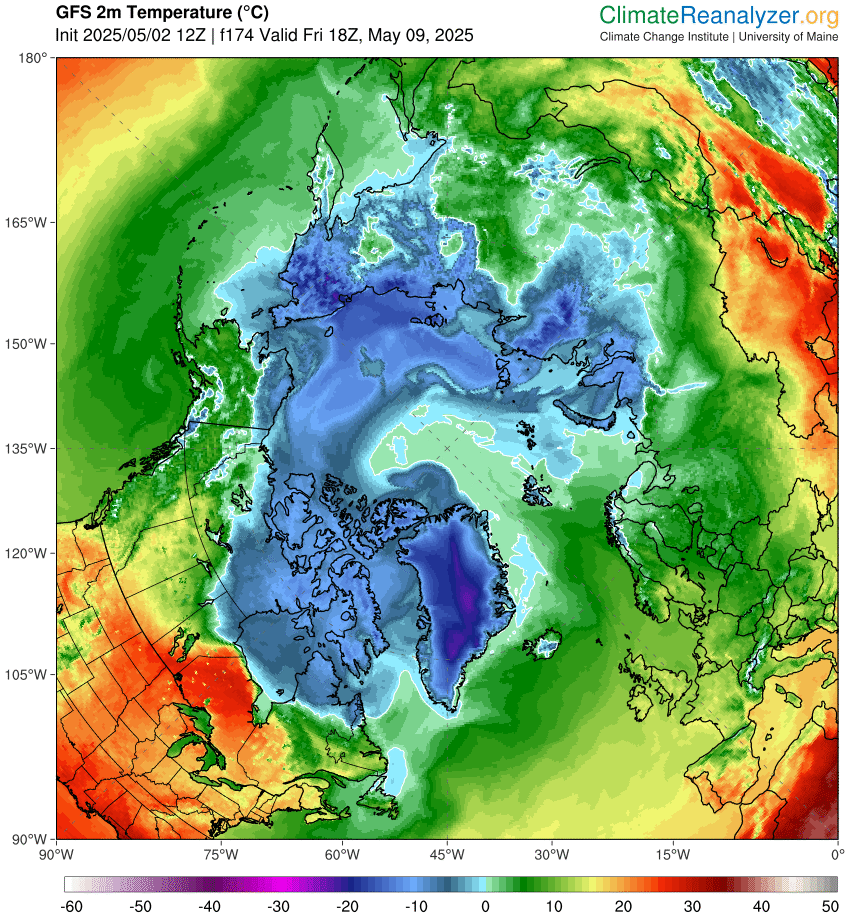
Much further into the future (and hence much less likely to verify!), GFS is forecasting temperatures above zero at the North Pole in a week’s time:
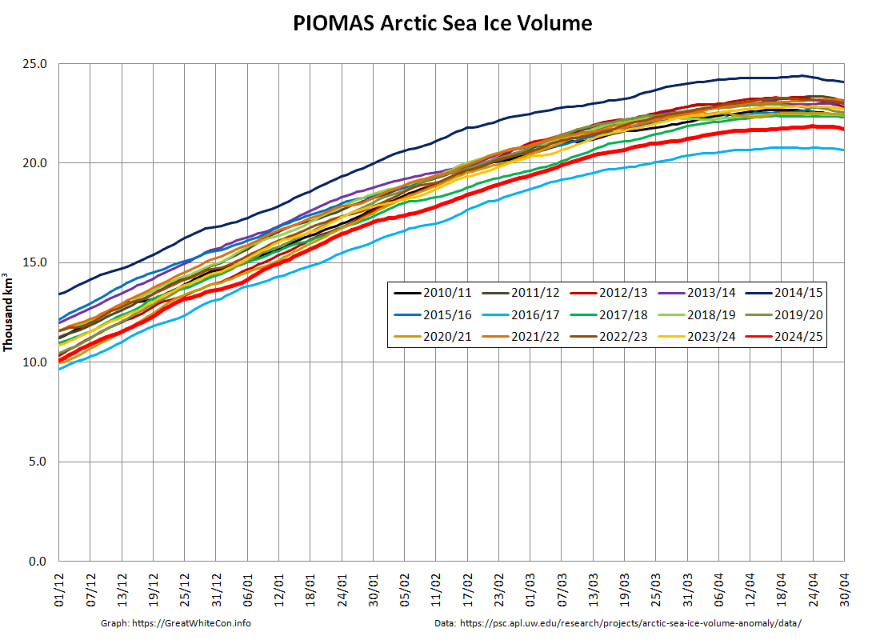
PIOMAS Arctic sea ice volume had reached a 2025 maximum of 21.85 thousand km³ on April 24th:
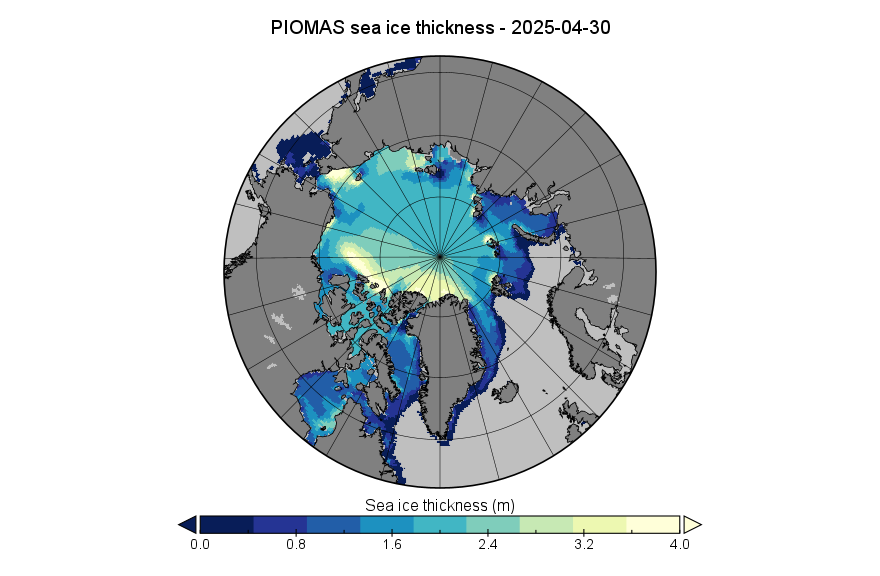
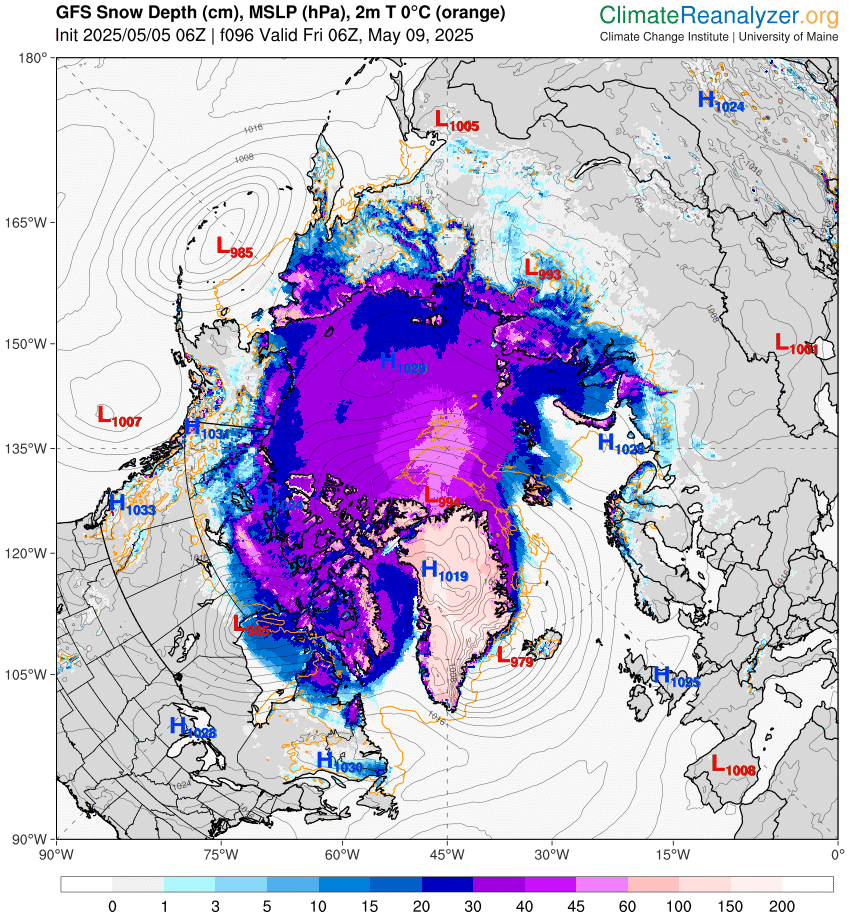
The PIOMAS sea ice thickness map for April 30th once again shows a large area of thick ice on the Siberian side of the Chukchi Sea, together with a band of thin ice on the Alaskan side.
There is also an arm of thick ice in the northern Beaufort Sea, but areas of thin ice in the Amundsen Gulf and McClure Strait:
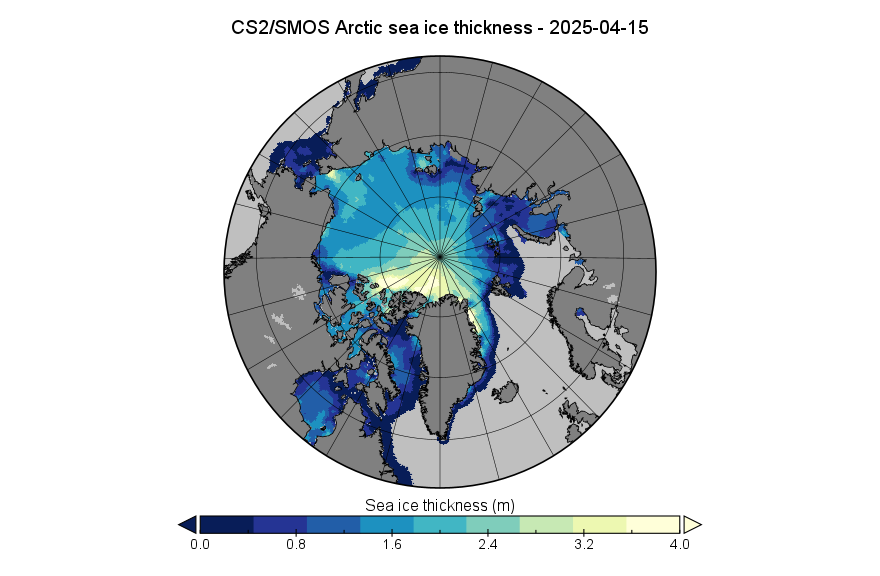
CryoSat-2/SMOS data processing stopped for the summer season on April 15th. Here is the “near real time” version 2.06 thickness map:
Here too is the version 3.00 map, which also incorporates data from the Sentinel 3 satellites:
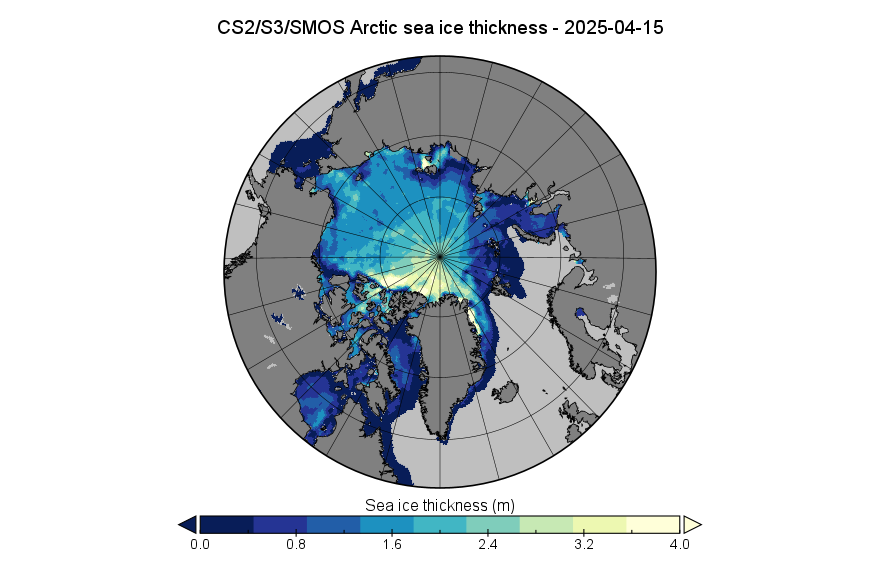
Thick ice in the Chukchi and Beaufort Seas is conspicuous only by its absence two weeks ago. It will be interesting to sea what the “reanalysed” version reveals in due course.
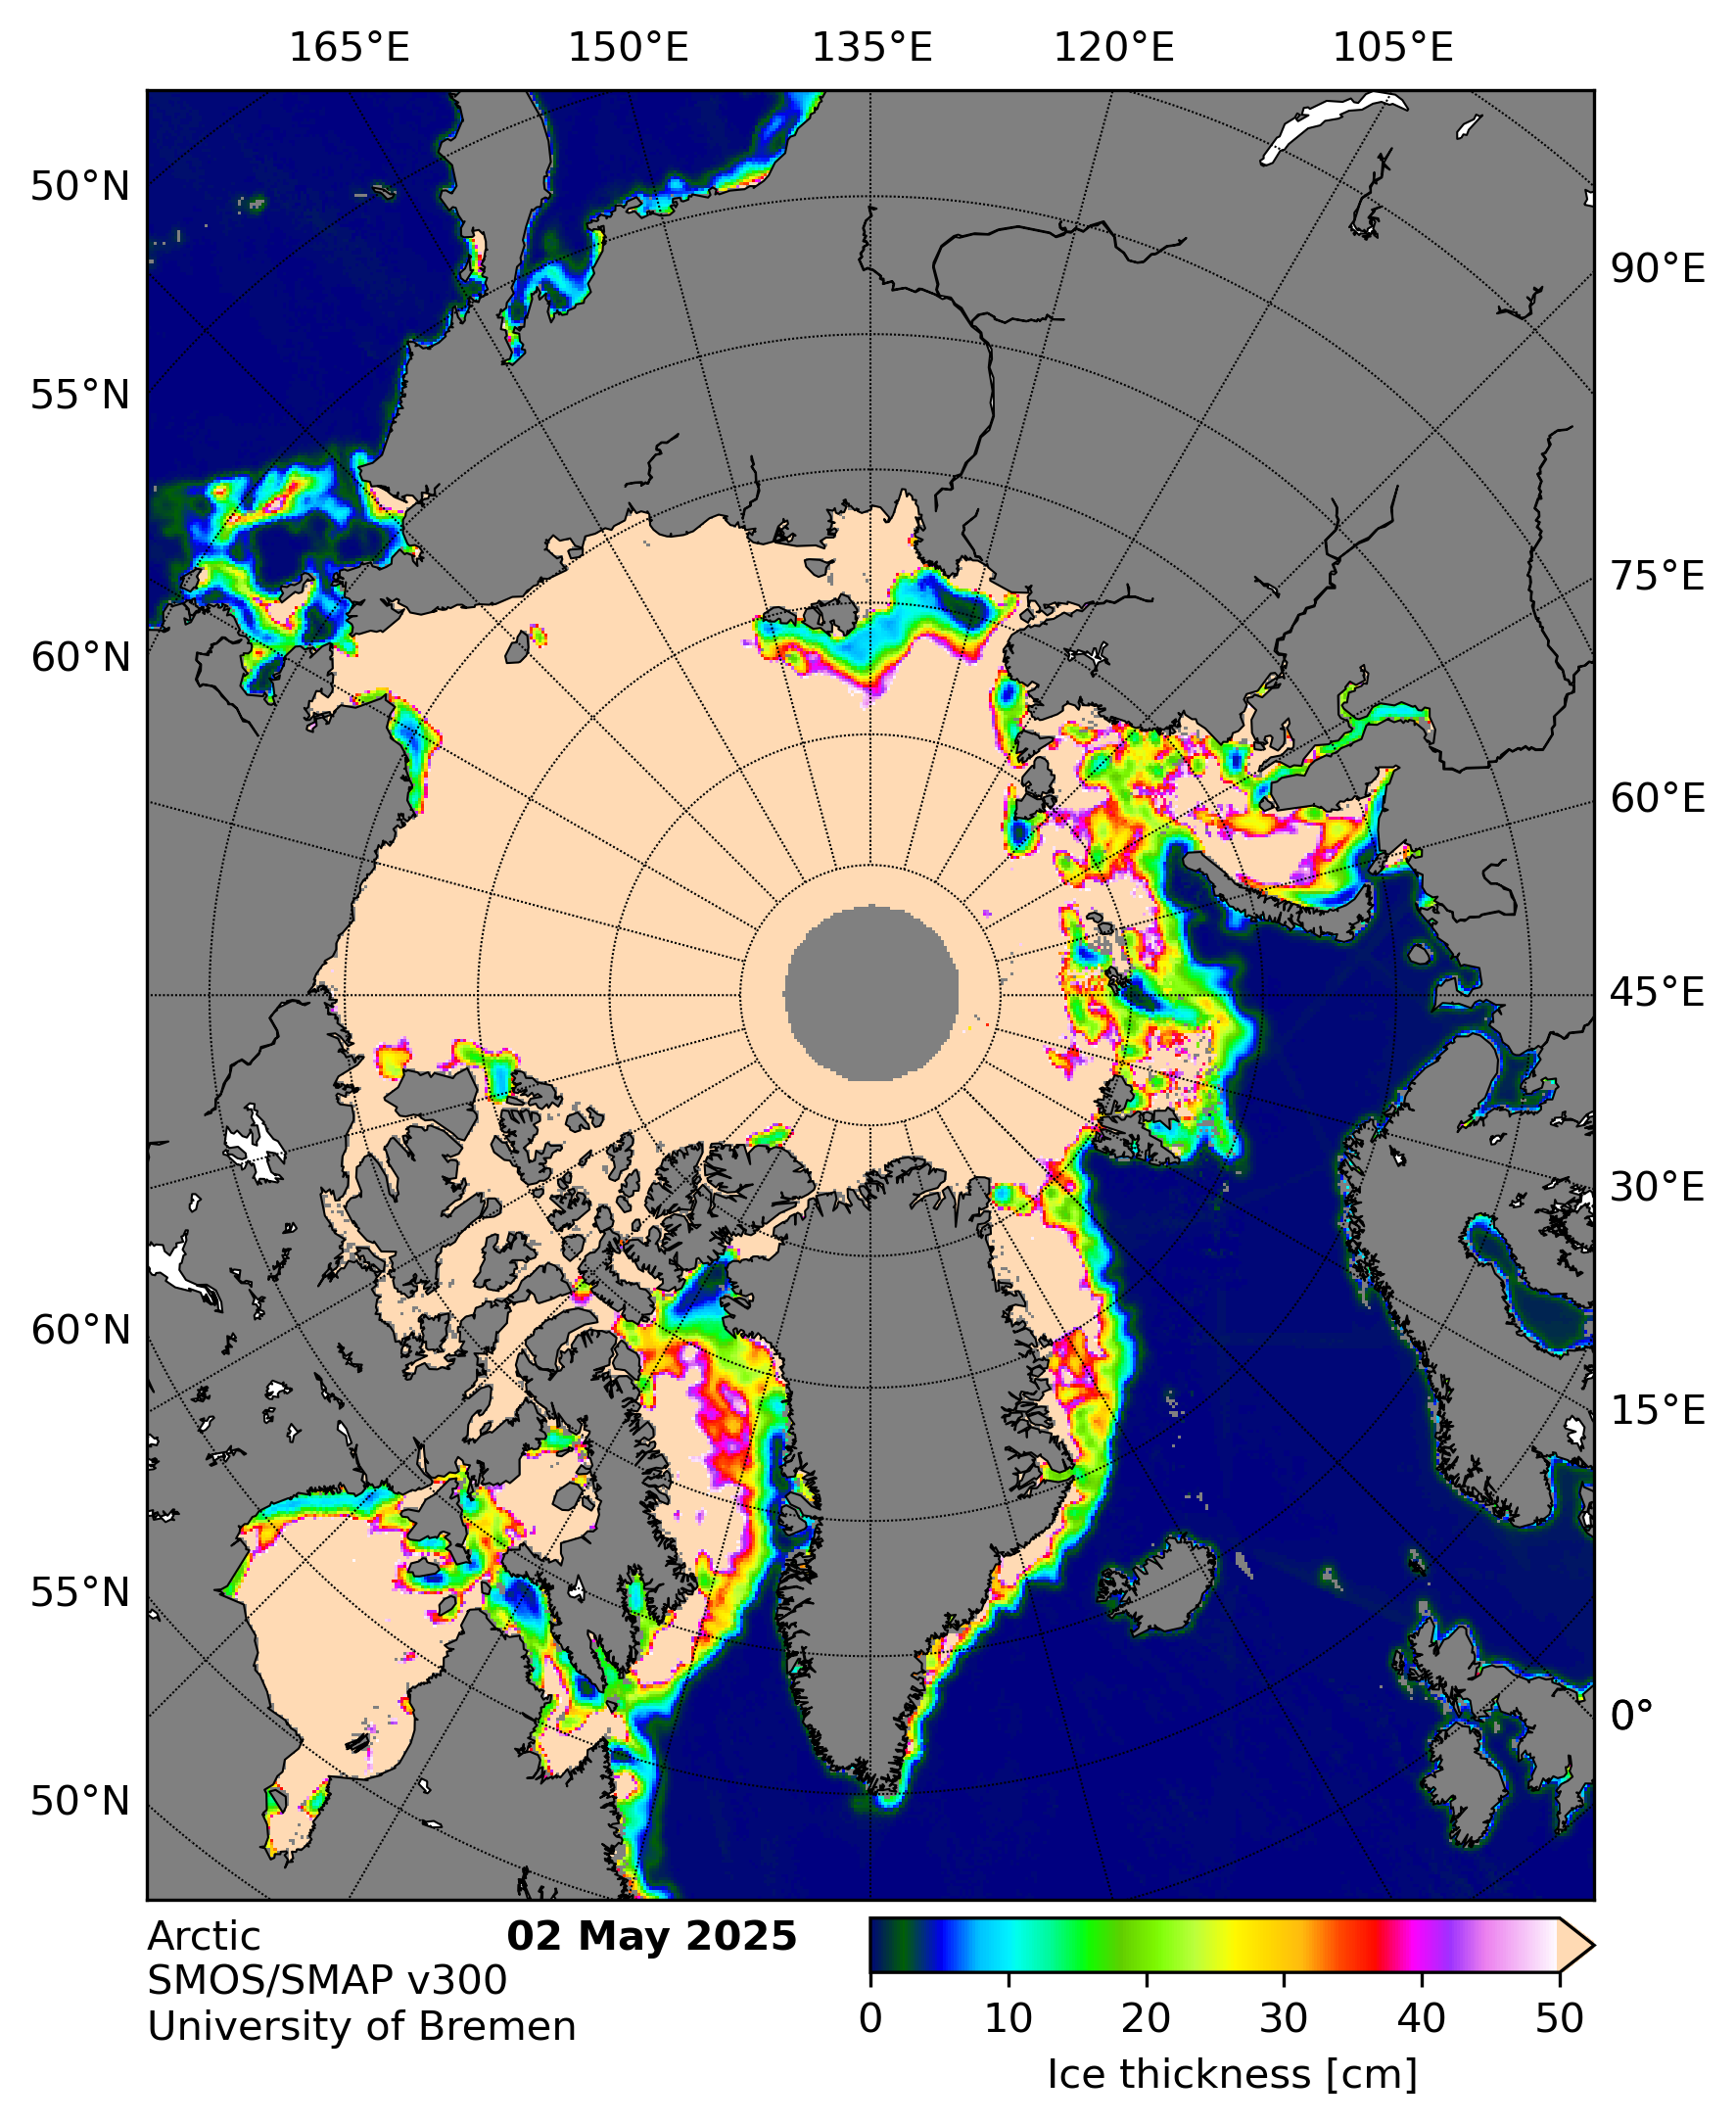
Here too is the latest SMOS/SMAP “thin ice thickness” map:
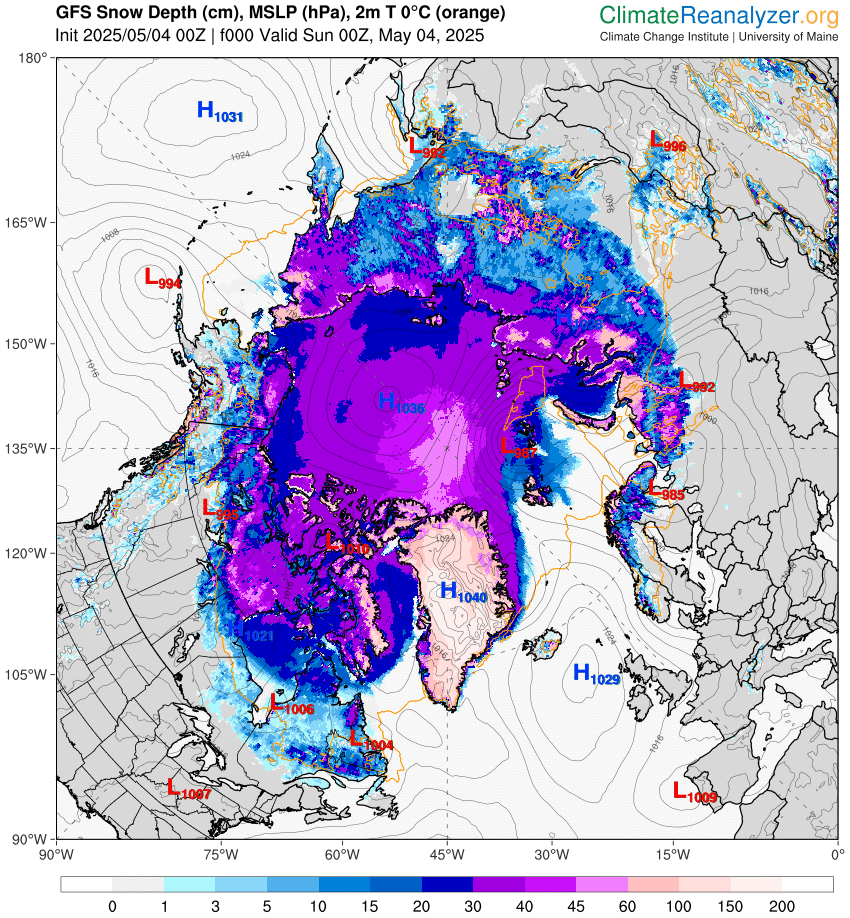
The first part of the GFS forecast has come to pass. A low pressure area with a current MSLP of 987 hPa has reached the central Arctic:
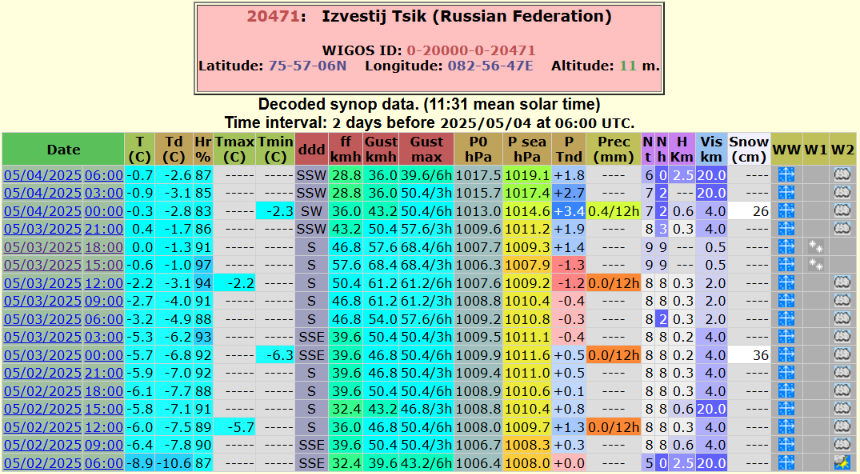
The air temperature at Troynoy Island in the Kara Sea has recently risen above zero degrees Celsius:
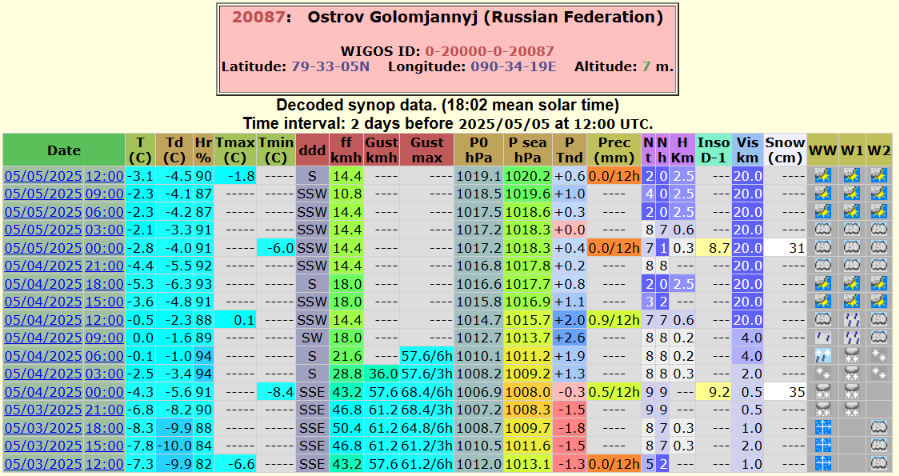
The air temperature at Ostrov Golomjannyj in Severnaya Zemlya briefly reached zero degrees Celsius yesterday:
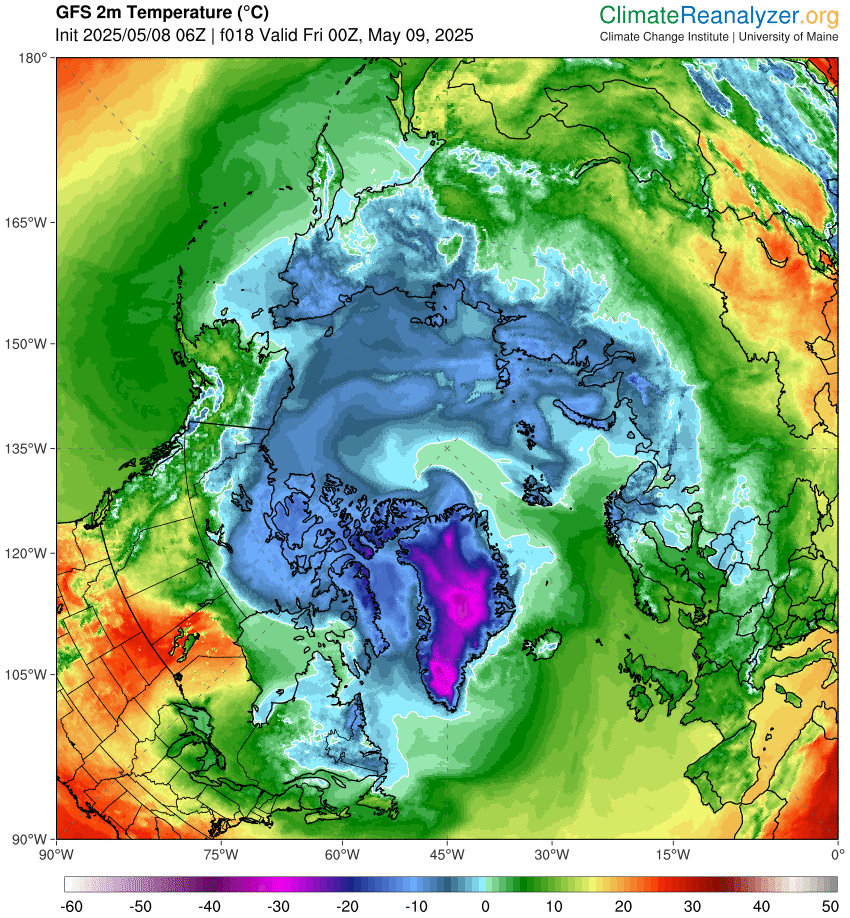
The latest GFS forecast shows temperature at the North Pole reaching 0 °C on Friday morning:
In other news, here is the latest in Dave Borlace’s series of Arctic themed videos on his “Just Have a Think” YouTube channel.
Amongst other things Dave discusses a recent paper by Céline Heuzé & Alexandra Jahn entitled “The first ice-free day in the Arctic Ocean could occur before 2030“
Dave points out that:
[Update – May 7th]Now you might think that the biggest variable affecting an ice-free day would be our global greenhouse gas emissions…
But here’s the thing. In all but the very lowest of the IPCC’s so called Shared Socioeconomic Pathways, or SSPs, global emissions were NOT found to be a significant factor in the near-term projections that these researchers analysed…
The more plausible interpretation of the lack of SSP influence is that the majority of the damage from greenhouse gases, at least as far as the Arctic is concerned, has probably already been done, and the flywheel is already in full swing, so to speak.
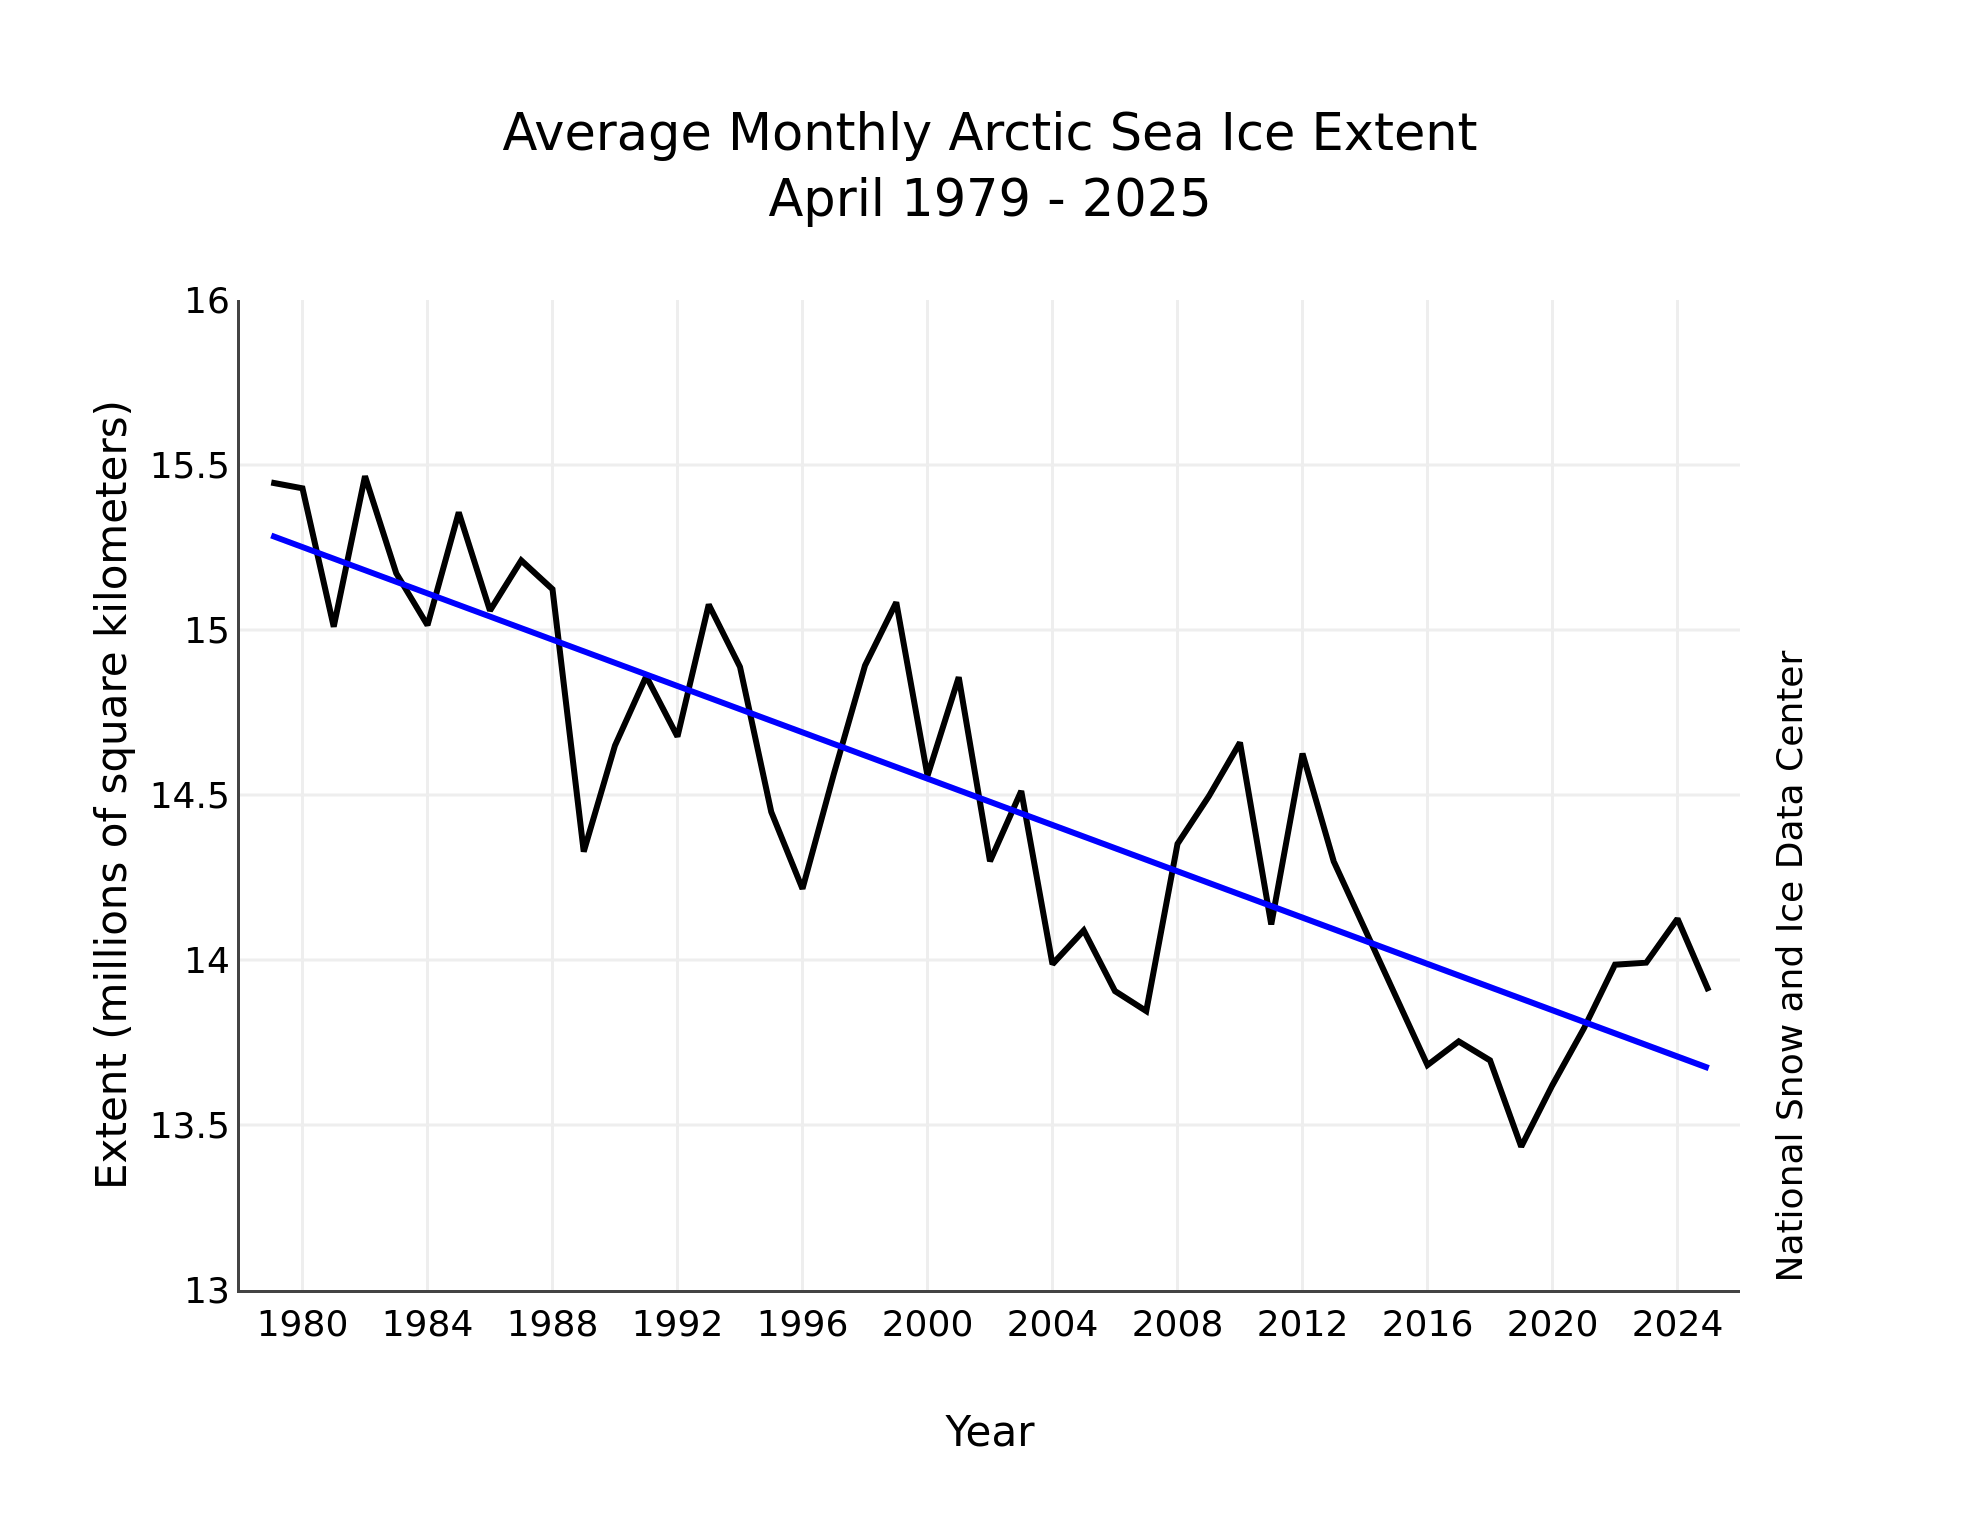
According to the April edition of the National Snow and Ice Data Center’s “Sea Ice Today” analysis:
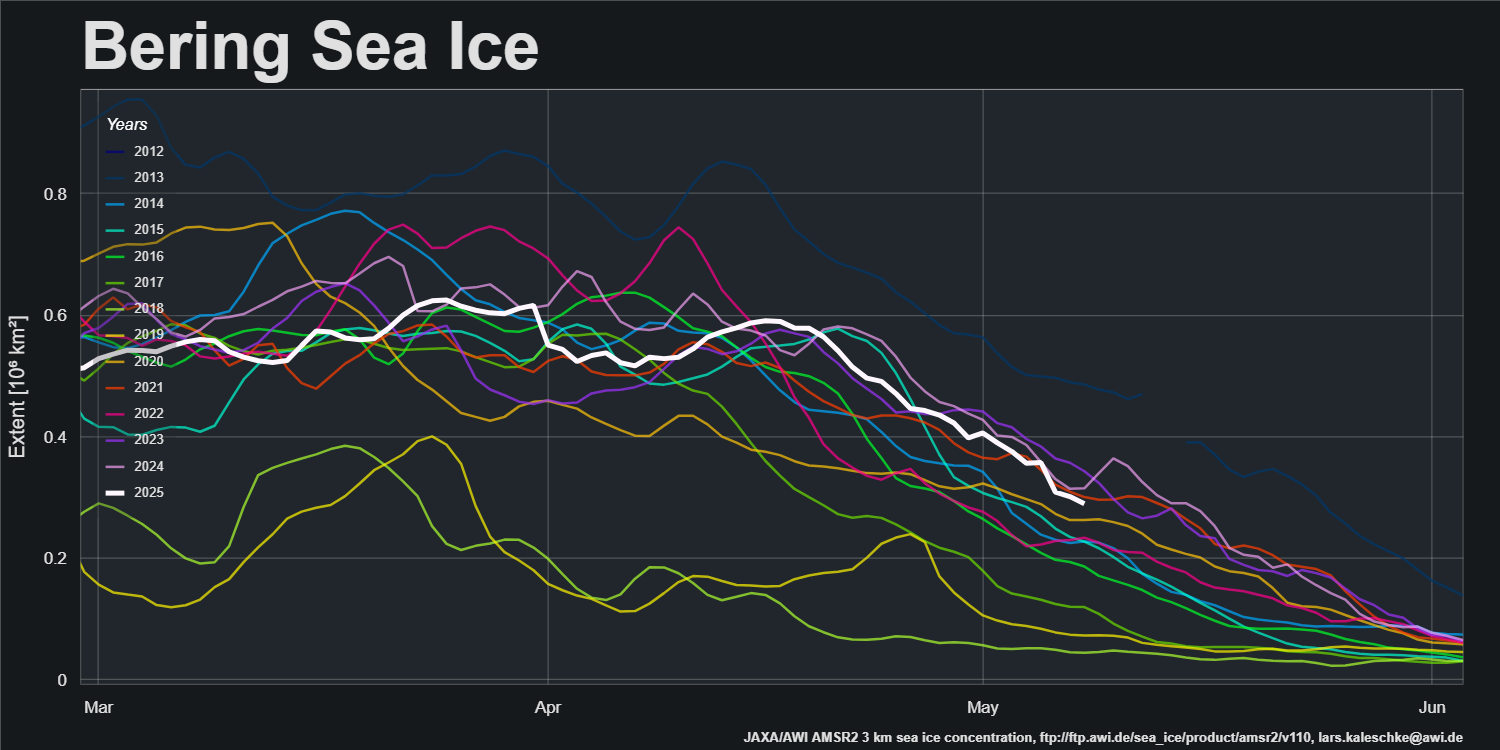
April Arctic sea ice extent averaged 13.91 million square kilometers, statistically tied with April 2006 for ninth lowest in the 47-year satellite record. It was 480,000 square kilometers above the record low April extent set in 2019. Extent remained nearly constant at roughly 14 million square kilometers until the last few days of the month when it started to drop. The fairly quick drop at the end of the month was the result of ice retreat along the coast of the Barents Sea and around Novaya Zemlya. During this time, the North Water Polynya in northern Baffin Bay also opened. While it is certainly unusual to have an overall static ice cover after the maximum extent is reached, similar periods with little change were observed in earlier years. The primary reason why April 2025 total extent remained largely flat was an increase in extent in the northeastern Barents Seas, which offset loss elsewhere. Total extent at month’s end was still 780,000 square kilometers below the 1981 to 2010 average. Sea ice was also regionally low in the Barents Sea (despite the growth), Sea of Okhotsk, Bering Sea, and Labrador Sea.
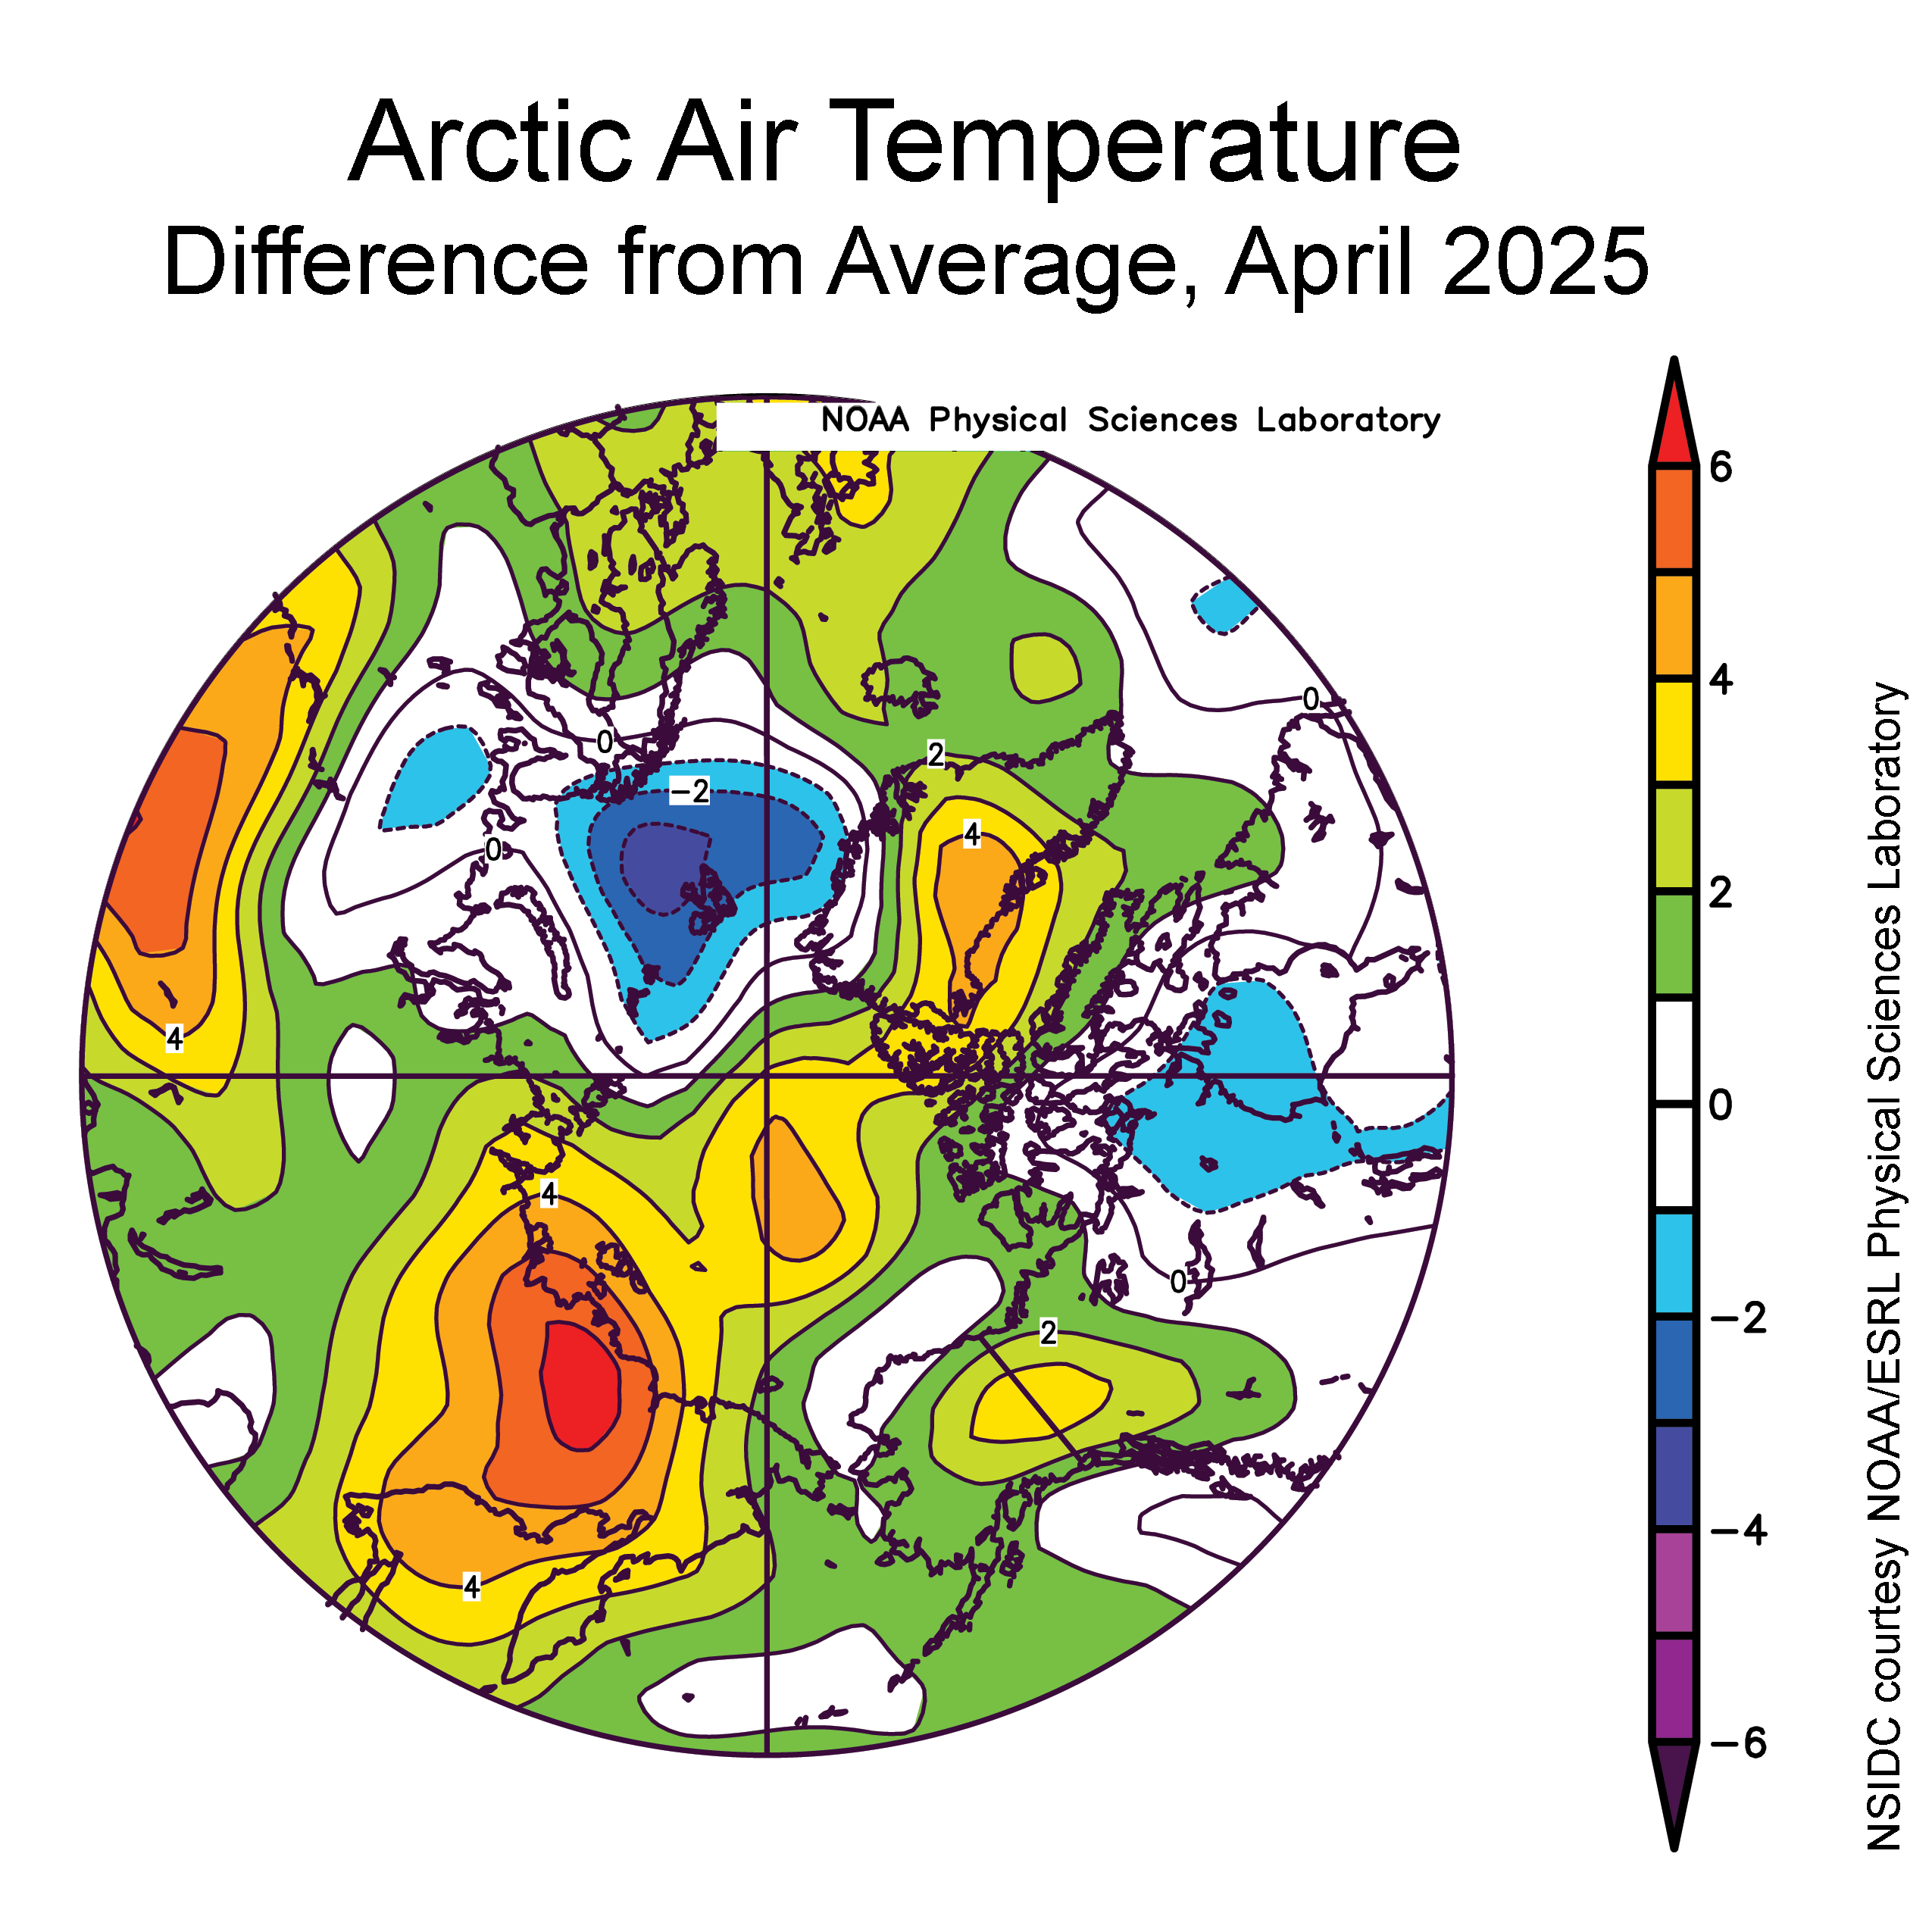
The notable feature of April 2025 was below average air temperatures over the northern Norwegian and Barents Seas; elsewhere over the Arctic Ocean temperatures were from 1 to 4 degrees Celsius above average:
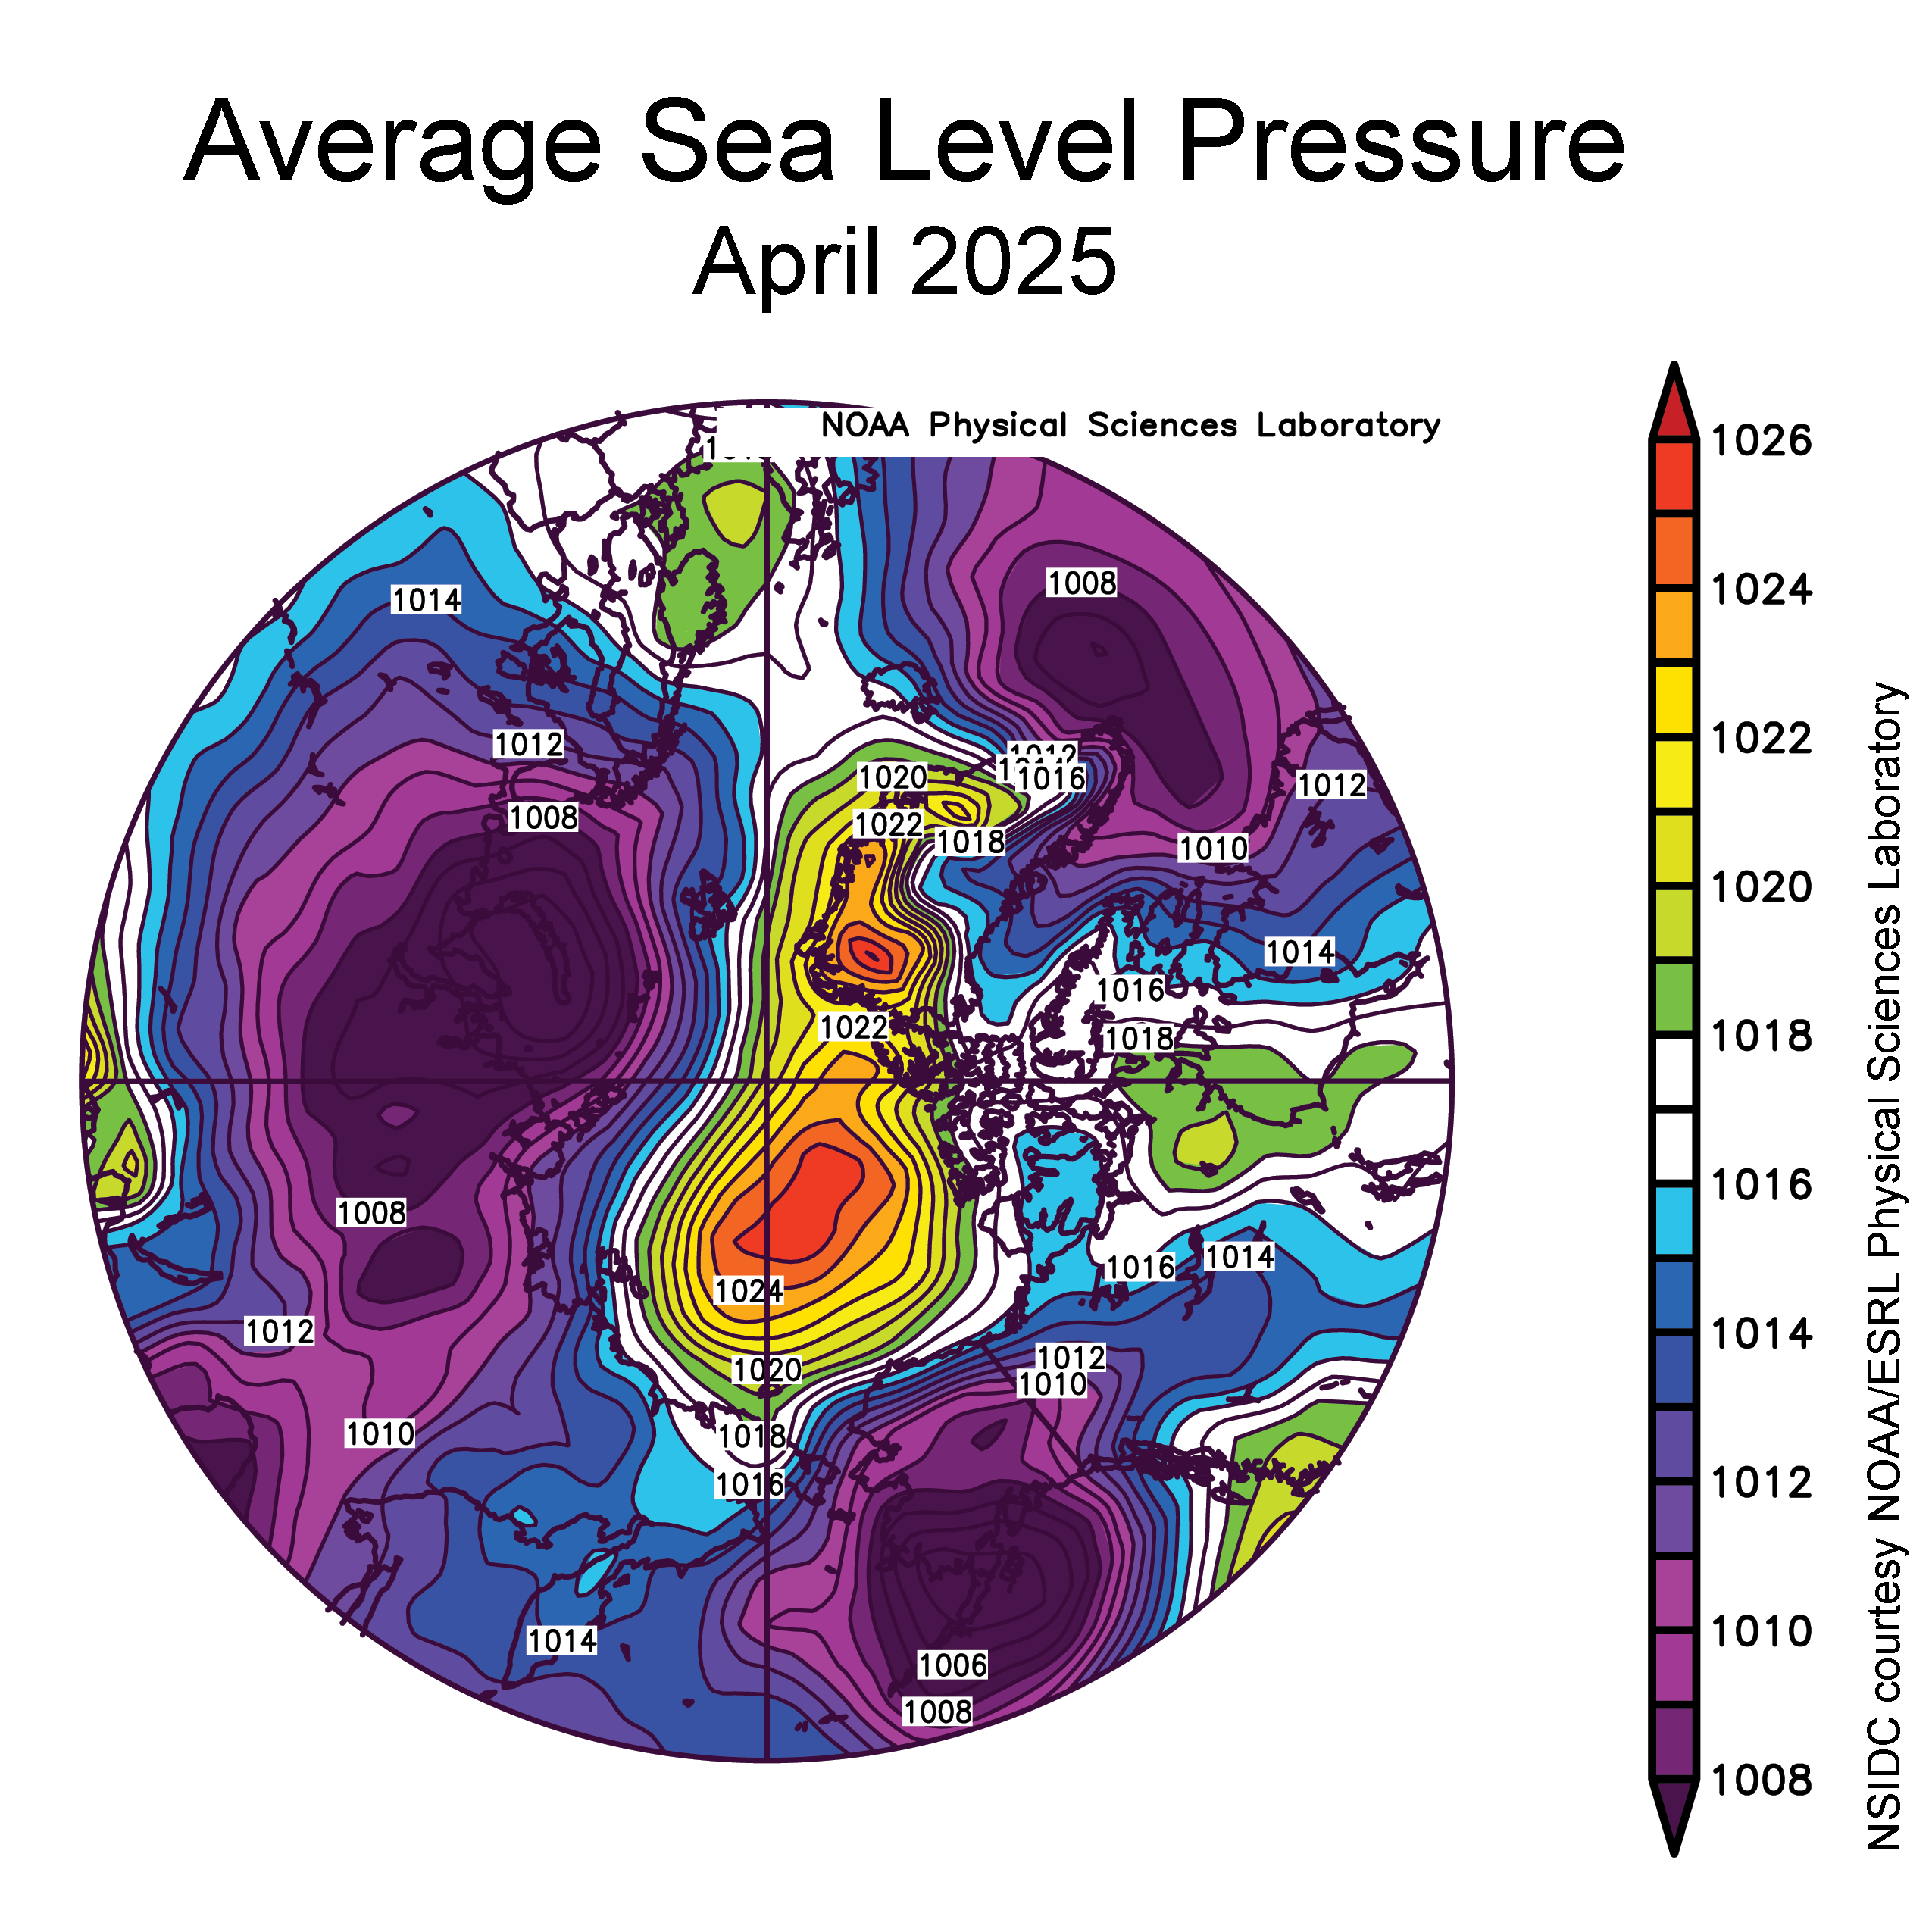
The low temperatures in the Norwegian and Barents Seas clearly relate to the monthly averaged sea level pressure field, featuring unusually high pressure over the Northern Canada Basin and extending over Greenland and unusually low pressure centered over northern Eurasia and southern Alaska. This combination points to strong and cold winds from the North over the northern Norwegian and Barents Seas. The especially strong pressure gradient across the Fram Strait, between northern Greenland and the Svalbard Archipelago, also points to a strong transport of sea ice out of the Arctic Ocean and into the East Greenland Sea:
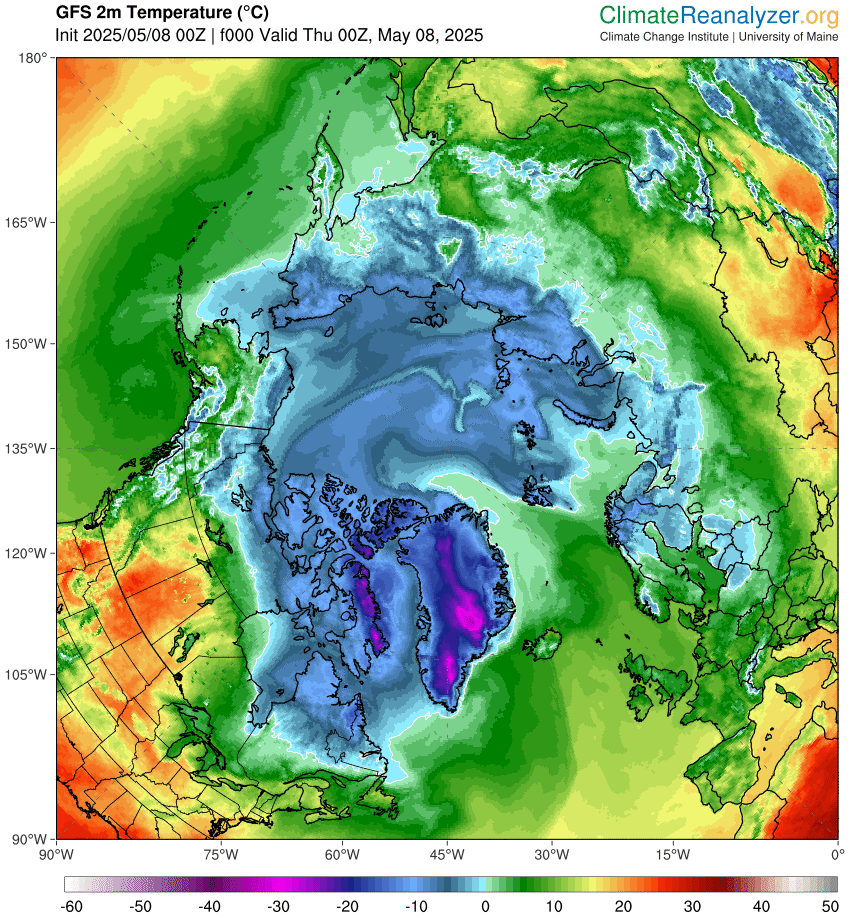
If GFS is to be believed surface air temperature north of Greenland has already risen above freezing point:
By midnight tonight UTC the North Pole is also forecast to be above 0 °C:
After a week’s absence AMSR2 data is flowing to AWI once again. Hence new dots have appeared on the pan Arctic and regional area graphs:
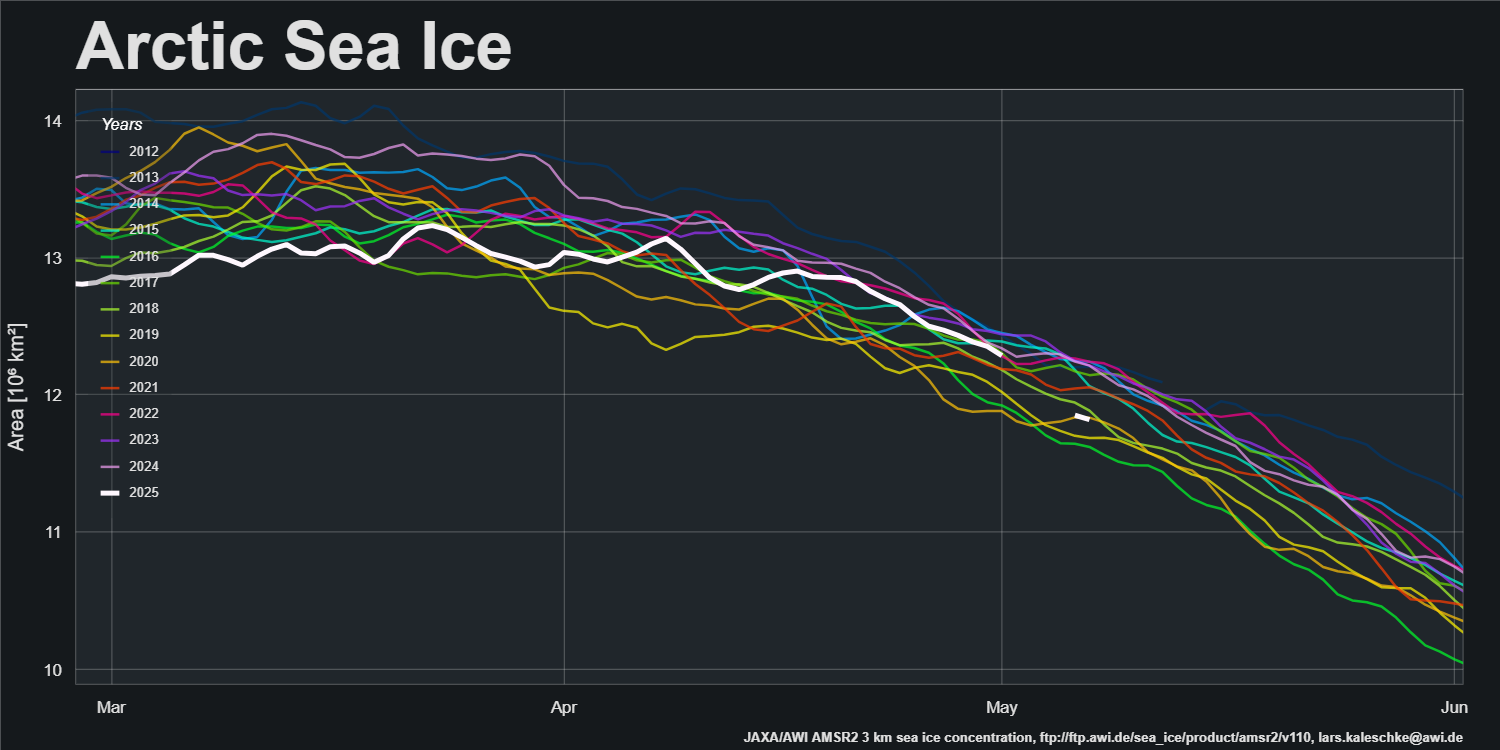
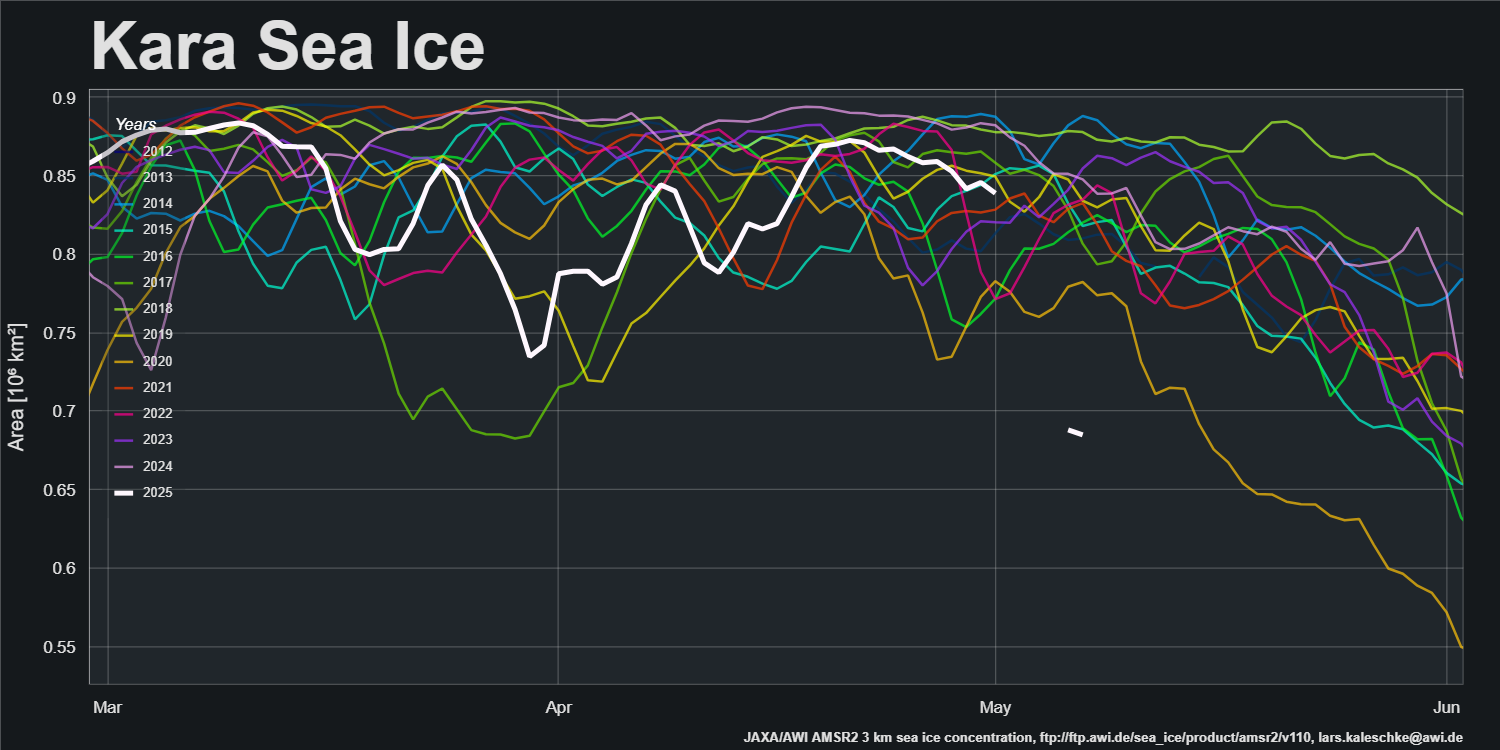
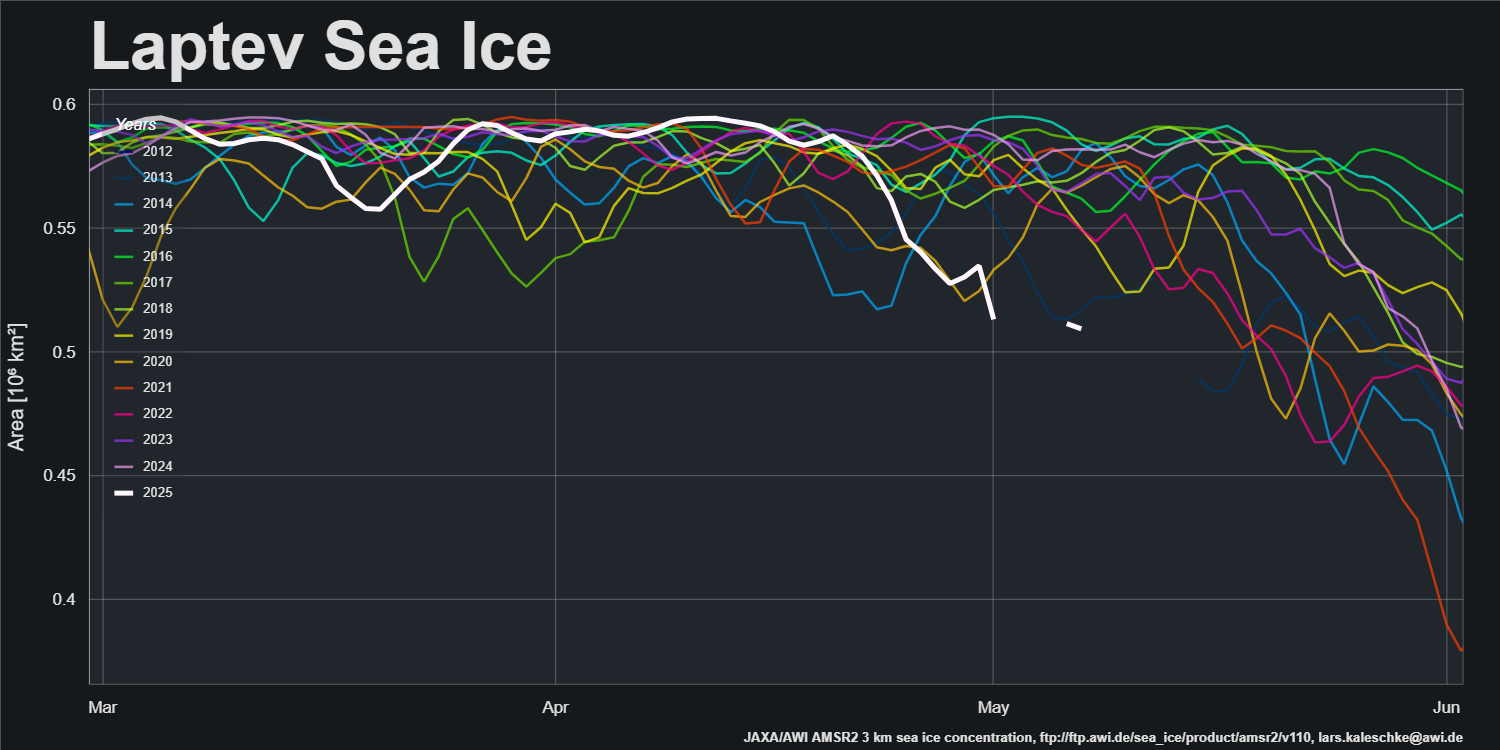
Note in particular that sea ice area in the Laptev and Kara Seas are both currently “lowest for the date” in the AMSR2 era.
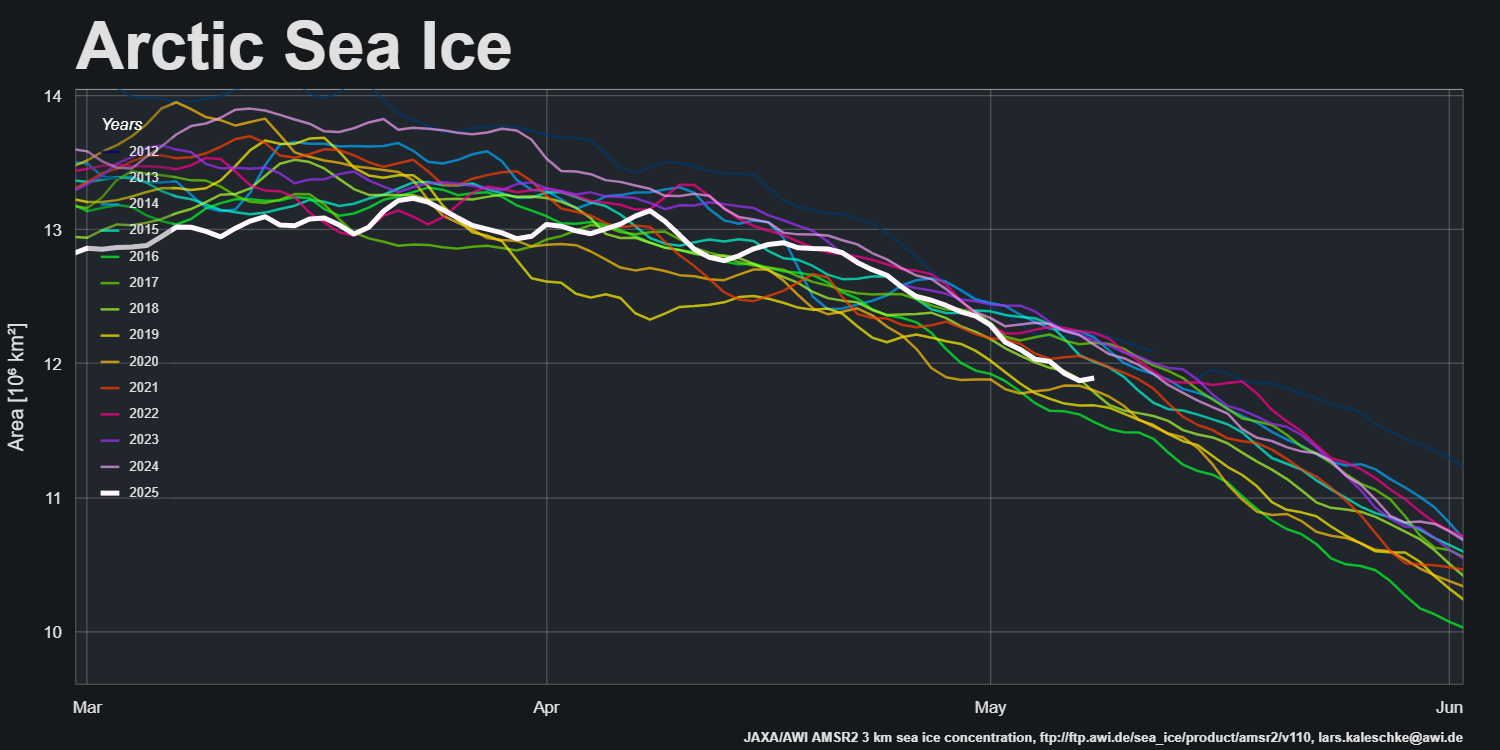
[Update – May 9th]Normal service has been resumed at AWI. Arctic sea ice area is currently in the middle of the AMSR2 era pack:
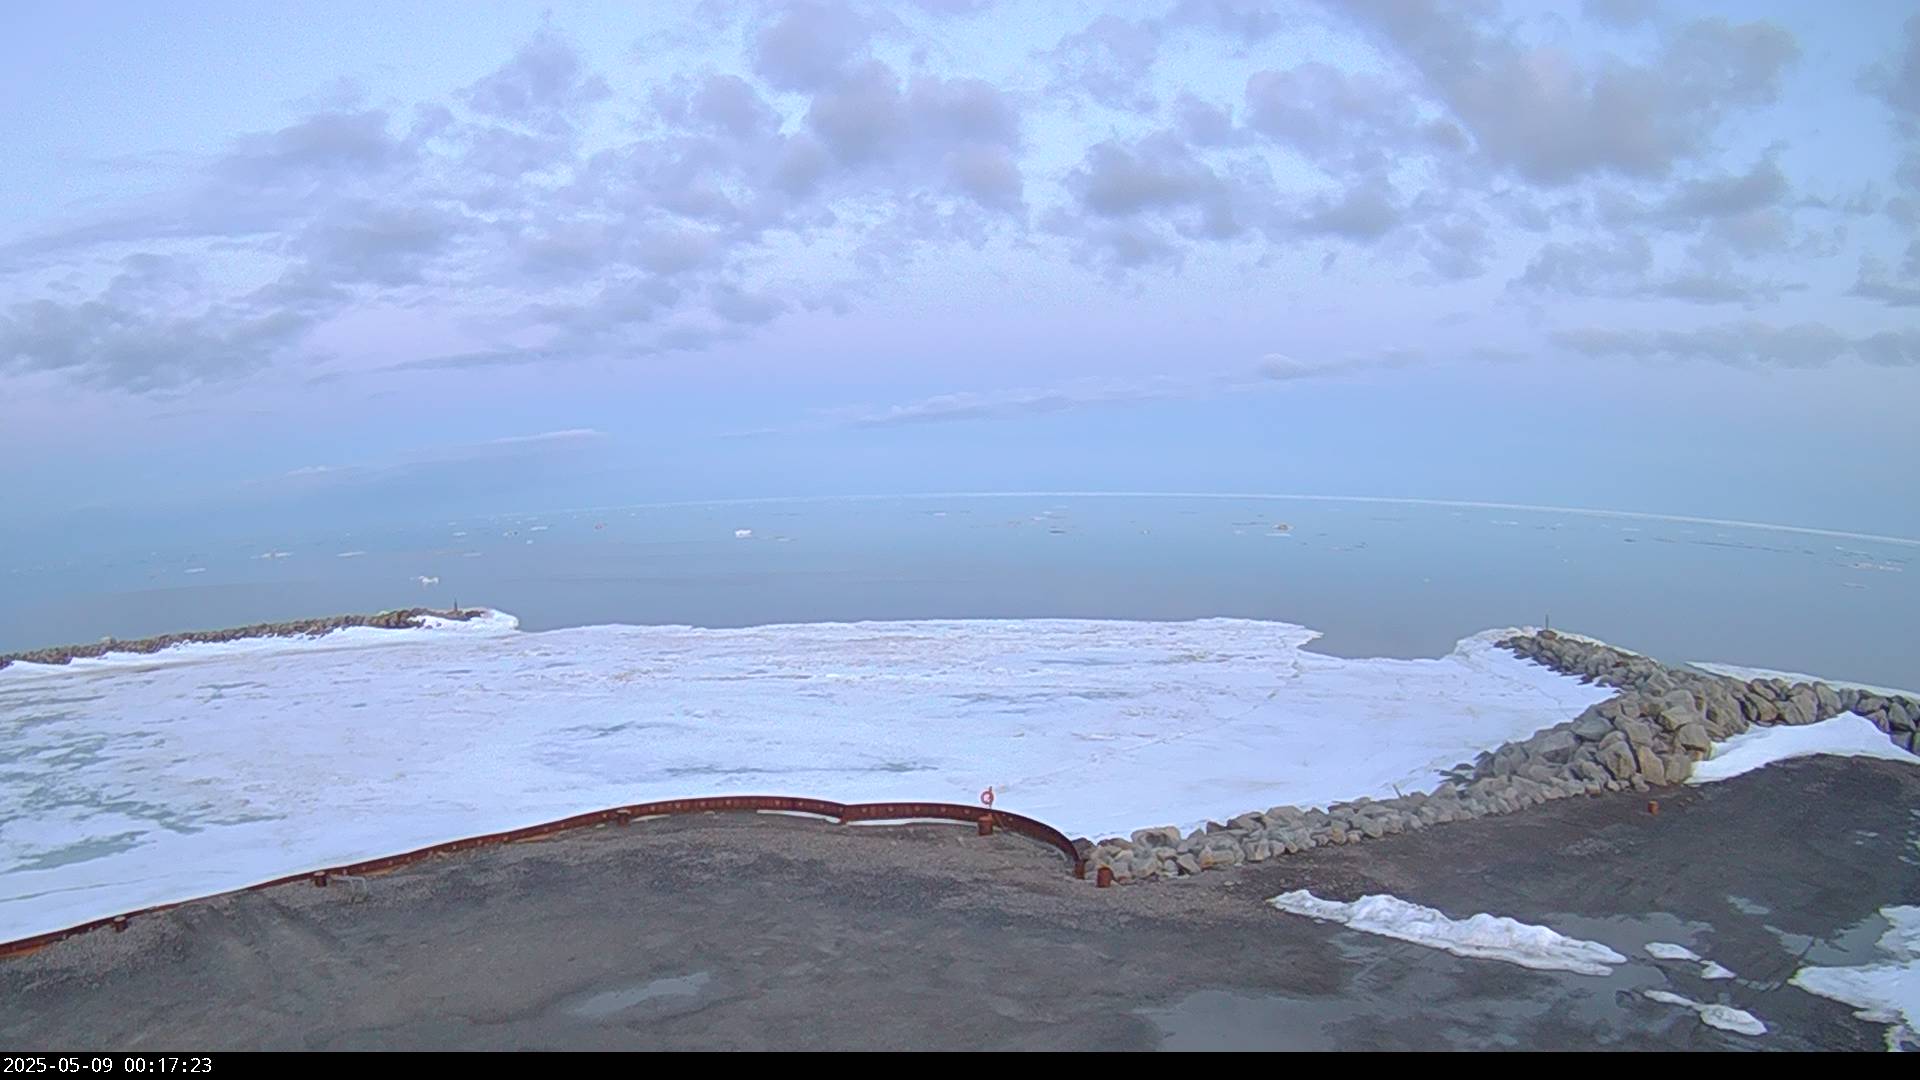
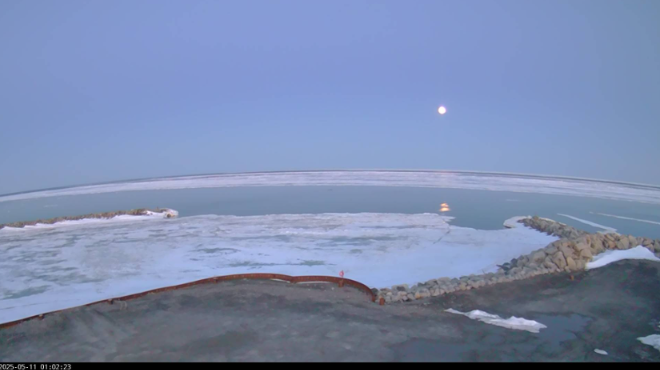
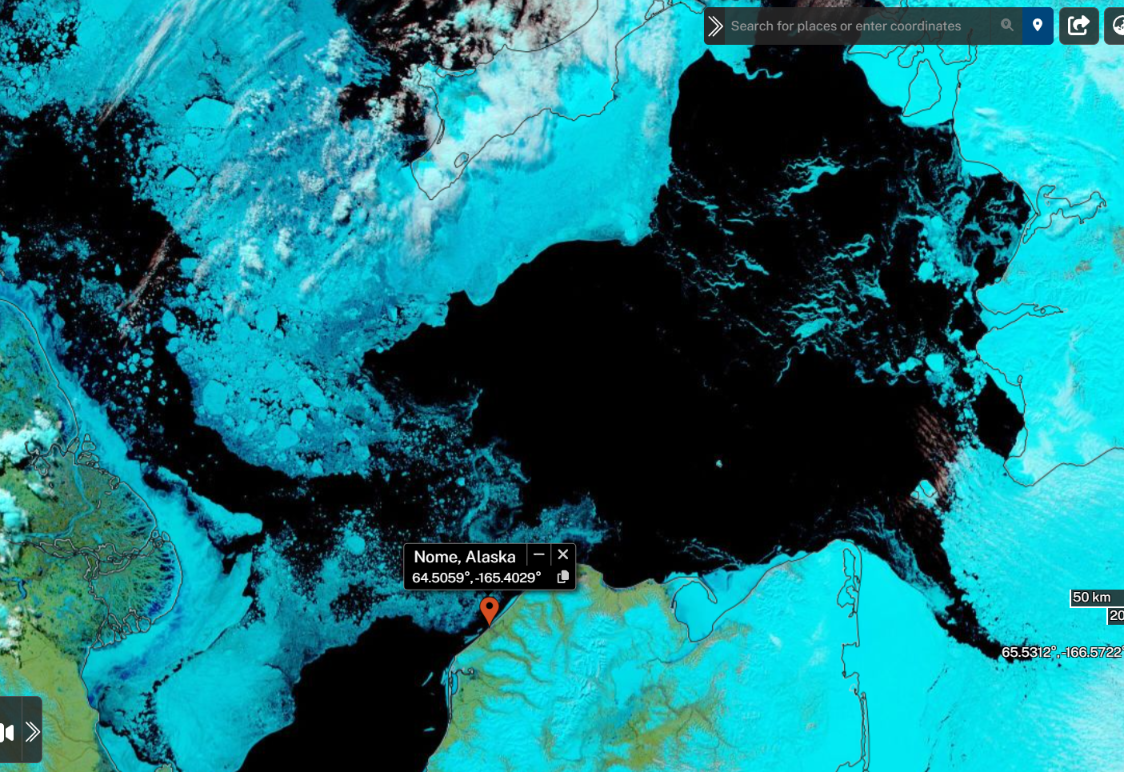
Today there are melt ponds / bare ice visible on the sea ice in Nome Harbour, with open water offshore and the pack visible on the horizon:
The Rutgers University northern hemisphere snow cover anomaly for April 2025 is as negative as it has ever been:
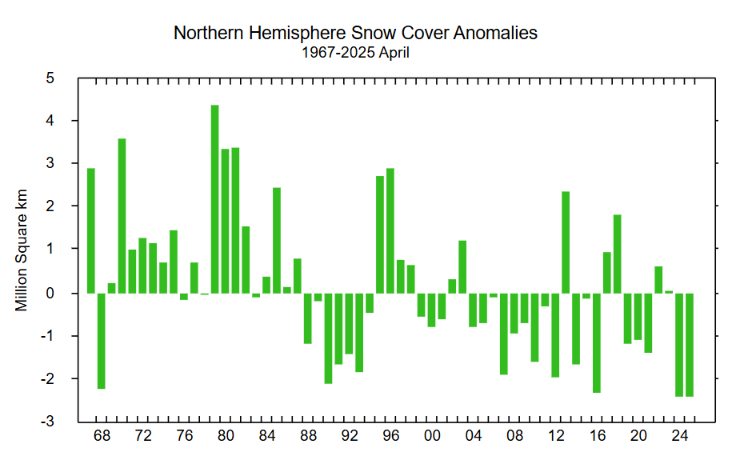
Evidently things are warming up in the Arctic, literally and metaphorically.
JAXA extent posted a “century break” yesterday. A loss of 111 thousand km² to be more precise:
The pack is no longer “on the horizon” at Nome!
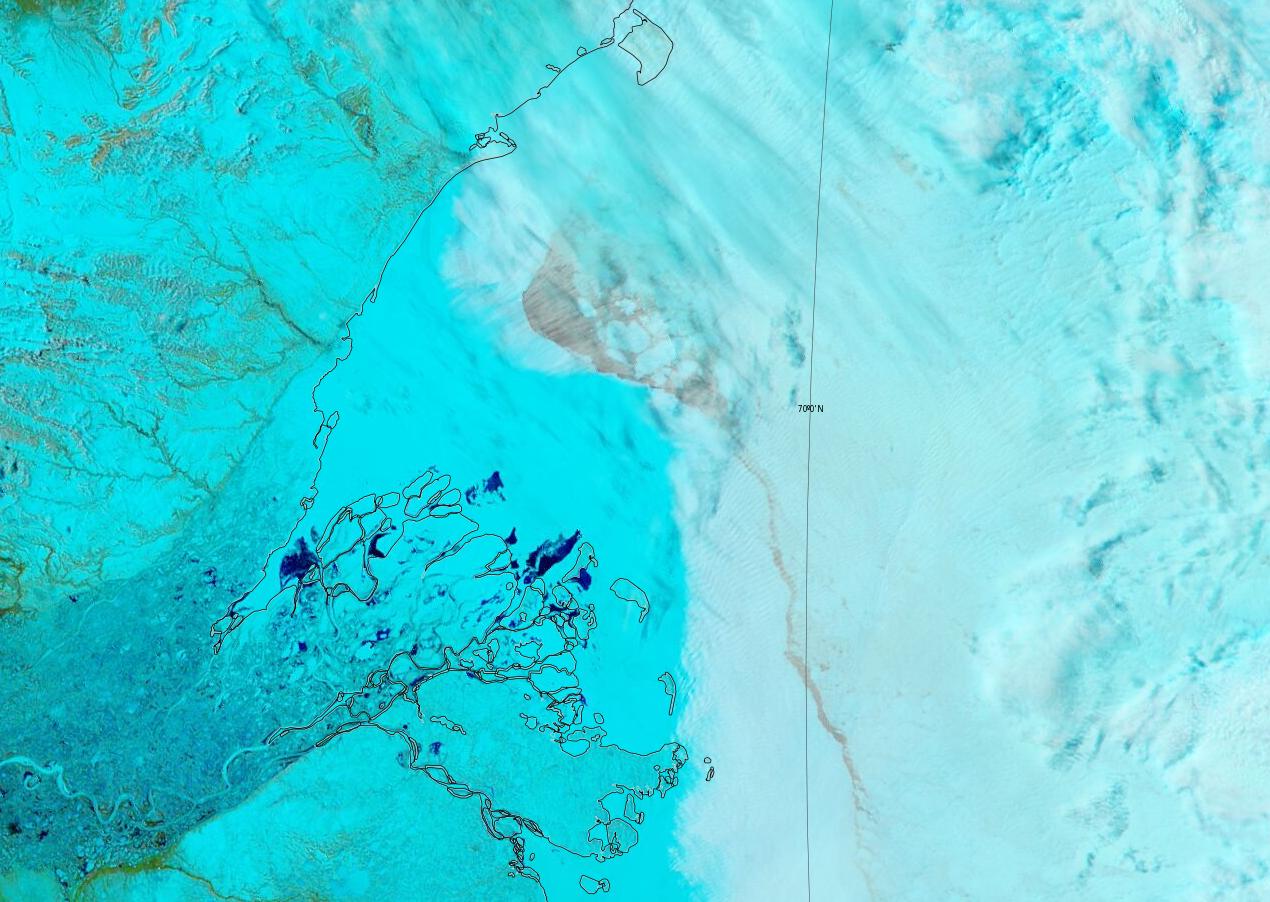
The snow has been melting along the valley of the Mackenzie River. The resulting increased flow at the mouth of the delta is flooding the fast ice, which has started to break up:
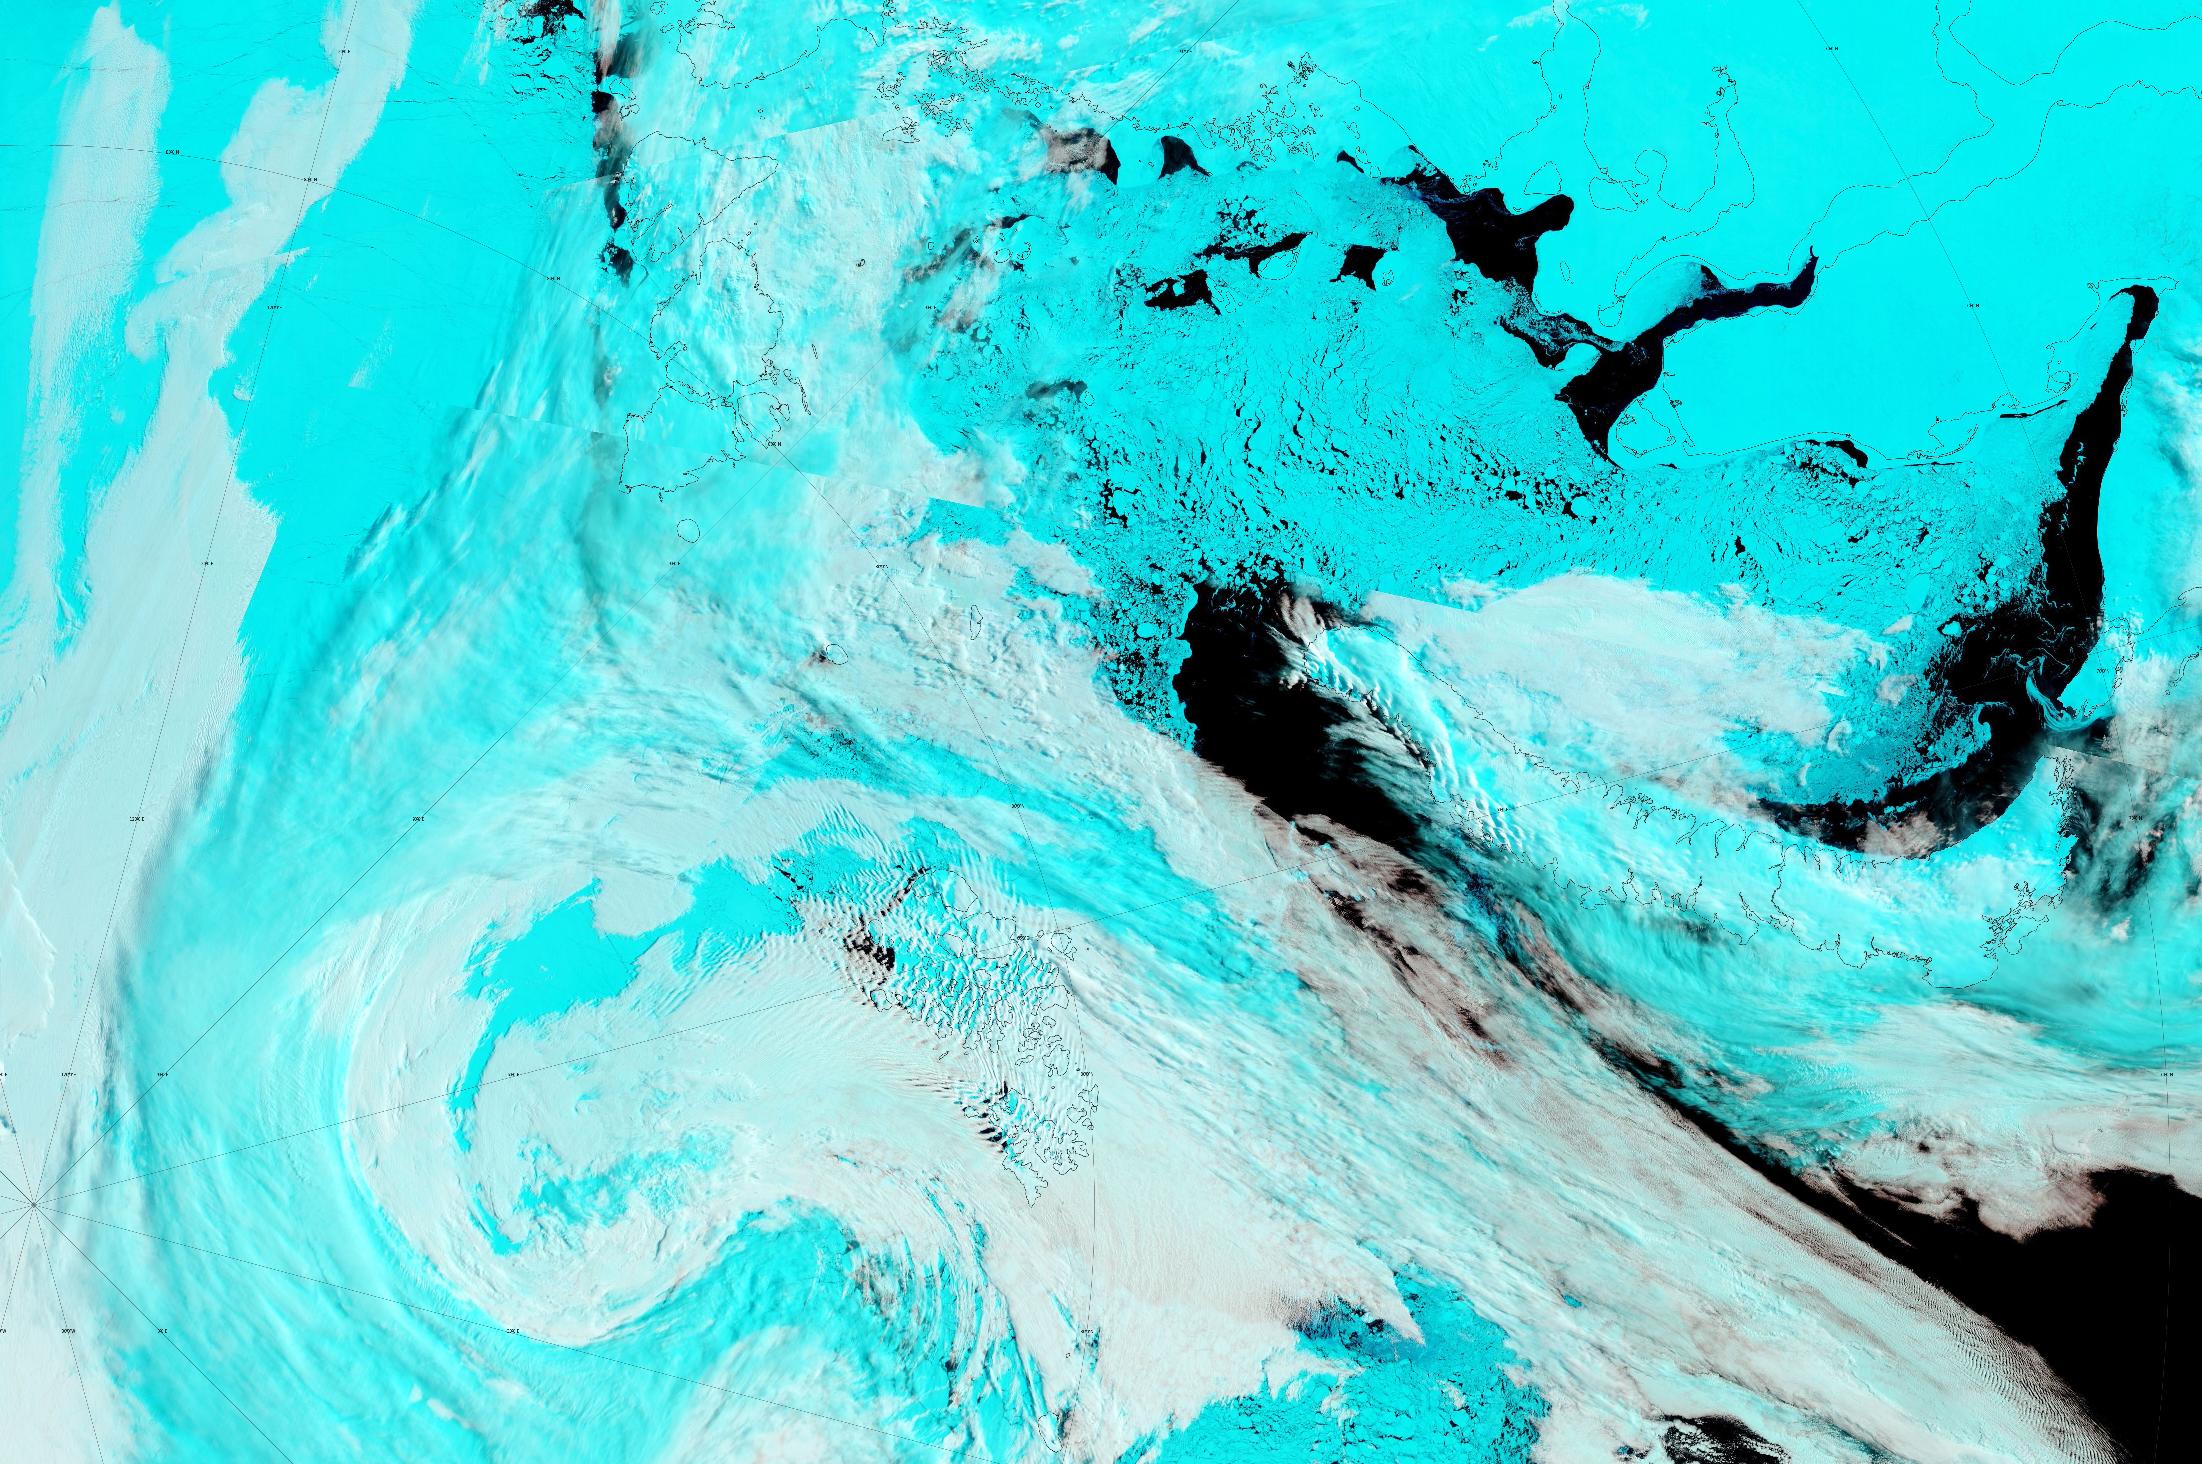
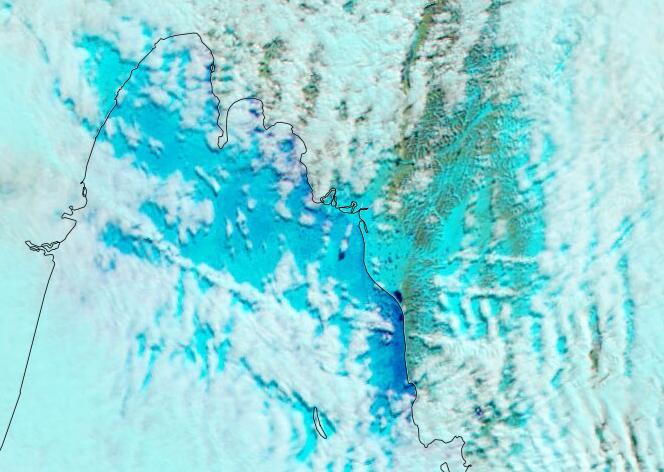
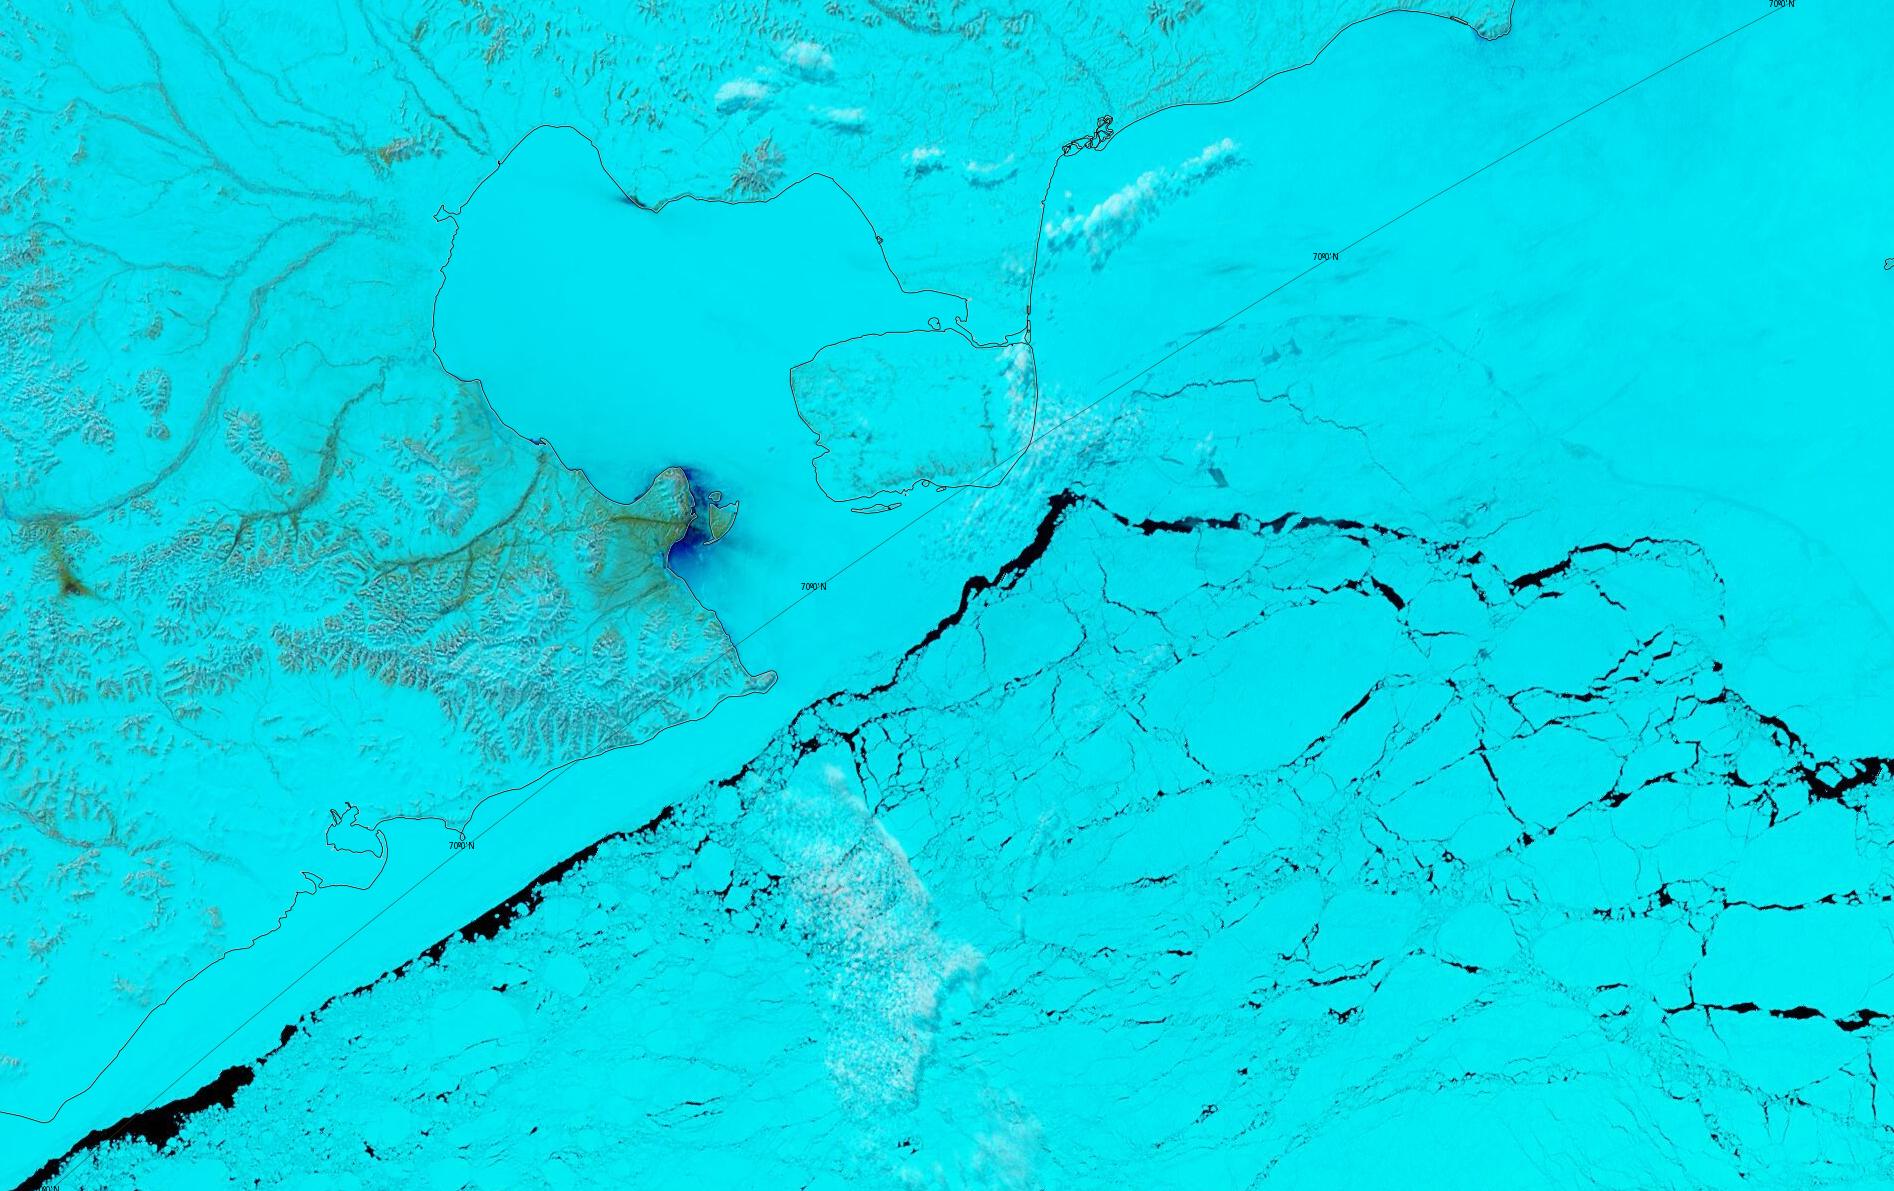
The Aqua satellite managed a glimpse through the clouds over the Laptev Sea today, revealing the onset of surface melt on the near shore fast ice:
Likewise in the area around Pevek in Chaunskaya Bay:
The conversation continues over on the June open thread.
Here’s a recently published paper in Geophysical Research Letters:
“Regime Shift in Arctic Ocean Sea-Ice Extent”
According to the abstract:
Well, we have reached a point where on a bad year, only the most difficult to melt ice remains in September, ie the thick ice north of the CAA, Greenland, and of course the melt season is very short north of 80°.
The sea ice has melted completely in the past, so it’s not illogical to assume it can melt again.
It doesn’t look like its ready to go, in immediate future, though come back in 2050, we might be looking at a different picture.
In my mind the question is, what will be the final straw?
Maybe the warmer water below surface will finish it off, maybe the multi year ice will thin to the point where it exports through the Nares and CAA all winter.
It’s still not, as some have suggested, making any recovery…
It’s certainly not making a “recovery” Tom!
England et al. (2025) assure us that:
That remains to be seen, but with little prospect of the mythical “Net Zero” being achieved in the foreseeable future it seems certain that at some point the rapidly warming Arctic will overcome the sea ice “growth–thickness” negative feedback referred to in Bitz and Roe (2004).
“May you live through interesting times” as the Chinese proverb goes.. we’re watching the biggest experiment in human history!
So Arctic ice has plateaued since 2007, why have you denied that for all these years Jim?
MASIE shows no decrease since 2006 and it is the most precise of all the ice measuring satellites.
I predict that within 5 years arctic ice will start increasing dramatically as the AMO enters its cooling phase.
“Why have you denied that for all these years Jim?”
Where is your evidence for that scurrilous assertion Peter?
“MASIE shows no decrease since 2006 and it is the most precise of all the ice measuring satellites.”
For the umpteenth time, as the besieged NSIDC point out, the MASIE numbers are not suitable for long term comparisons.
“I predict that within 5 years Arctic [sea] ice will start increasing dramatically as the AMO enters its cooling phase.”
I look forward to discussing the matter with you once again at the start of the 2030 melting season!
Hi Jim! Brand new sea ice video, looking for a new record low:
Will sea ice finally melt out or nah
Hello again GS,
An exciting 2025 melting season is to be expected?
“An exciting 2025 melting season is to be expected?”
It’s certainly exciting right now, but how it turns out is simply impossible to say this early in the melt season. Volume wise it didn’t start (net) melting until late April, and so we only have a few days yet of data to go by.
But of course, a flying start of 2nd lowest volume + largely record low ice extent, means that, numerically, at least, it is the best of chances so far, partly because we’re way lower than 2012, and partly because the record already shows no other year beat it (for minimum) yet.