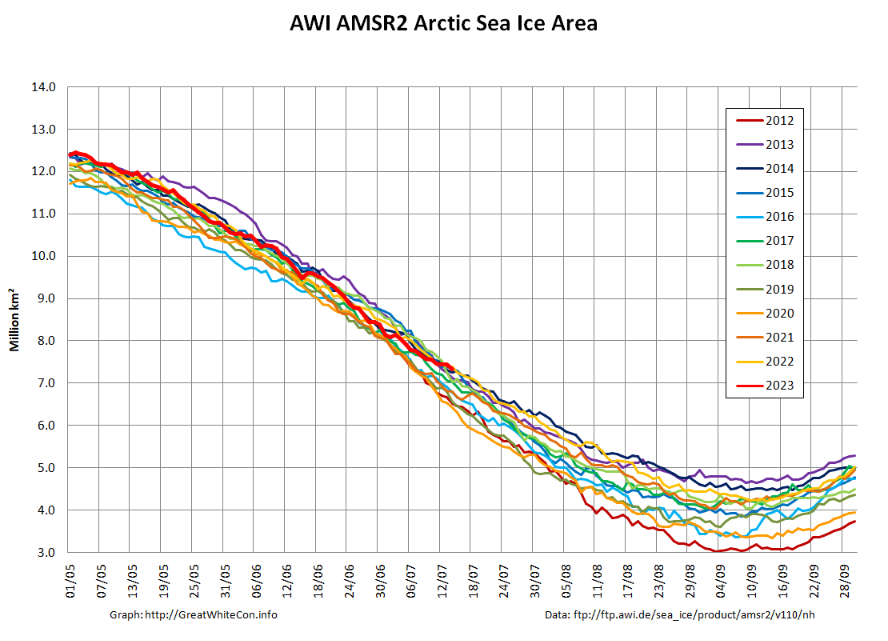
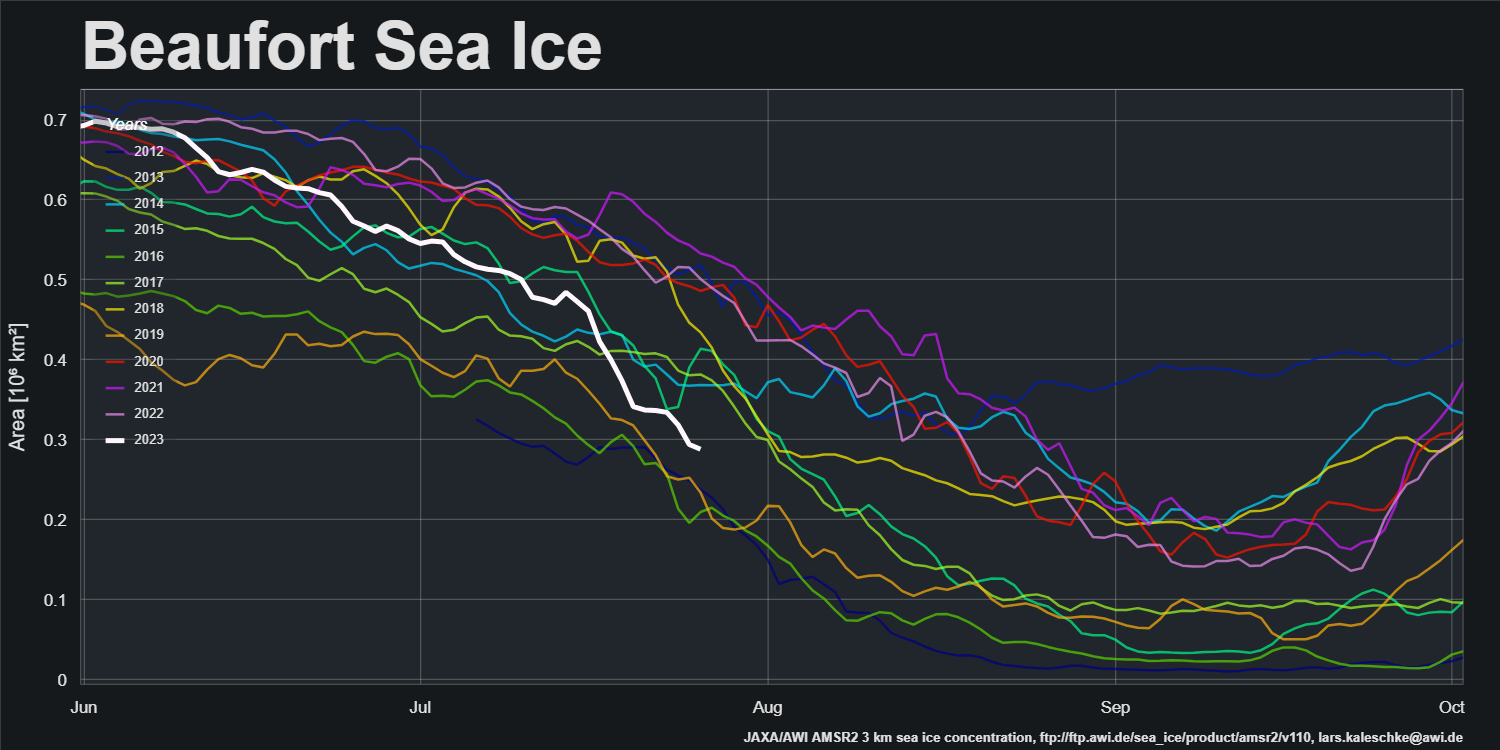
After briefly being near the bottom of the historical range at the beginning of the month, AWI’s high resolution AMSR2 area metric is now back near the top of that range:
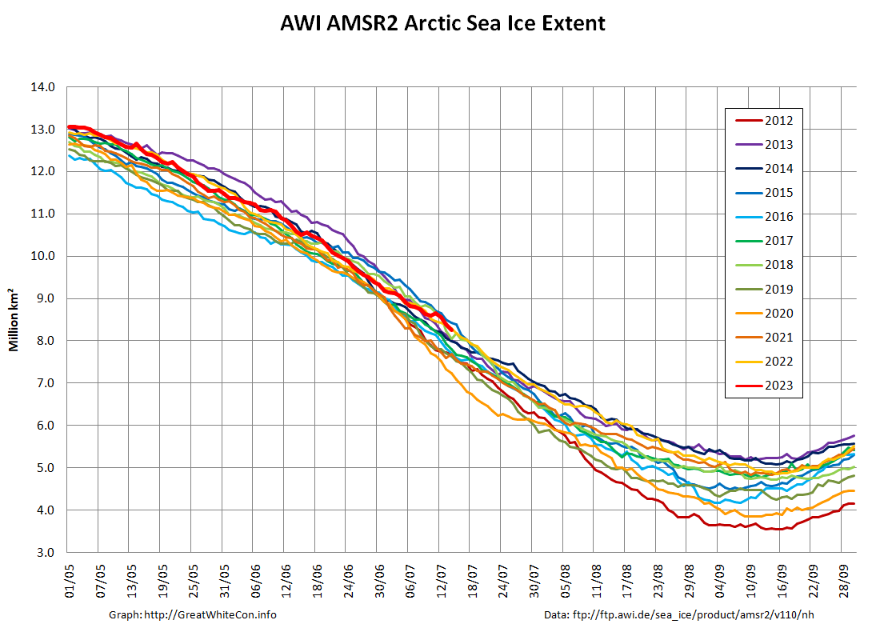
However, although it’s not visible on the area graph extent has recently taken a bit of a tumble:
Here’s an animation showing the motion of sea ice in the Arctic over the last month:
The first Sea Ice Outlook of 2023 has been published by the Sea Ice Prediction Network:
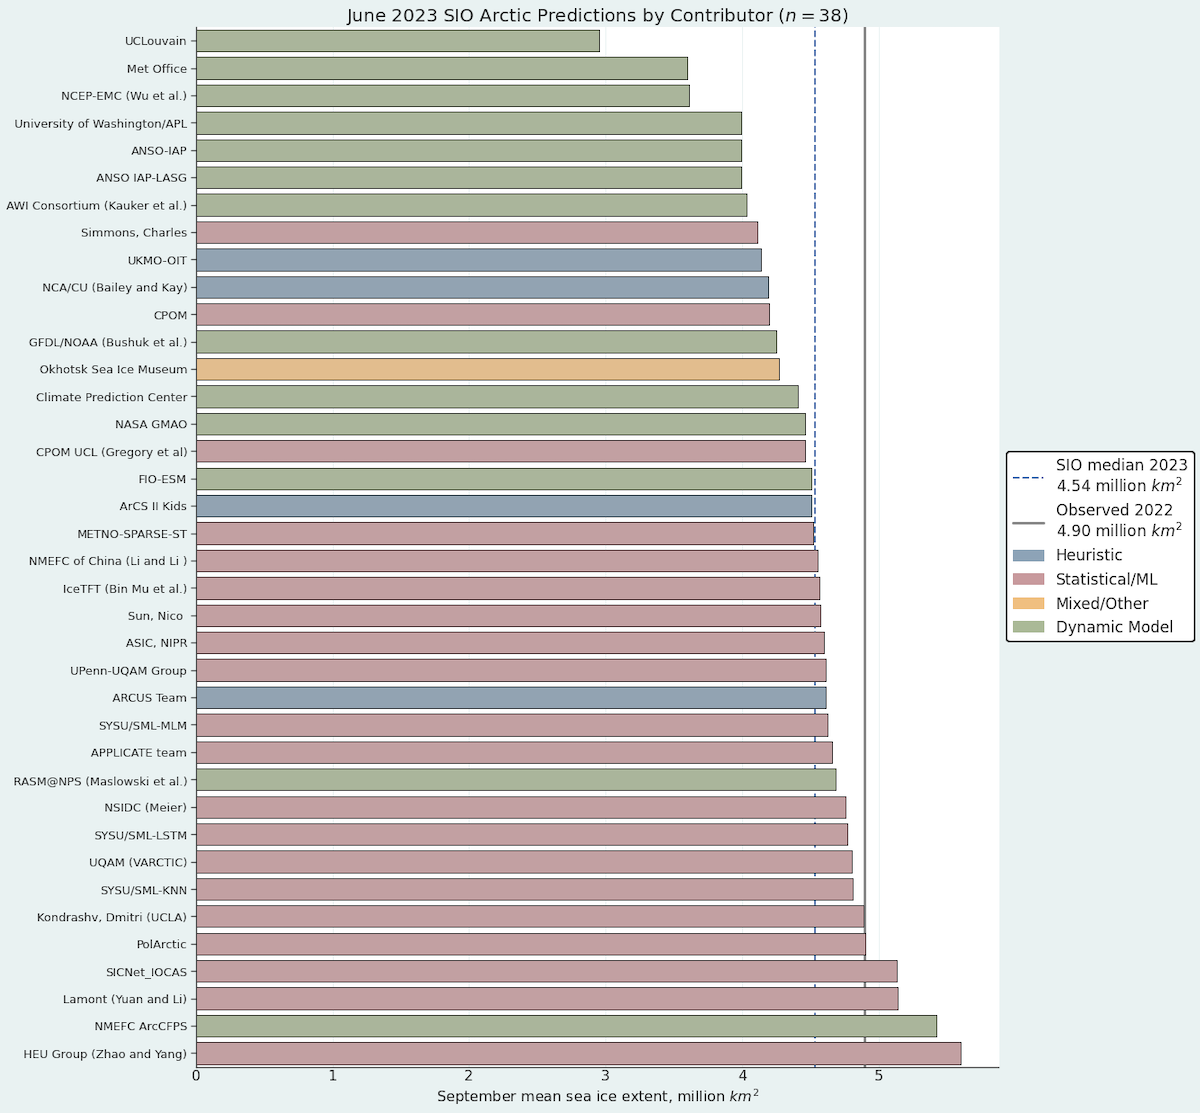
This year’s median forecasted value for pan-Arctic September sea-ice extent is 4.54 million square kilometers with an interquartile ranges of 4.34 to 4.90 million square kilometers. This is nearly the same as last year’s June median forecast for September, but higher than the three previous years (2019–2021). The lowest sea-ice extent forecast is 2.95 million square kilometers, from UC Louvain, which would be a new record low for the satellite period (1979-present); the highest sea-ice extent forecast is 5.60 million square kilometers, from the HEU Group, which would be the highest September extent since 2006. Only one Outlook forecasts a new record minimum September extent, though two others (Met Office, NCEP-EMC) forecast an extent that is essentially the same as the record low September (3.57 million square kilometers).
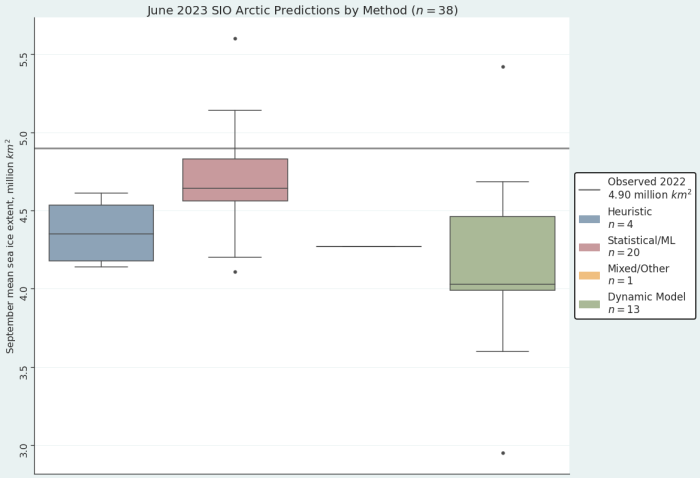
The “dynamic models” seem to be consistently predicting a lower September 2023 extent than the “statistical” methods:
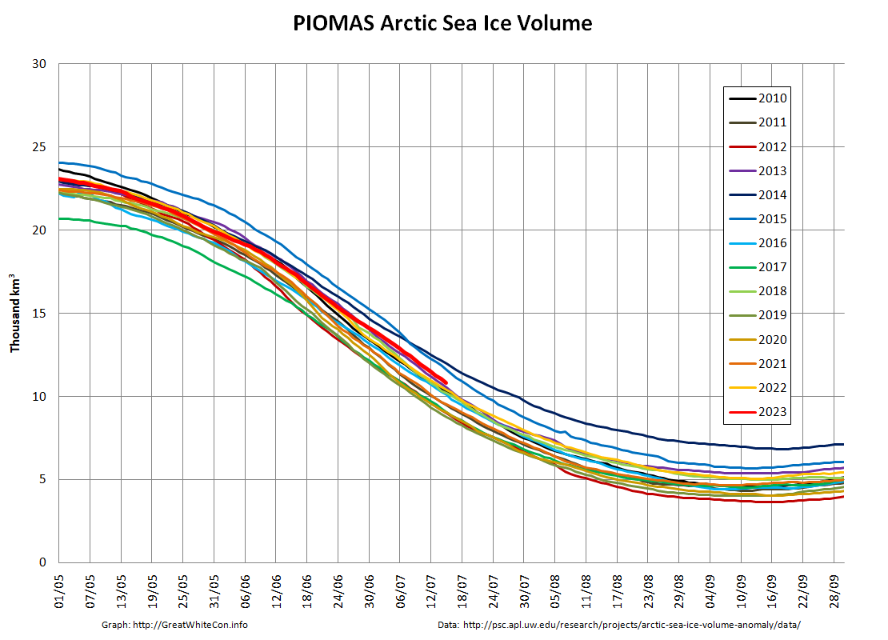
The mid month PIOMAS gridded thickness data has been released. On July 15th modelled Arctic sea ice volume was 10.84 thousand km³, 12th lowest in the PIOMAS record:
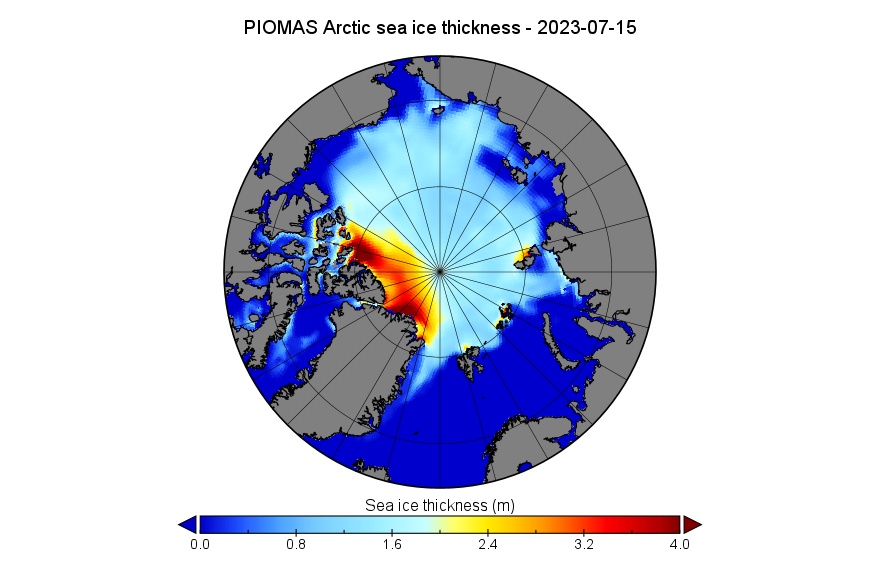
Here too is the modelled Arctic sea ice thickness map for July 15th:
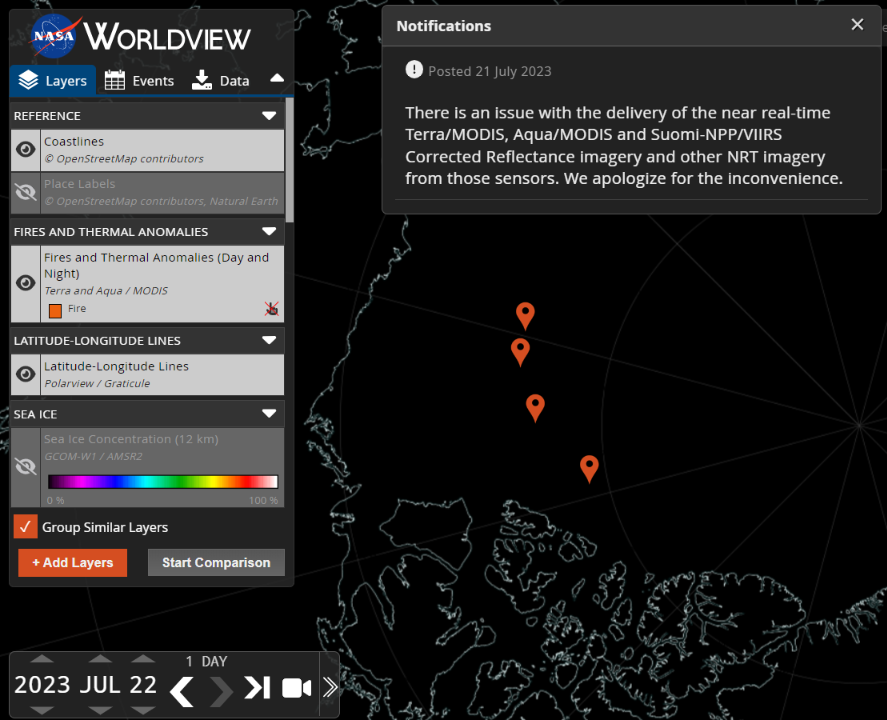
There are also some ice mass balance buoys measuring sea ice thickness. Here’s a glimpse through the clouds of their current positions:
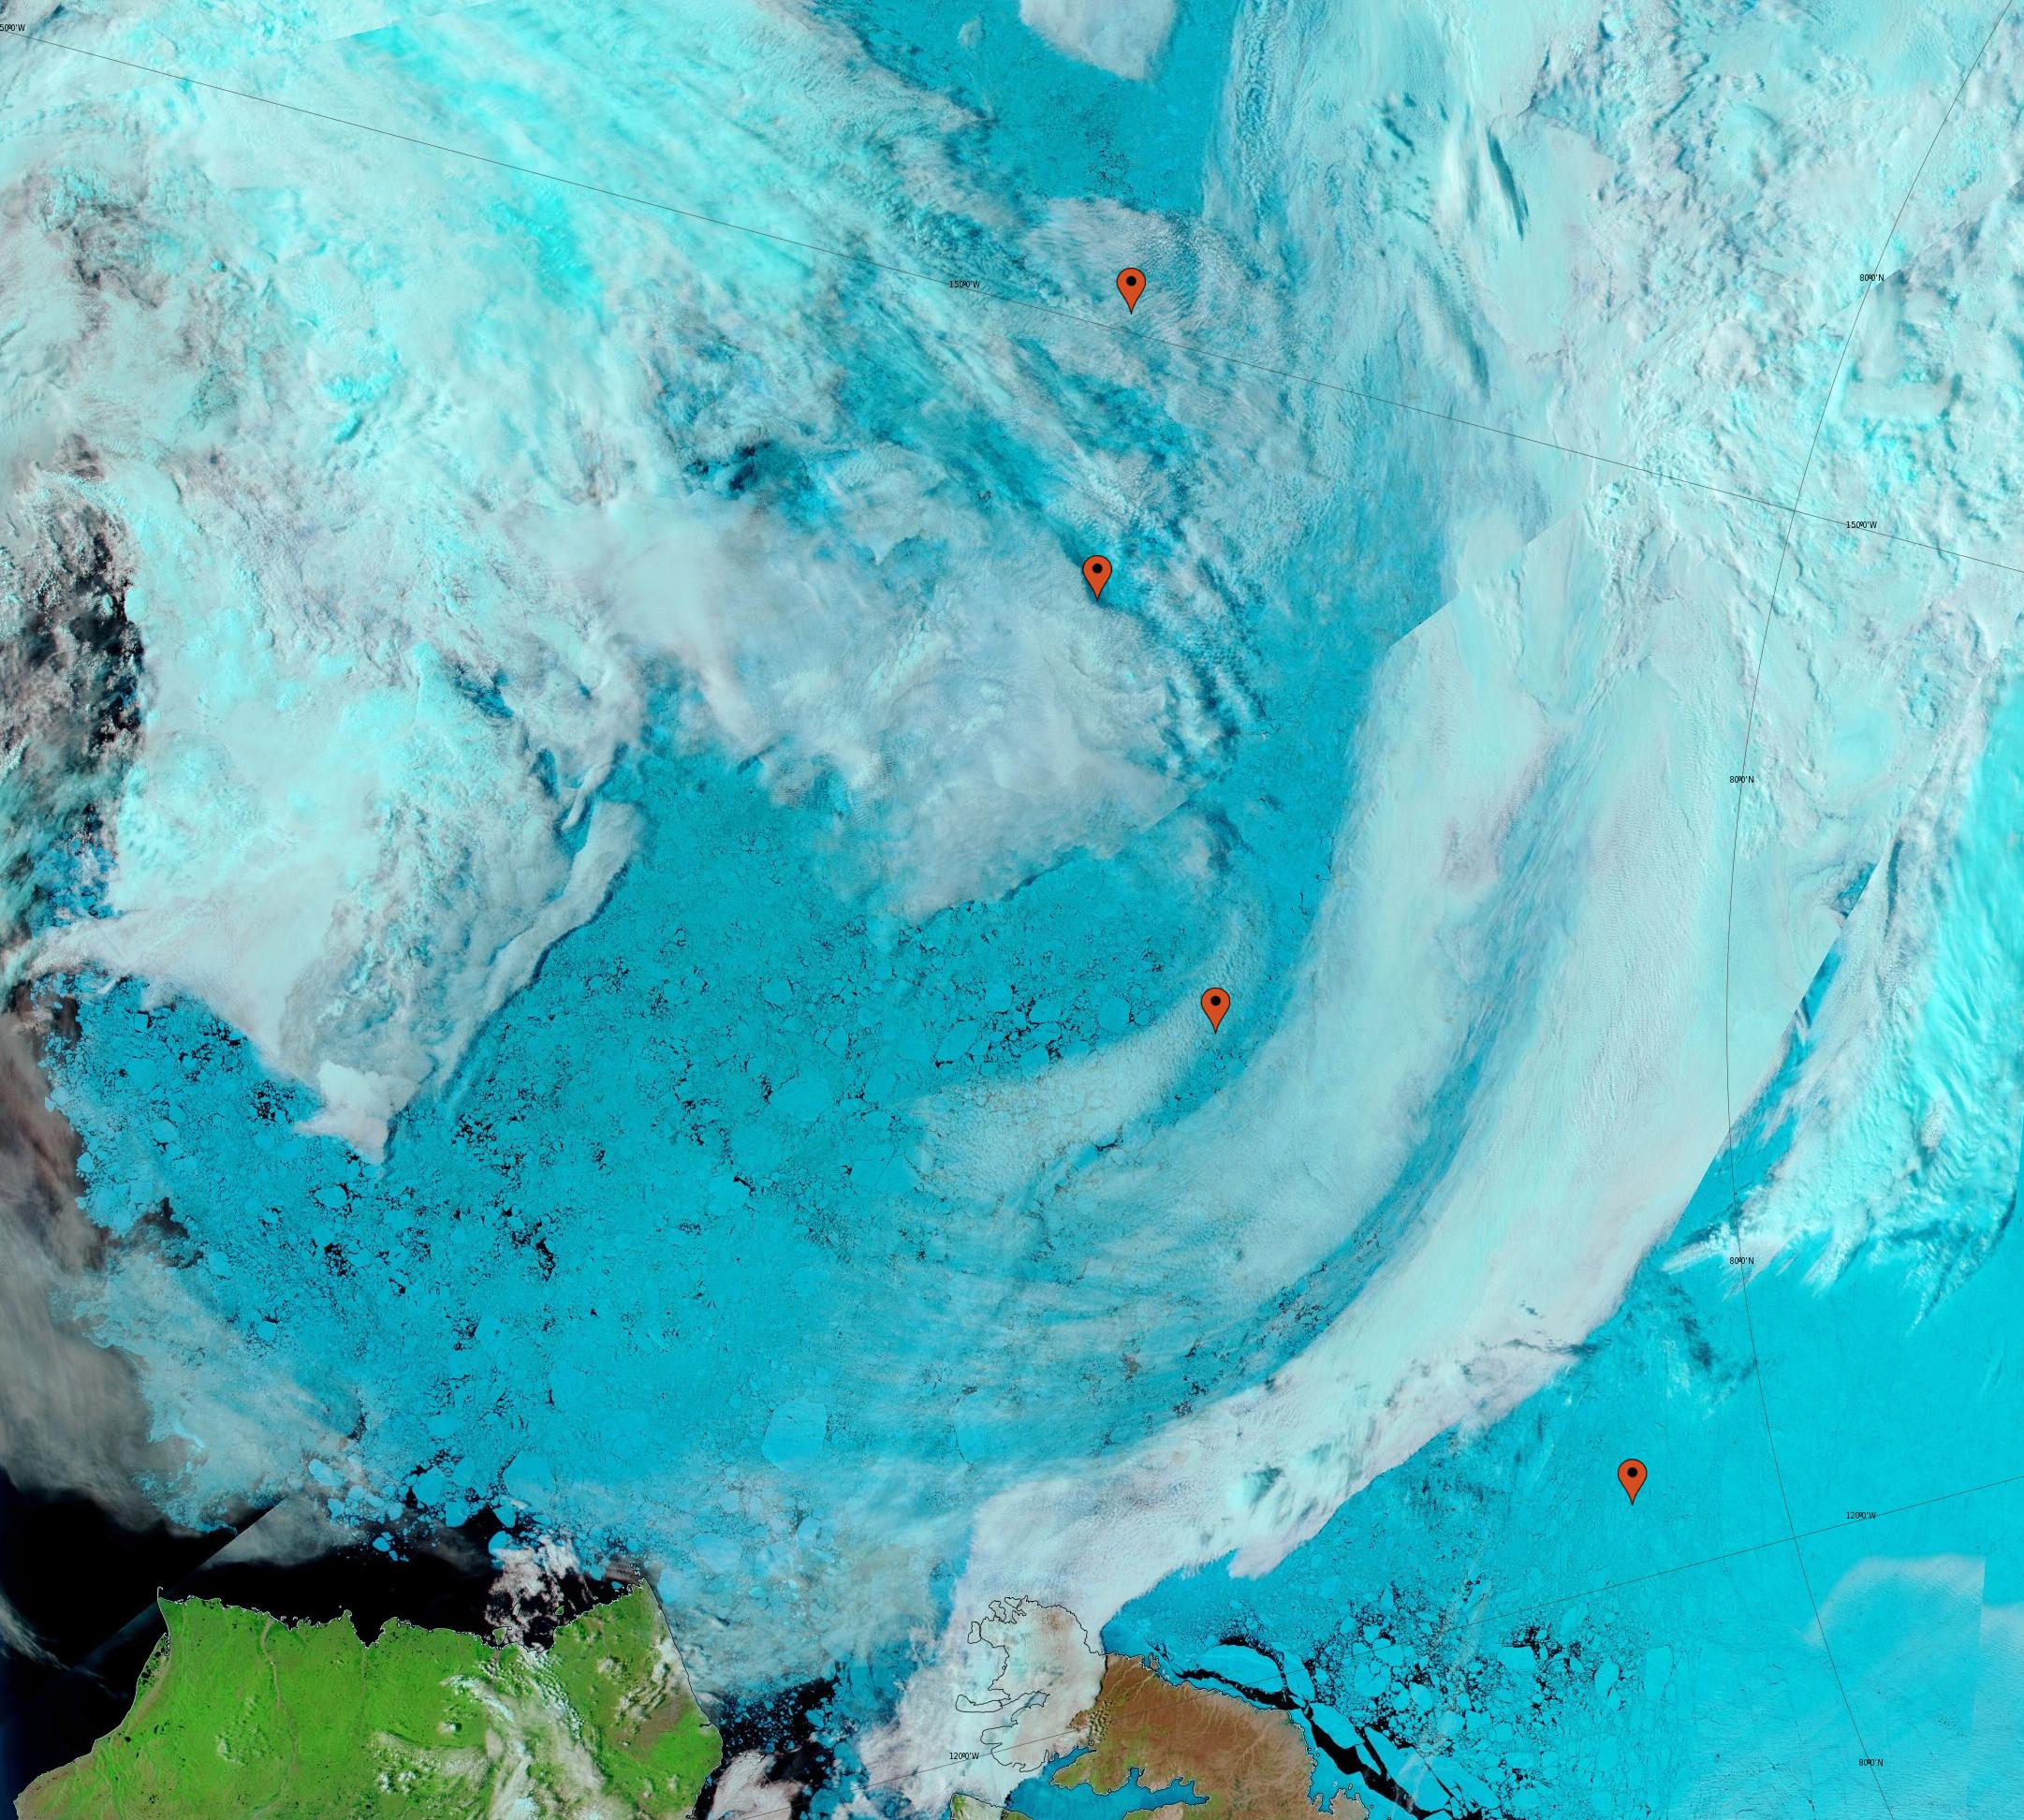
IMB buoy 651330 is located at 76.5 N, 150.4 W, the top most pushpin It still seems to be functioning normally:
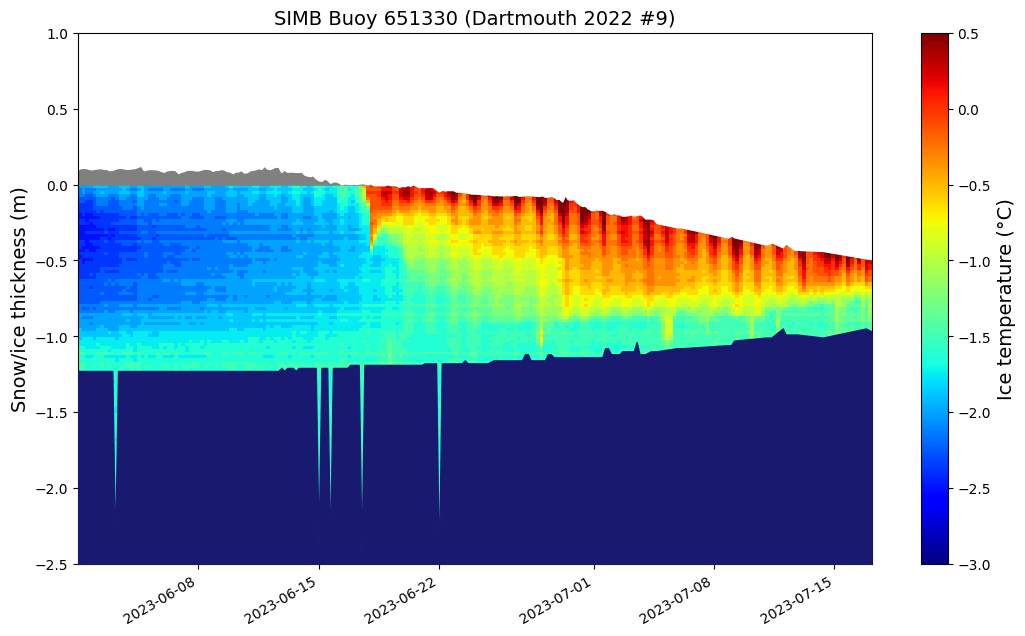
Both top and bottom melt are well under way, and the current floe thickness is 46 cm.
Second from the top is buoy 560560, at 76.7 N, 144.2 W:
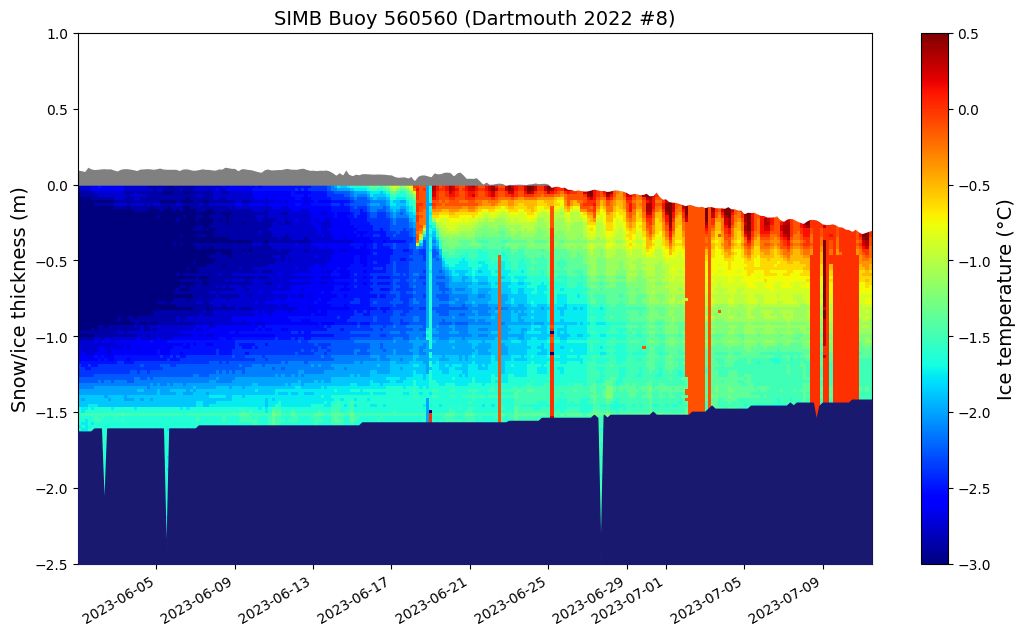
The most recent data transmission from was on July 11th, so it may well have gone to meet its metaphorical maker. The ice thickness at that time was 1.11 m.
Next is buoy 658110 at 77.4 N, 134.7 W:
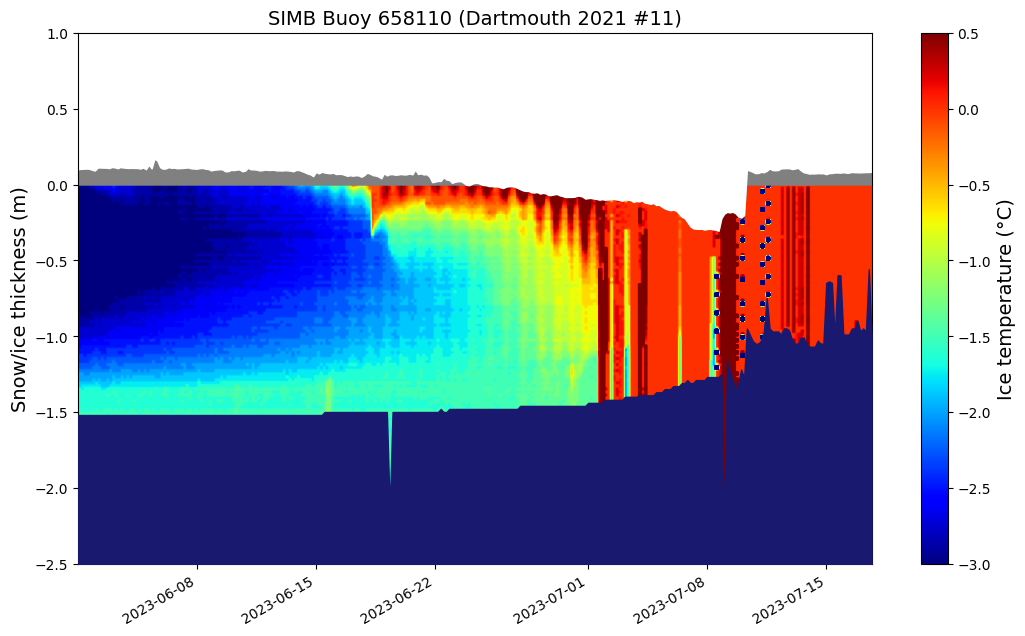
The temperature measuring string has failed and the buoy appears to be floating free, albeit still in its mounting hole.
Last (but certainly not least!) is buoy 566570 at 79.3 N, 122.0 W:
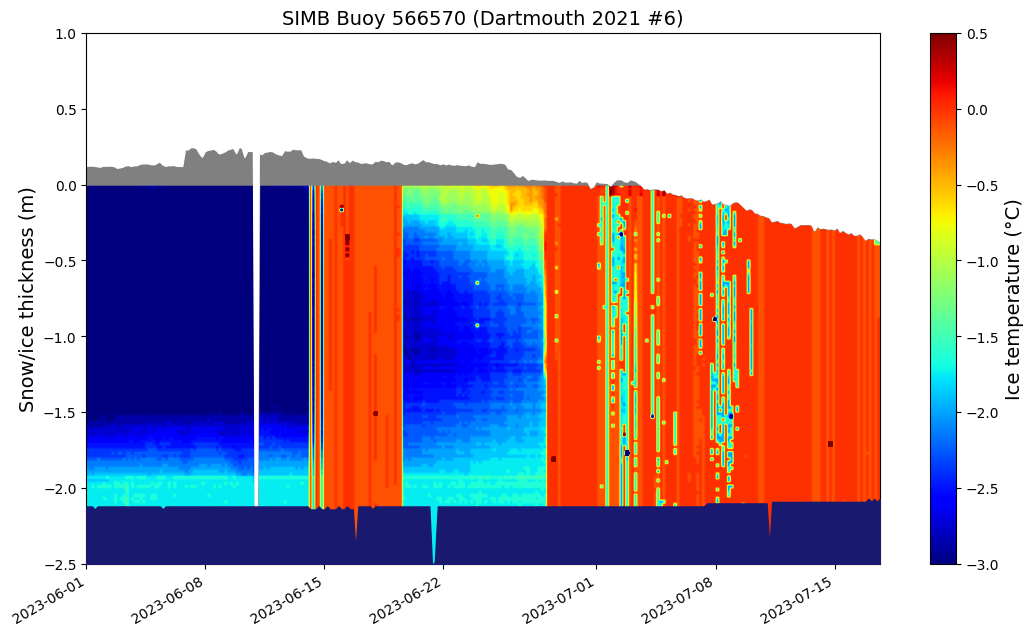
Its temperature string has also failed, but the top and bottom sounders are still working. They reveal some surface melt but very little bottom melt as yet. The current ice thickness is 1.74 m.
[Edit – July 22nd]Sadly NASA Worldview is experiencing some difficulties at the moment:
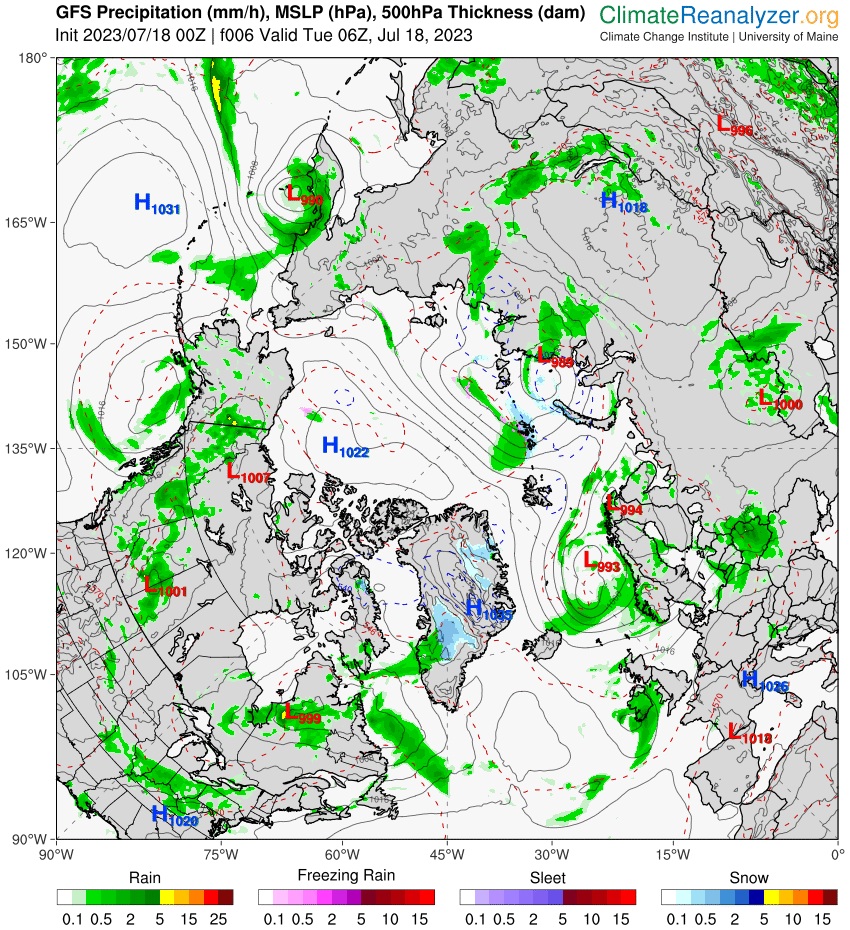
In the absence of satellite imagery, here’s the current GFS chart of mean sea level pressure across the Arctic:
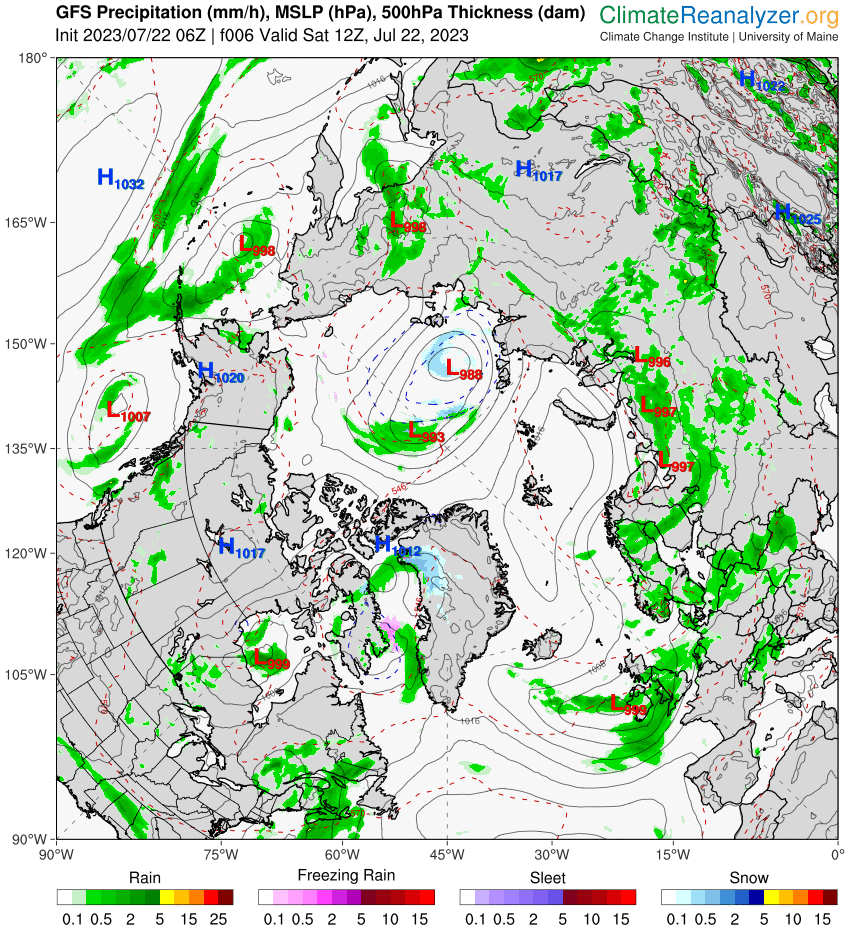
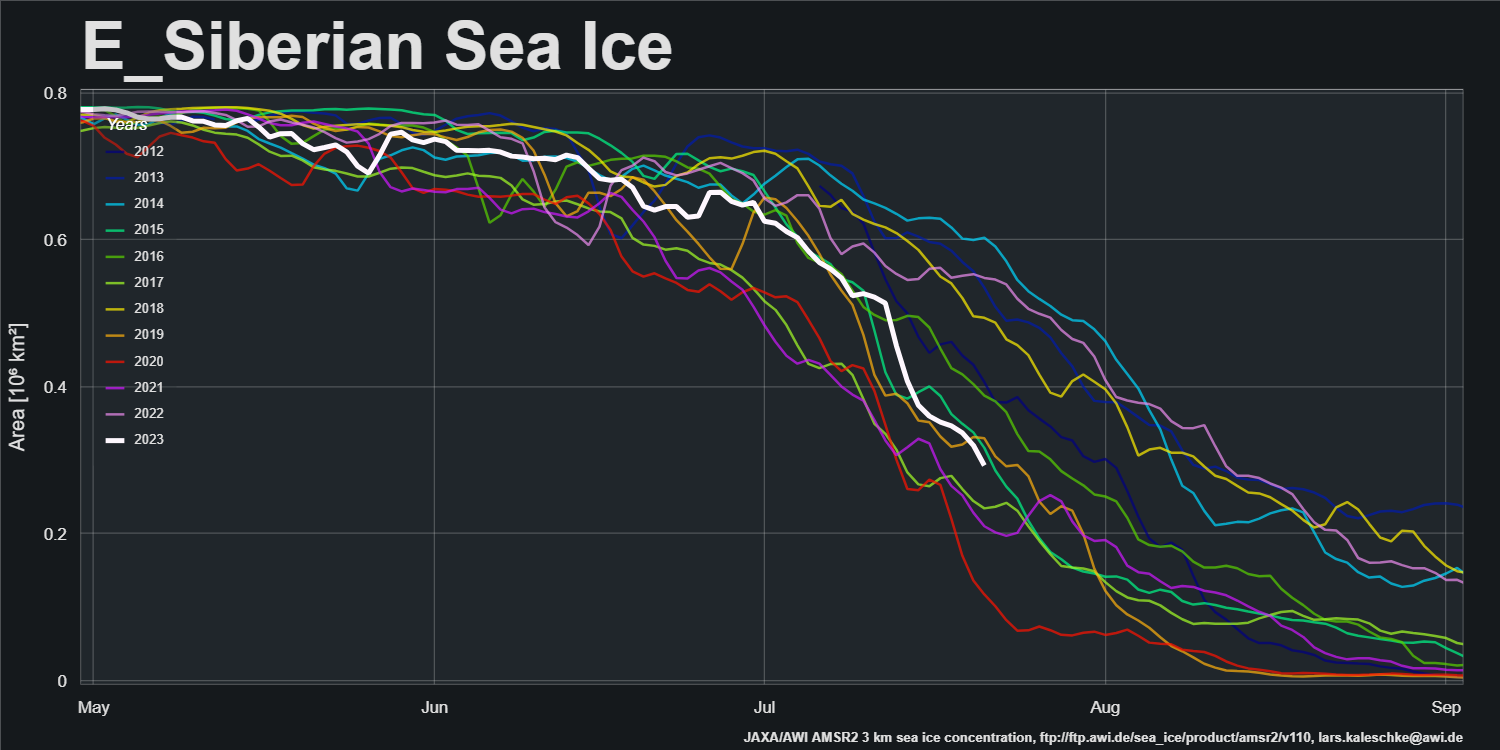
Whilst it certainly doesn’t qualify as an “atmospheric river“, the current low pressure area over the Laptev Sea is bringing rain to the North Pole. Aided and abetted by the recent persistent dipole pattern, sea ice area in the East Siberian Sea has been declining rapidly:
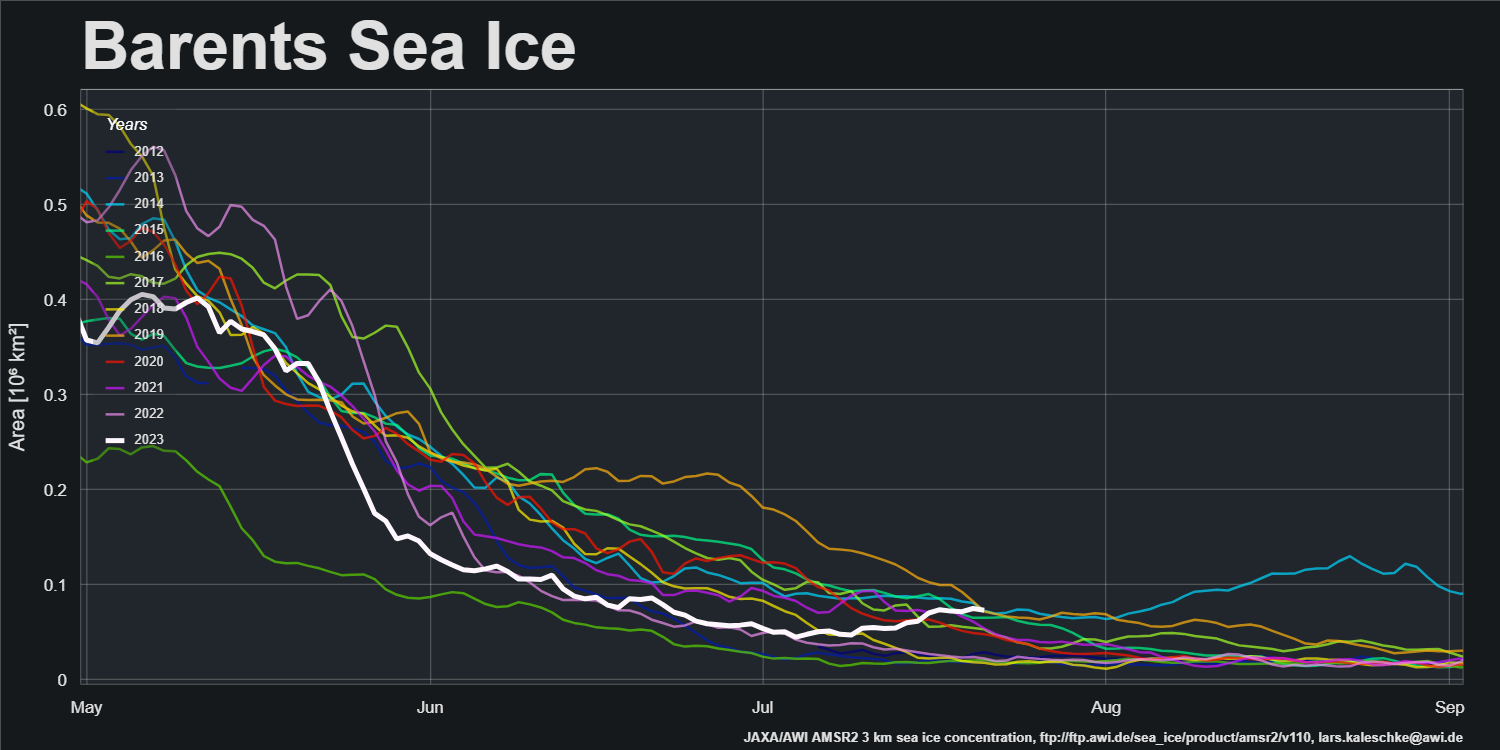
As a corollary, area in the Barents Sea is now the highest for the date in the AMSR2 record:
NASA published some more information about the Worldview outage on July 24th, which reads as follows:
Please note that all of NASA’s MODIS Adaptive Processing System (MODAPS) processing is currently on hold, due to a system wide backend issue that has affected all operations, starting early Friday, July 21, 2023. The MODAPS systems team is working on resolving this issue. At this point, an estimated timeline to resume all standard forward processing for MODIS and VIIRS data products is not available. A delay in forward processing is expected. Once operations are restored, processing will resume gradually. An update will be posted once processing has been fully restored.
This processing issue impacts the following data products:
Terra, Aqua, and Combined Terra+Aqua MODIS Version 6.1
Suomi National Polar-orbiting Partnership (Suomi NPP) VIIRS Version 1 and Version 2
LP DAAC apologizes for any inconvenience this interruption of service may have caused.
Despite that, partial data has now become available from Suomi VIIRS for July 24th, including the central CAA:
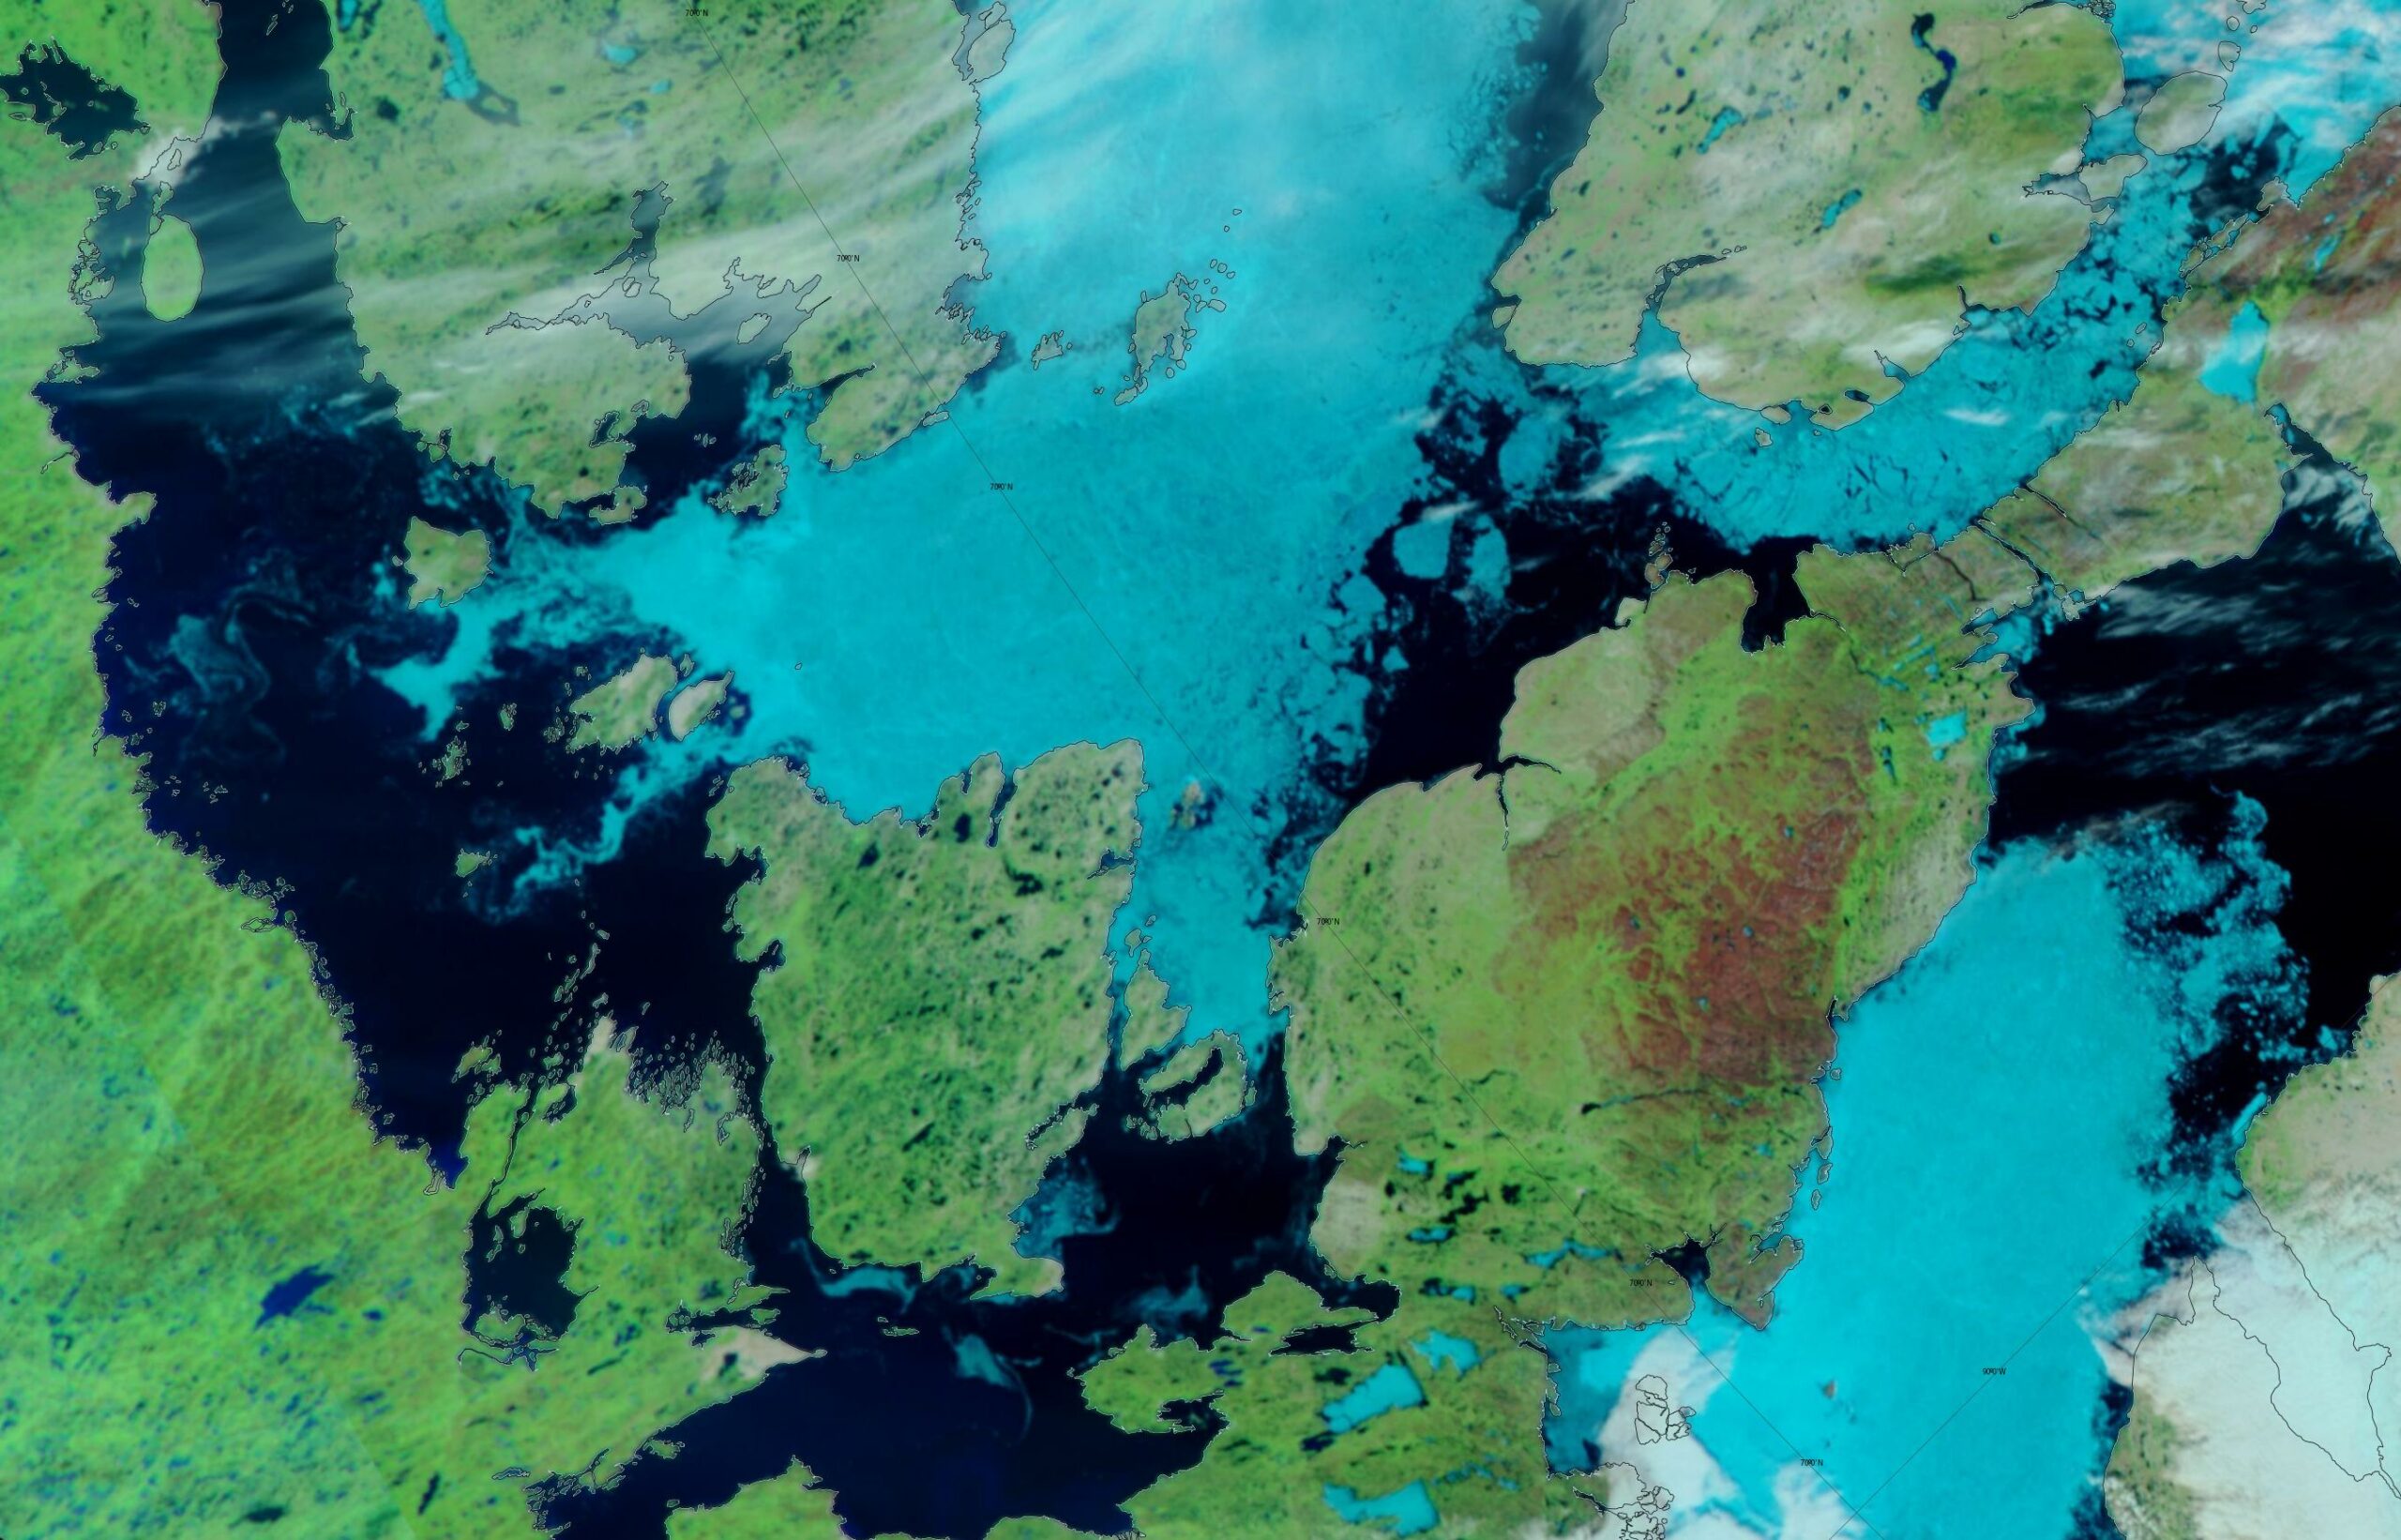
Aqua and Terra are back on Worldview! For July 26th at least. Here’s a somewhat cloudy overview of the current state of the Beaufort Sea after the recent rapid decline in sea ice area:
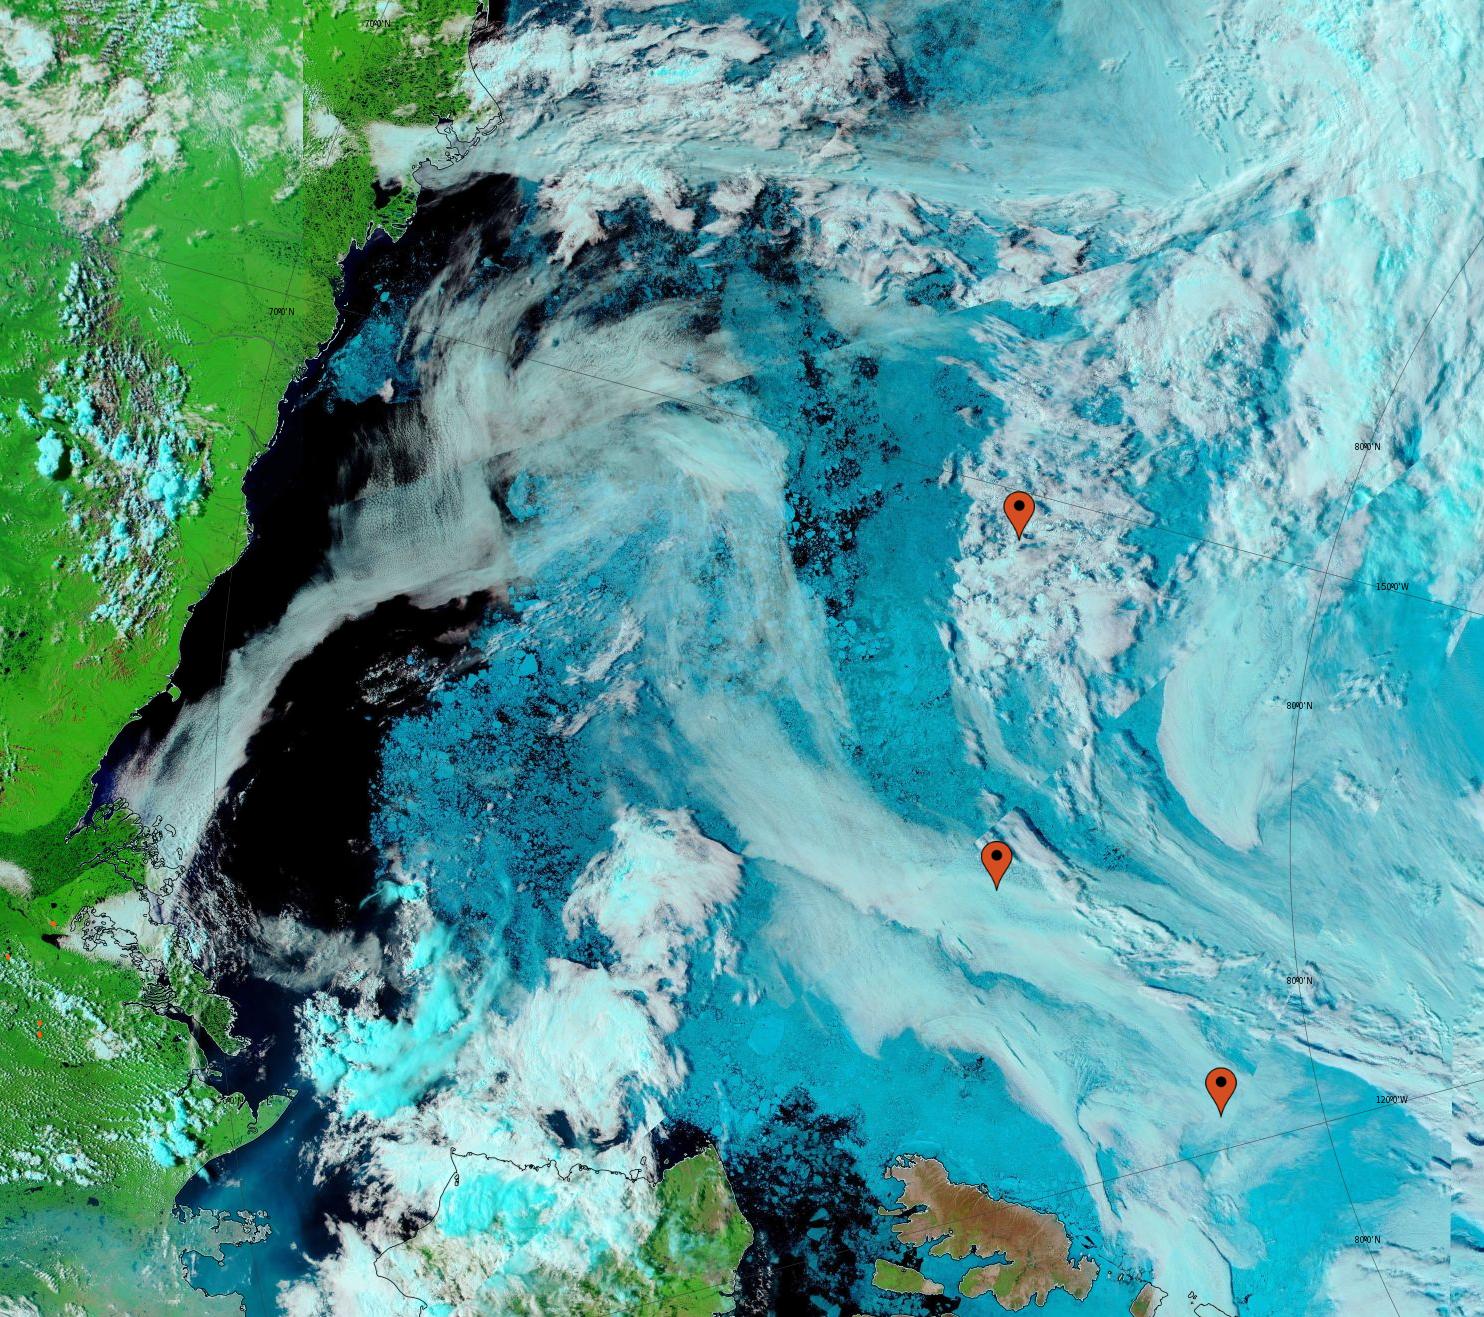
The buoy marked by a pushpin nearest to the CAA appears to have recently stopped transmitting, but I’ll leave it there for the moment in case it bursts back into life.
The conversation continues over on the August open thread.
2022
Jan.31.—-16th.lowest. +333,064 sq.km. above 2010’s average.
Feb.28.—-11th.lowest +116,764 sq.km. above 2010’s average
Mar.31.—-10th.lowest -127,470 sq.km. BELOW 2010’s average
Apr. 30.—-14th.lowest +16,886 sq.km. above 2010’s average
May. 31.—15th lowest +395,097 sq.km. above 2010’s average
Jun. 30-10th.lowest +35,744 sq.km above 2010’s average
Jul. 31.—–12th lowest +228,905 sq.km. above 2010’s average
Aug.31.—-11th.lowest +203,902 sq.km. above 2010’s average
Sep.30.—-–7th lowest +115,918 sq.km. above 2010’s average
Oct.31.– 11th lowest, +269,119 sq.km. above 2010’s average
Nov30.——5th lowest, -183,803 sq.km. BELOW 2010’s average
Dec.31—–4th.lowest,-138,700 sq.km. BELOW 2010’s average
2023
Jan.31—-2nd.lowest, -302,000 sq.km. BELOW 2010’s average
Feb.28——9th.lowest, -36,000 sq.km. BELOW 2010’s average
Mar.31—–7th.lowest, -274,000 sq.km. BELOW 2010’s average
Apr.30—–11th.lowest, +50,500 sq.km. above 2010’s average
May 31—11th.lowest, +103,000 sq.km. above 2010’s average
Jun.30–11th.lowest, +81,754 sq.km. above 2010’s average
Jul.15 —11th. lowest, +261,000 sq.km. above 2010’s average
So far, July sea ice extent is well above the 2010’s average
Sea ice area a little under 2010 average, 6th lowest for date, without going back to ASIF to look up the exact numbers.
The ice seems quite dispersed at the moment, especially at the Pacific side
Isn’t the real issue volume anyway? What about atmospheric winds blowing the ice out? Jim Massa, Ph.d. Oceanographer, “science talks” on youtube has a new vid on this.
Volume is the “real issue” in so far as it represents the actual “amount” of sea ice left.
However at this time of year sea ice area is the metric that gives the best handle on Arctic albedo, and hence how much solar energy is being absorbed by the ocean.
The rain that atmospheric rivers bring into the Arctic can also deliver a lot of energy that goes into melting sea ice. This is the article referenced in the video:
https://eos.org/articles/rivers-in-the-sky-are-hindering-winter-arctic-sea-ice-recovery
The paper by Zhang et al. is paywalled, but it was also mentioned in the NSIDC’s Arctic Sea Ice News:
http://nsidc.org/arcticseaicenews/2023/03/transition-time/
See also this atmospheric river event in March this year:
https://GreatWhiteCon.info/2022/03/facts-about-the-arctic-in-march-2022/#comment-553125
thanks for the reply Dr. Jim Hunt!
Thanks for your kind words!
However, sadly I never got around to writing my doctoral thesis so I remain a mere Mr.