Yearly Archives: 2018

HMS Trenchant Surfaces at Ice Camp Skate for ICEX 2018

In certain quarters it is being claimed in slightly strange English that:

The British Navy takes part in ICEX exercises that take place every two years and last for several weeks. Royal Navy submarine HMS Trenchant broke through the Arctic ice about seven days ago to join two US submarines for the exercise. At the same time, US submarines Hartford and Connecticut were stuck in the Arctic ice as they were training an attack on Russia. According to the legend of the exercises, the US submarines were supposed to surface and strike conditional targets in Russia, but the thick ice prevented them from fulfilling the scenario of the exercise.

However according to Her Majesty’s Royal Navy web site:

Royal Navy submarine HMS Trenchant has broken through the metre-thick ice of the Arctic Ocean to join two US boats on major exercise.

Ice Exercise 18 (ICEX) is a series of demanding trials in the frigid climate of the Arctic Circle, designed to test submariners’ skills in operating under the Arctic ice cap.

HMS Trenchant joins US submarines USS Connecticut and USS Hartford for the drills, co-ordinated by the US Navy’s Arctic Submarine Laboratory.

This combined team of military staff and scientists run the testing schedule from an ice camp established on an ice floe in the Arctic Ocean, north of Alaska.

Here is a video recording of HMS Trenchant getting “stuck in the Arctic ice”:

https://youtu.be/3EF3_plp8NQ

Here are some US Navy videos that reveal exactly how USS Connecticut and USS Hartford also became “stuck in the Arctic ice”:

According to a United States’ Department of Defense article on Ice Camp Skate:

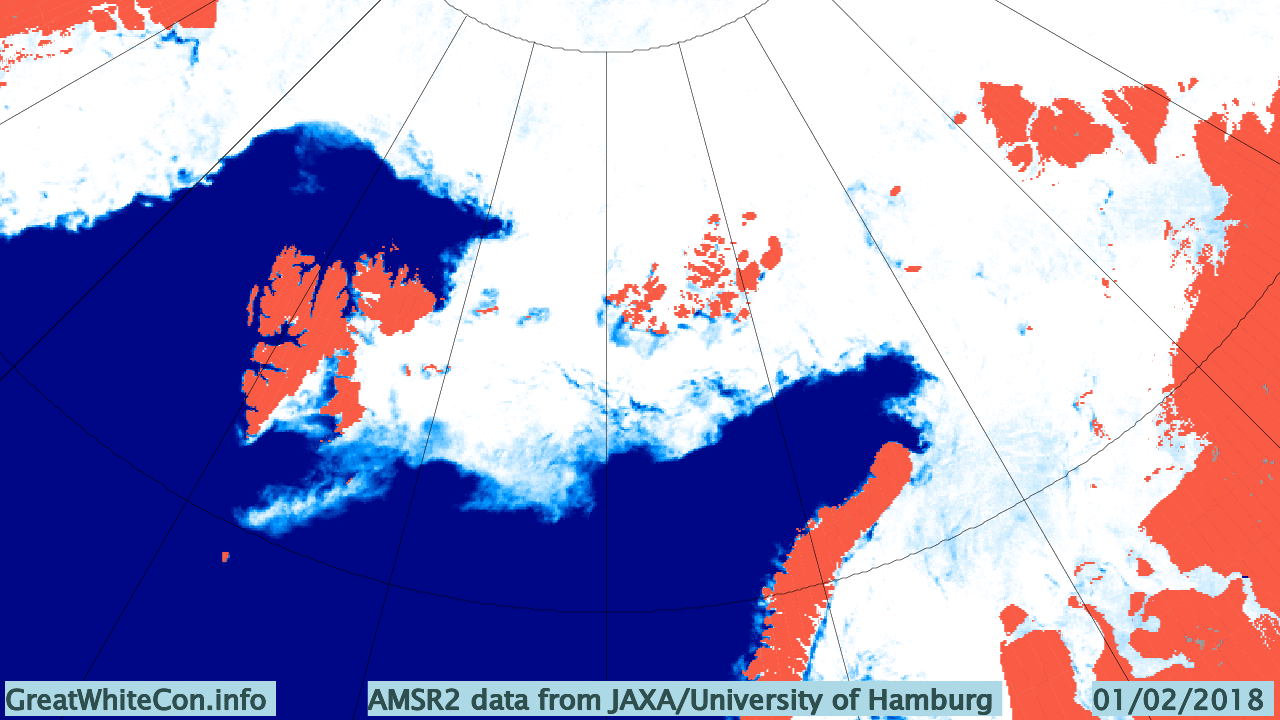
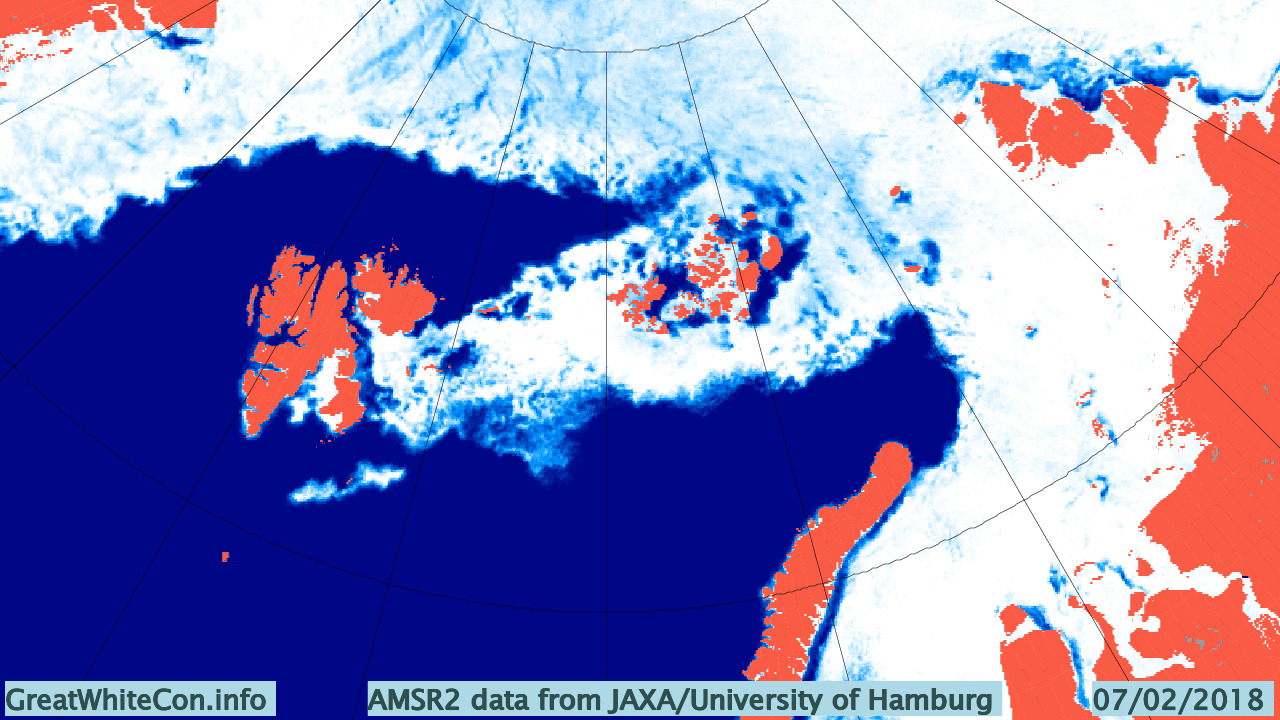
Ice Camp Skate is a temporary ice camp that was established on a sheet of ice in the Arctic Ocean, known as an ice floe. Skate will serve as a temporary command center for conducting submarine operations, including under-ice navigation and torpedo exercises. The camp consists of shelters, a command center, and infrastructure to safely house and support more than 50 personnel at any one time.

The camp gets its namesake from USS Skate, the first submarine to surface through open water surrounded by ice in 1958, and the first submarine to surface through the Arctic ice at the North Pole in March 1959. Since the success of Skate’s surfacing, Arctic operations have been a crucial part of the missions conducted by nuclear submarines.

For more than 70 years, submarines have conducted under-ice operations in the Arctic regions in support of interfleet transit, training, cooperative allied engagements and routine operations.

The U.S. submarine force has completed more than 27 Arctic exercises.


[Edit – April 10th]

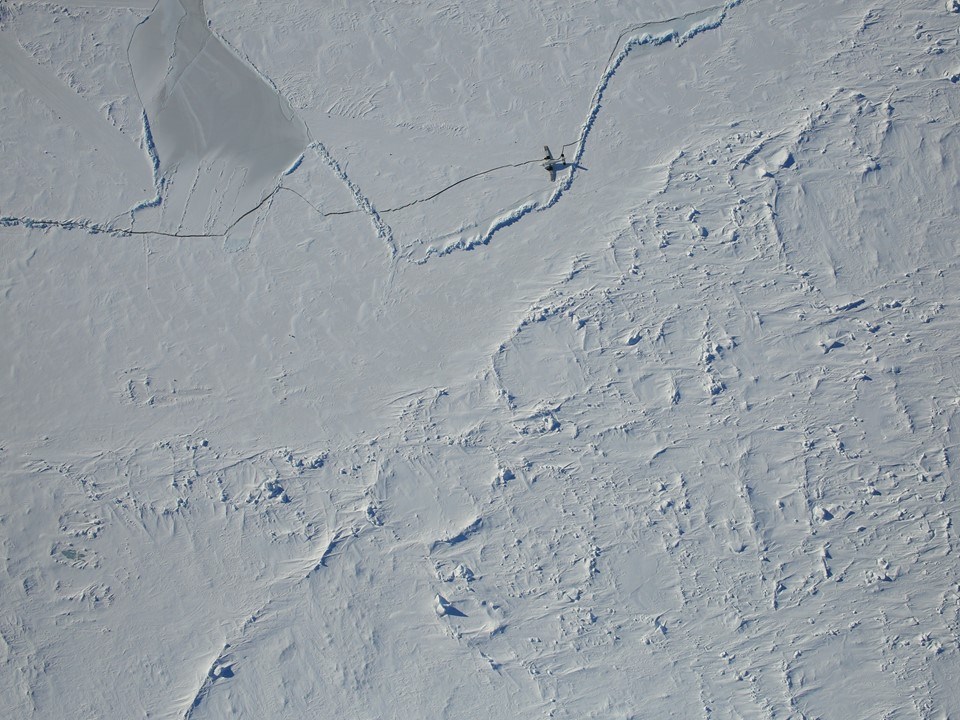
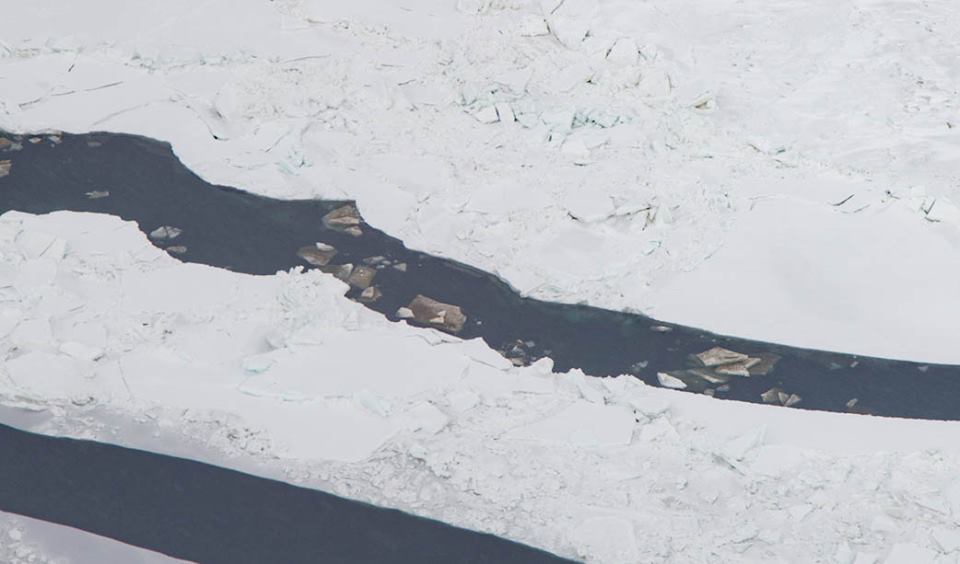
NASA’s Operation IceBridge have released some images of the now abandoned ICEX 2018 site on their Facebook page. They include a damaged and apparently abandoned Twin Otter aircraft:

IceBridge-20180408-Plane

IceBridge-20180408-ICEX

IceBridge-20180408-Lead

The 2018 Maximum Arctic Sea Ice Extent

According to the latest edition of the National Snow and Ice Data Center’s “Arctic Sea Ice News”

On March 17, 2018, Arctic sea ice likely reached its maximum extent for the year, at 14.48 million square kilometers (5.59 million square miles), the second lowest in the 39-year satellite record, falling just behind 2017. This year’s maximum extent is 1.16 million square kilometers (448,000 square miles) below the 1981 to 2010 average maximum of 15.64 million square kilometers (6.04 million square miles).

The four lowest seasonal maxima have all occurred during the last four years. The 2018 maximum is 60,000 square kilometers (23,200 square miles) above the record low maximum that occurred on March 7, 2017.

Here’s a close up view of recent maxima via the NSIDC’s Charctic interactive sea ice graph:

Charctic-20180323

Next let’s take a look at extent data from the Japanese National Institute of Polar Research, colloquially referred to as “JAXA extent”

VISHOP_Extent-20180323

In this case the maximum was 13.89 million square kilometers, also on March 17th.

Here too are the extent and area graphs based on Wipneus’ processing of the University of Hamburg’s AMSR2 based concentration data:

UH-Arctic-Extent-2018-03-23

UH-Arctic-Area-2018-03-23

They highlight the surge in Arctic sea ice area in the middle of March due to the sudden “cold snap”:

meanT_2018-03-24
Looking at the third Arctic dimension, here’s the latest SMOS thickness map from the University of Bremen:

SMOS-20180323

and here’s the latest CryoSat-2 thickness map:

CS2-thk_28-2018-03-21

They reveal large areas of relatively thin sea ice in the Okhotsk and Barents Seas where the ice can now be expected to melt as quickly as it formed. There is also remarkably little sea ice in the Bering Sea for the time of year:

UH-Bering-Extent-2018-03-23

The February 2018 Fram Strait Cyclones

As already mentioned in our February Arctic overview, another storm is brewing. Here is this morning’s weather forecast for Longyearbyen, the capital of Svalbard:

svalbard_forecast_20180204

Much like last month, temperatures are above zero and rain is forecast. That’s because once again the current synoptic chart from Environment Canada shows a warm wet flow from way down south over Svalbard and on into the Central Arctic:

Synopsis-20180204-06Z-Crop

Next here’s the current combined wave and swell height forecast for the Svalbard area:

Significant_height_of_combined_w in multi_1.glo_15mext.20180204_00037

and here’s the associated wave period forecast:

Mean_period_of_wind_waves_surfac in multi_1.glo_15mext.20180204_00037

It’s still showing 10 meter waves with a 15 second period north of Svalbard tomorrow lunchtime. Somewhat unusually for the Arctic these aren’t merely giant wind waves. Zooming in on the Fram Strait and breaking out the underlying primary swell reveals:

Significant_height_of_swell_wave in multi_1.glo_15mext.20180204_00041

Mean_period_of_swell_waves_order in multi_1.glo_15mext.20180204_00041

A long distance swell of that magnitude is going to cause some damage.


[Edit – February 5th]

The current ECMWF forecast for a split polar vortex, courtesy of Ice Shieldz on the Arctic Sea Ice Forum:

Polar View Wind Speed 10 hPa 20180204

This is suggestive of more cyclones to come, but sticking with the current one for now, here is the MSLP chart at 00:00 UTC this morning showing the cyclone’s central pressure has dropped to 952 hPa:

Synopsis-20180205-00Z-Crop

Here too is the current WaveWatch III forecast for 15:00 UTC today:

Significant_height_of_combined_w in multi_1.glo_15mext.20180205_00016

Mean_period_of_wind_waves_surfac in multi_1.glo_15mext.20180205_00016

The peak of the swell north of Svalbard is now slightly later than originally forecast, but it’s still enormous!

Here’s a single Sentinel 1B synthetic aperture radar image that captures the position of the ice edge north of Svalbard yesterday quite nicely:

S1B_Svalbard_20180204T0654


[Edit – February 7th]

A brief overview of the effect of the recent cyclone on the sea ice in the Arctic via AMSR2:

UH-Arctic-Area-2018-02-06

UH-Arctic-Extent-2018-02-06

atlantic-201802-1280

Click the image to animate it.


[Edit – February 8th]

An Arctic wide take via Thomas Lavergne on Twitter:

plus the latest AMSR2 concentration map:

Arc_20180207_res3.125_LARGE


[Edit – February 9th]

An interesting insight into CryoSat-2 sea ice thickness measurements from Stefan Hendricks on Twitter:

Plus Judah Cohen on the split polar vortex:

Facts About the Arctic in February 2018

Whilst the official PIOMAS volume figures for January have yet to be released Wipneus has worked his usual magic on the gridded thickness numbers to reveal:

PIOMAS-thkness-20180131

not to mention the calculated volume:

PIOMAS-volume-20180131

and the volume anomaly:

PIOMAS-anomaly-20180131

As Wipneus puts it:

Estimated from the thickness data, the latest value is from 31st of January: 17.57 [1000 km3], which is the second lowest value for that day, 2017 is lowest by a rather large margin at 16.16 [1000 km3].

Here are the “measured” thickness maps from SMOS:

SMOS-20180131

and CryoSat-2:

CS2-thk_28-2018-01-29

Here are the end of January Arctic wide high resolution AMSR2 graphs based on University of Hamburg data:

UH-Arctic-Area-2018-01-31

UH-Arctic-Extent-2018-01-31

In addition, since it’s that time of year, here too is Wipneus’ NSIDC global sea ice extent:

nsidc_global_extent_20180202

The minimum thus far is very slightly above last year’s value, but perhaps like last year there will be a “double dip”?

Getting back to the Arctic, here is the DMI >80N temperature plot for January:

DMI-meanT_20180201

together with the associated freezing degree days graph:

2018-02-01-DMI-FDD

Here’s a video showing the effect of the mid January cyclones on the sea ice in the Fram Strait and north of Svalbard:

Finally, for the moment at least, here is the current Fram Strait surf forecast for 12:00 UTC on February 5th:

Significant_height_of_combined_w in multi_1.glo_30mext.20180203_00021

Mean_period_of_wind_waves_surfac in multi_1.glo_30mext.20180203_00021

Those maps shows 10 meter high, 15 second period waves heading straight for the ice edge north of Svalbard.


[Edit – February 7th]

The latest edition of Arctic Sea Ice News has been published. As the NSIDC put it:

January of 2018 began and ended with satellite-era record lows in Arctic sea ice extent, resulting in a new record low for the month. Combined with low ice extent in the Antarctic, global sea ice extent is also at a record low.

monthly_ice_01_NH_v3.0

Air temperatures at the 925 hPa level (about 2,500 feet above sea level) remained unusually high over the Arctic Ocean. Nearly all of the region was at least 3 degrees Celsius (5 degrees Fahrenheit) or more above average. The largest departures from average of more than 9 degrees Celsius (16 degrees Fahrenheit) were over the Kara and Barents Seas, centered near Svalbard. On the Pacific side, air temperatures were about 5 degrees Celsius (9 degrees Fahrenheit) above average. By contrast, 925 hPa temperatures over Siberia were up to 4 degrees Celsius (7 degrees Fahrenheit) below average. The warmth over the Arctic Ocean appears to result partly from a pattern of atmospheric circulation bringing in southerly air, and partly from the release of heat into the atmosphere from open water areas.

airtemp-201801


[Edit – February 10th]

The University of Hamburg’s high resolution AMSR2 derived area is bouncing back after the recent cyclone, but extent is currently still declining:

UH-Arctic-Area-2018-02-09

UH-Arctic-Extent-2018-02-09

The recent drop in Arctic sea ice extent has pushed the NSIDC global extent to a new all time (satellite era!) low:

nsidc_global_extent_20180209

The January 2018 Fram Strait Cyclones

We’ve covered similar events in the recent past, but this one looks like it will take the proverbial biscuit.

Here’s the 6 hour wave forecast for the Fram Strait from 12:00 UTC this afternoon:

Significant_height_of_combined_w in multi_1.glo_30mext-20180113-12z+6

Mean_period_of_wind_waves_surfac in multi_1.glo_30mext-20180113-12z+6

Look at the scales carefully then compare the wave height and period with previous similar events. Here’s the cause of those giant waves, two powerful cyclones off Greenland pumping heat and moisture northwards from a long way south:

Synopsis-20180113-18Z-Crop

Also bear in mind the current sea ice area around Svalbard:

osisaf_svalbard_plot_20180112

and the current weather forecast for the capital Longyearbyen:

svalbard_forecast_20180113

Note in particular the anomalously high temperatures and the severe weather warnings for both rain and avalanches. In the middle of January.

Finally, for the moment at least, here’s a Sentinel 1B image of the sea ice in the Fram Strait earlier this morning:

S1B_Fram_20180113T063817


[Edit – January 14th]

The temperature in Longyearbyen is forecast to drop below freezing point early on Tuesday and then remain there, which I guess counts as good news?

svalbard_forecast_20180114

However the southernmost of the two cyclones off Greenland is now down to a central MSLP of 942 hPa:

Synopsis-20180114-12Z-Crop


[Edit – January 15th]

The cyclone now centred near Iceland looks as though it bottomed out at a MLSP of 939 hPa earlier today:

Synopsis-20180115-00Z-Crop

Watch this space!