A new month begins today, and at the moment it looks as though it’s going to be the most interesting one since August 2012. Here once again is the satellite image of the enormous cyclone that was spinning over the Beaufort/Chukchi Seas just a few days ago:

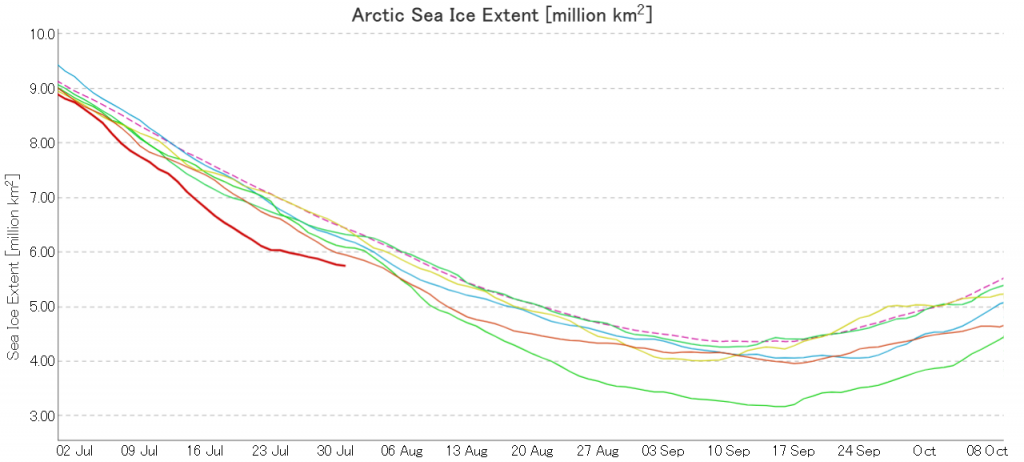
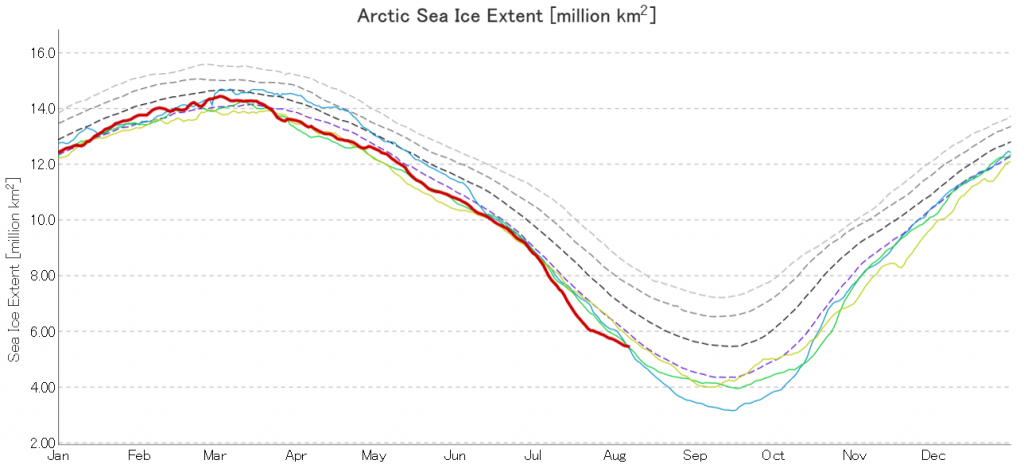
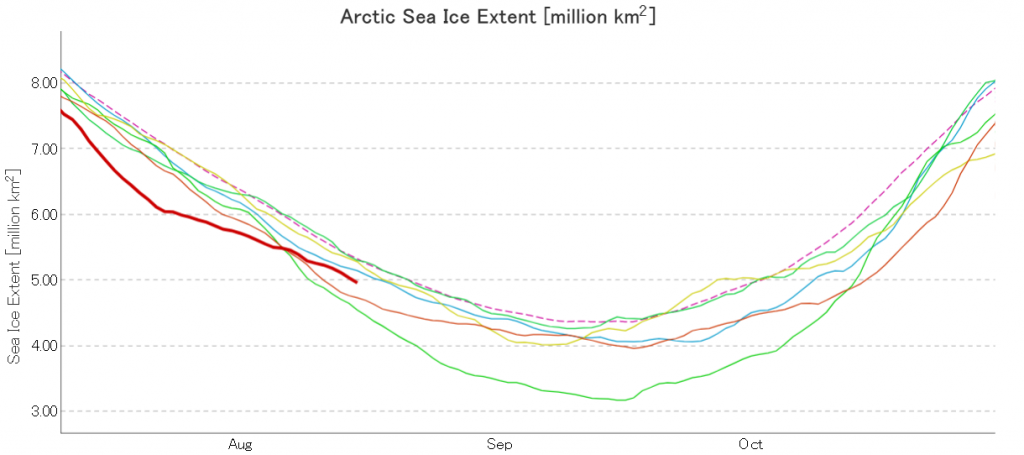
Here too is the effect of the cyclone on the trajectory of the JAXA Arctic sea ice extent graph:
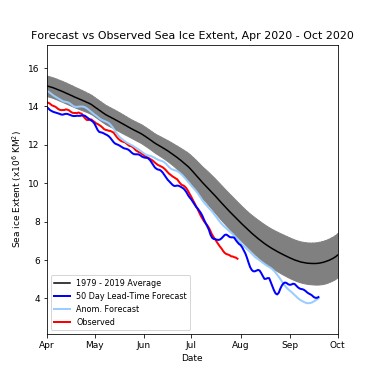
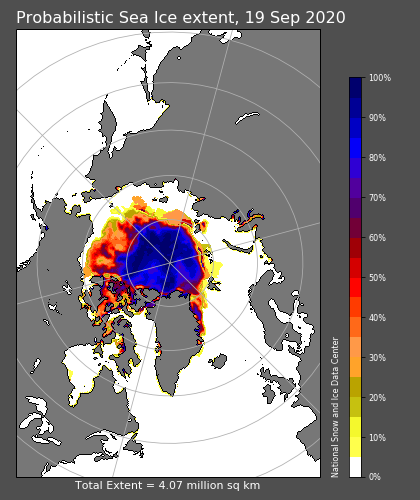
Here too is the current prognosis of the late Andrew Slater’s “Slater Probabilistic Ice Extent” 50 day forecast:
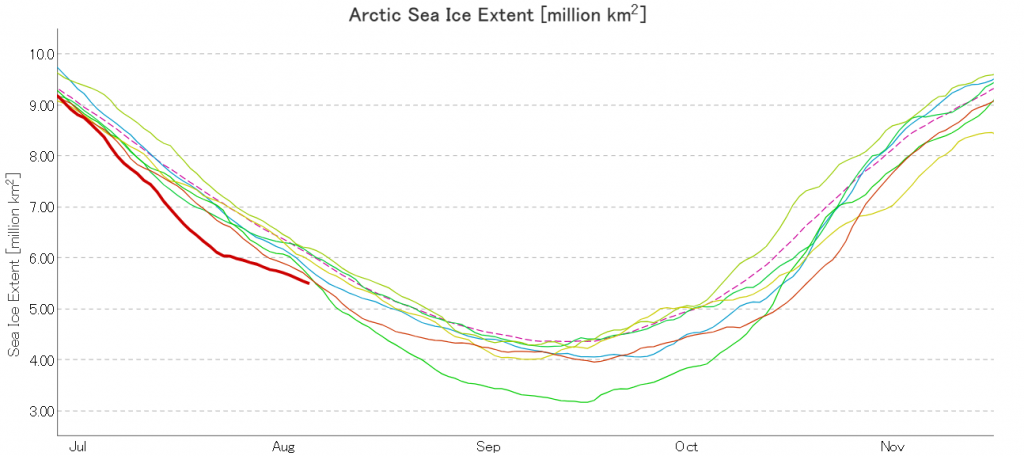
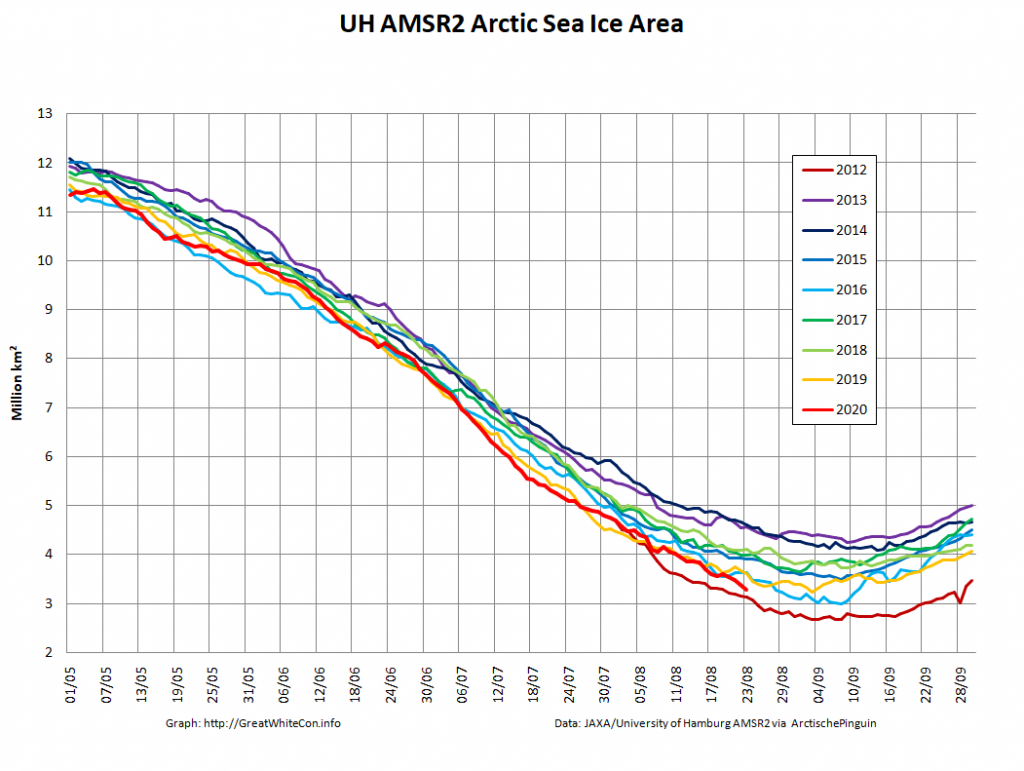
The cyclone has obviously resulted in a reduction in the rate of extent decline, but take a look at the high resolution AMSR2 “compaction” graph:
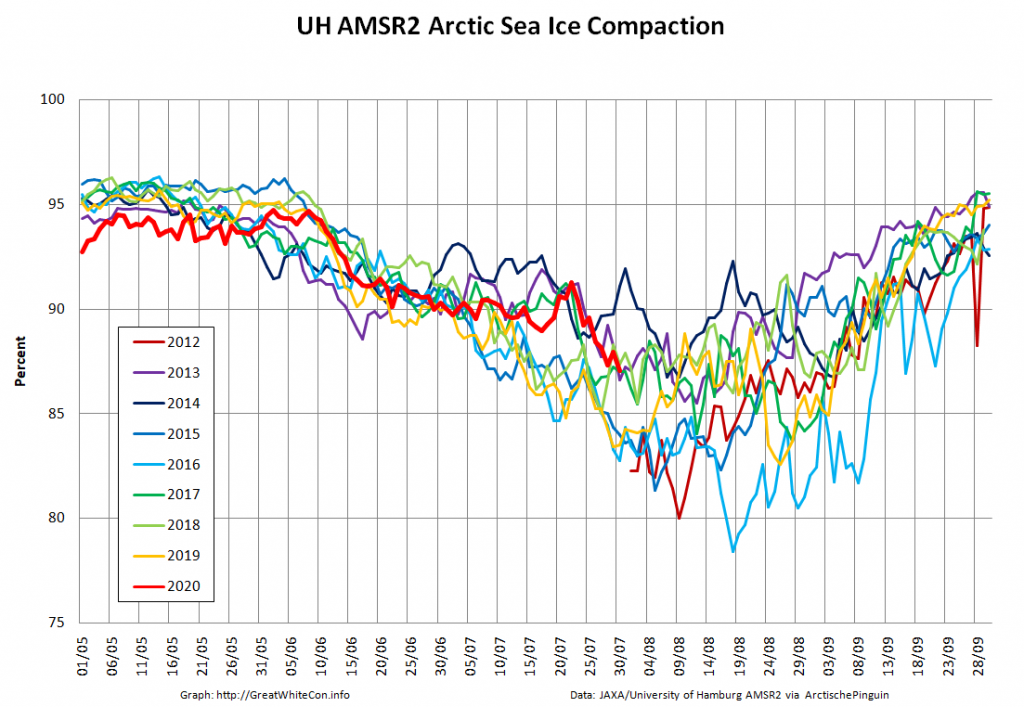
The gaps between the remaining sea ice floes have evidently increased, and hence the ice area is declining more rapidly than its extent.
Here’s an animation, based on the University of Hamburg’s AMSR2 concentration maps, which reveals the motion of the sea ice across the Beaufort and Chukchi Seas for the last two months:
Note in particular the side effects of the recent cyclone, visible at the end of the video.
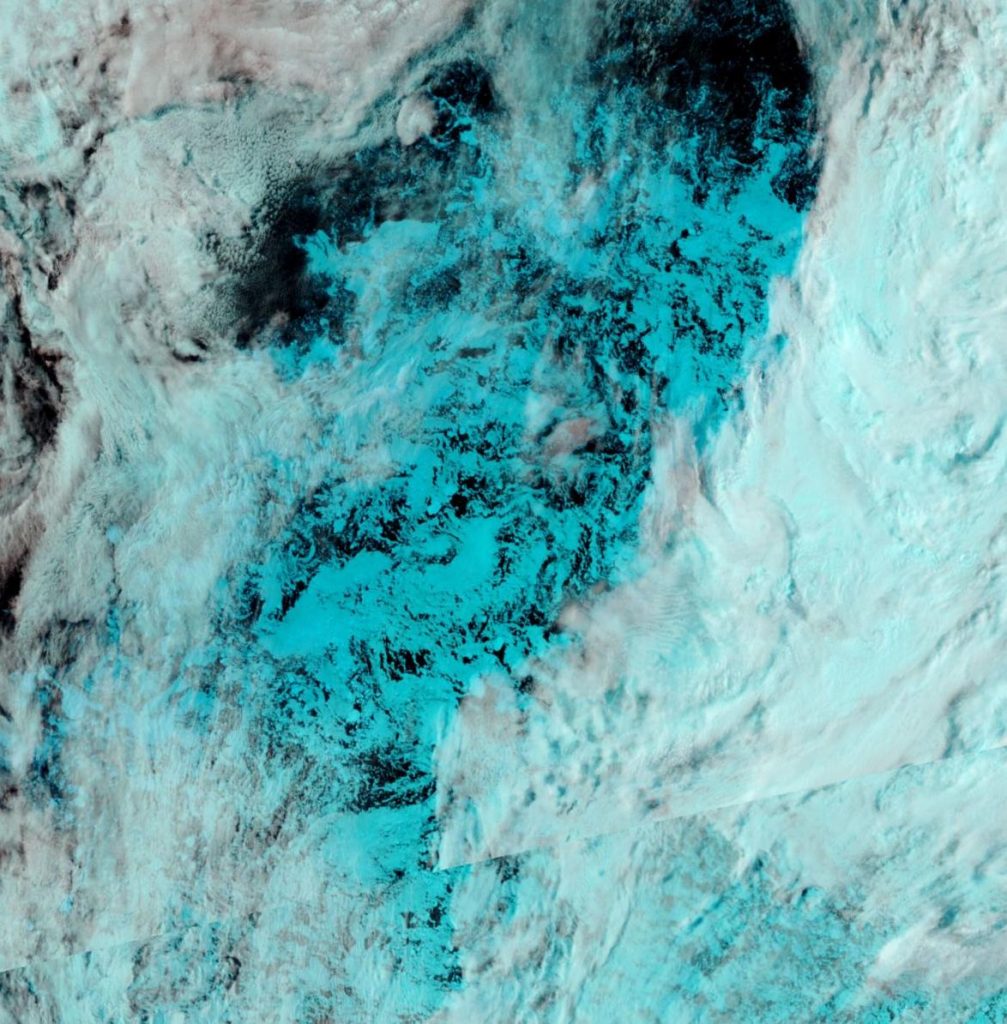
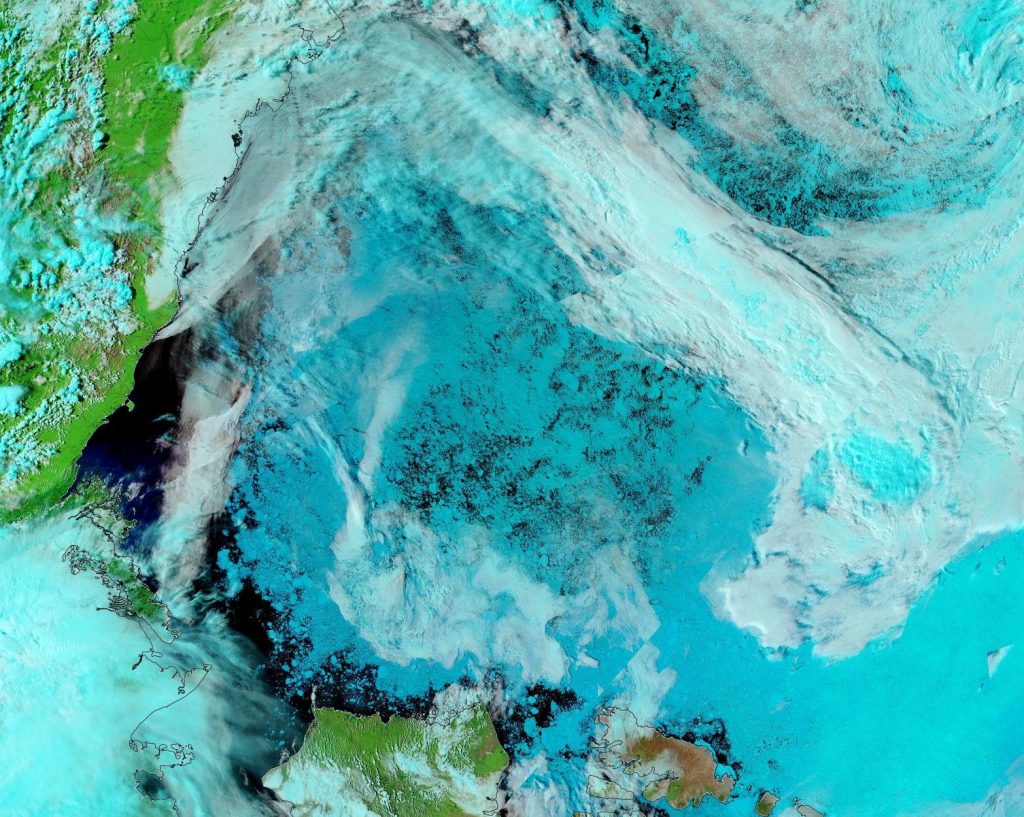
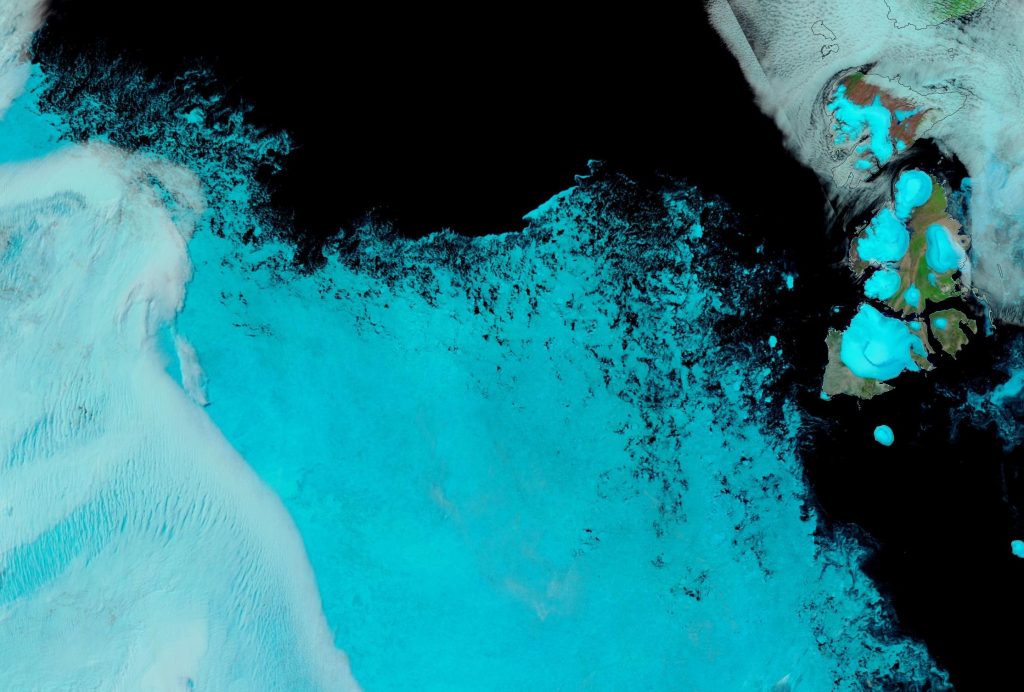
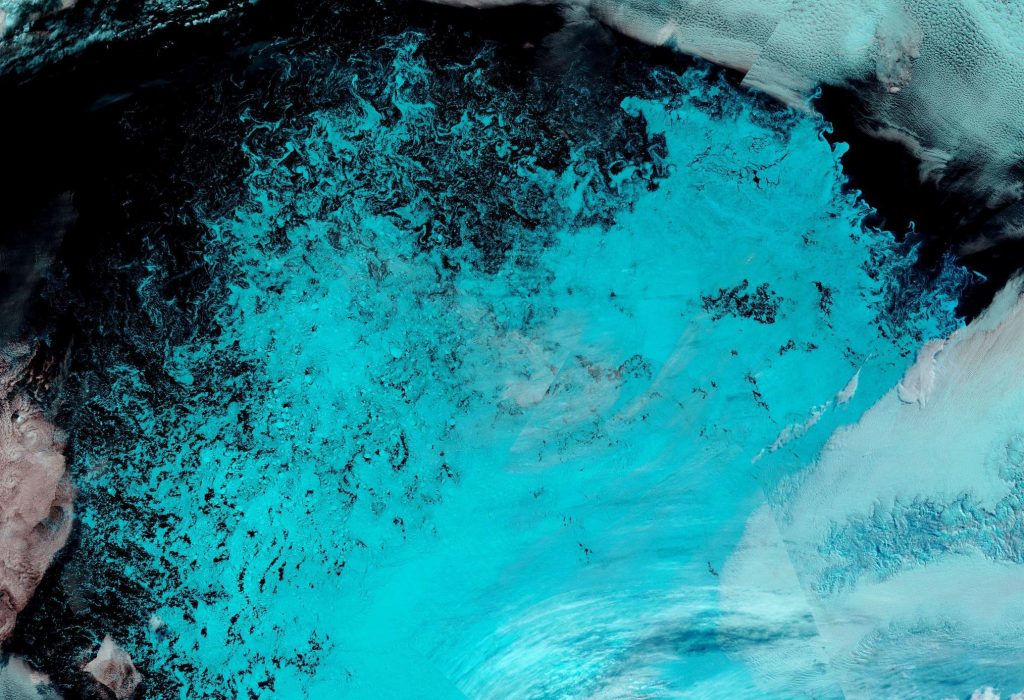
Here too is a close up of the current state of the remaining ice in the Chukchi Sea, snapped by the Suomi NPP satellite through a gap in the clouds:
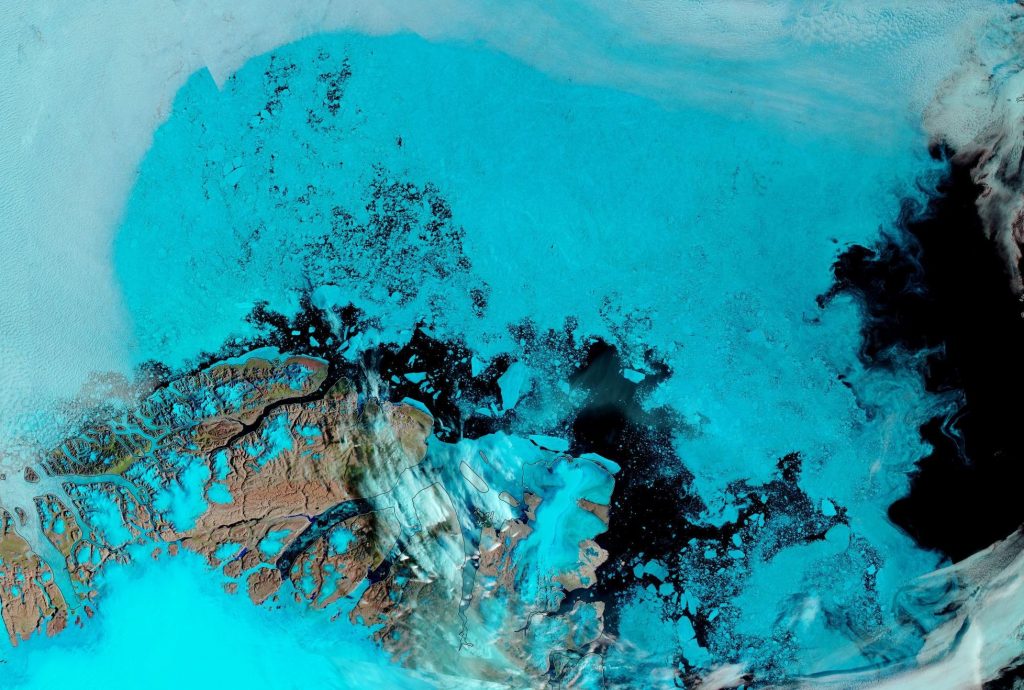
Plus the current open water north of Greenland. Perhaps once Polarstern has been flushed out into the open water of the Fram Strait at the end of the MOSAiC expedition she could take another look at this almost completely unexplored area of the Arctic Ocean?
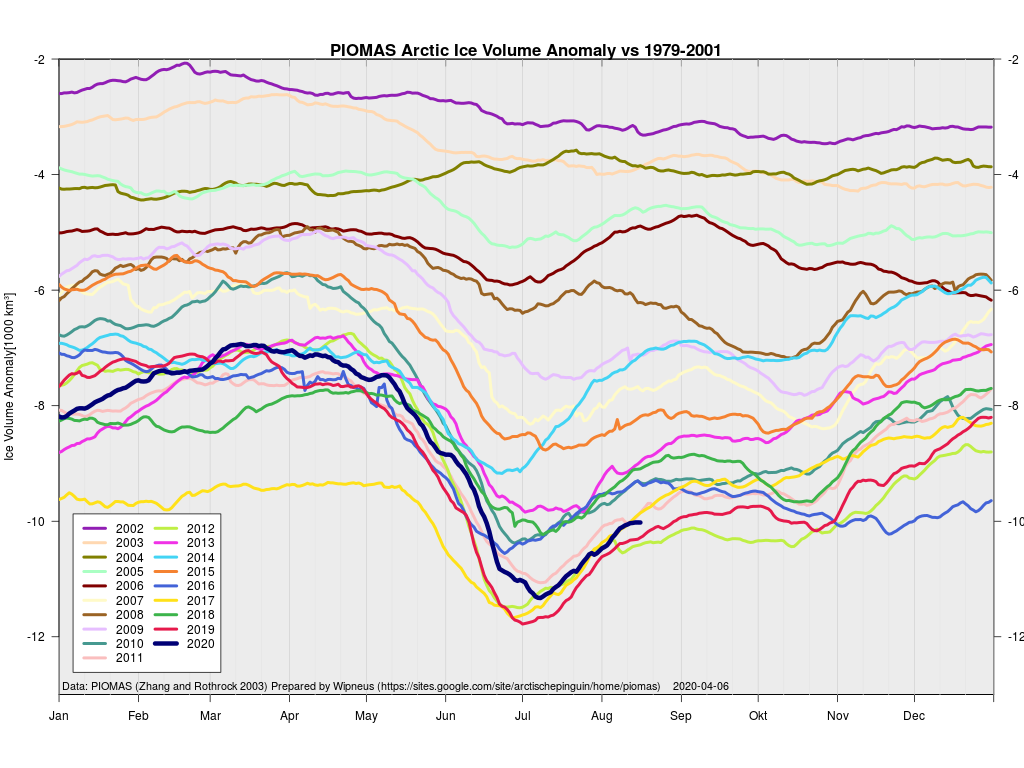
The latest gridded thickness data has been released by the PIOMAS team, and here are Wipneus’s visualisations:
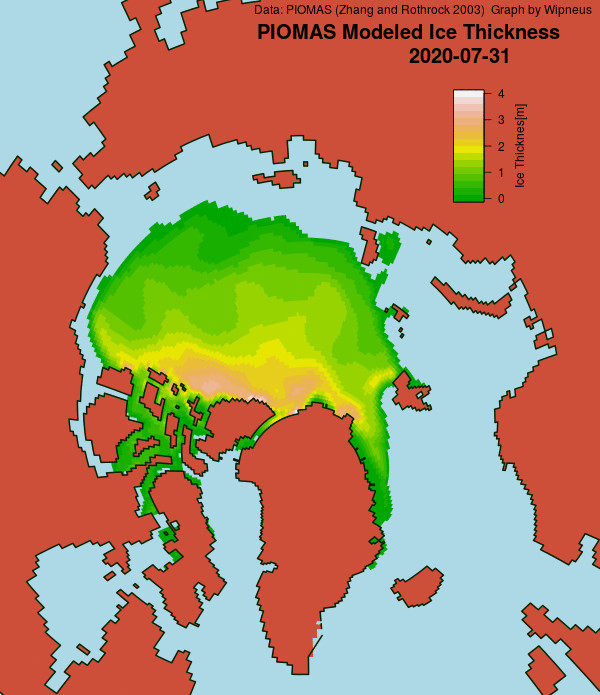

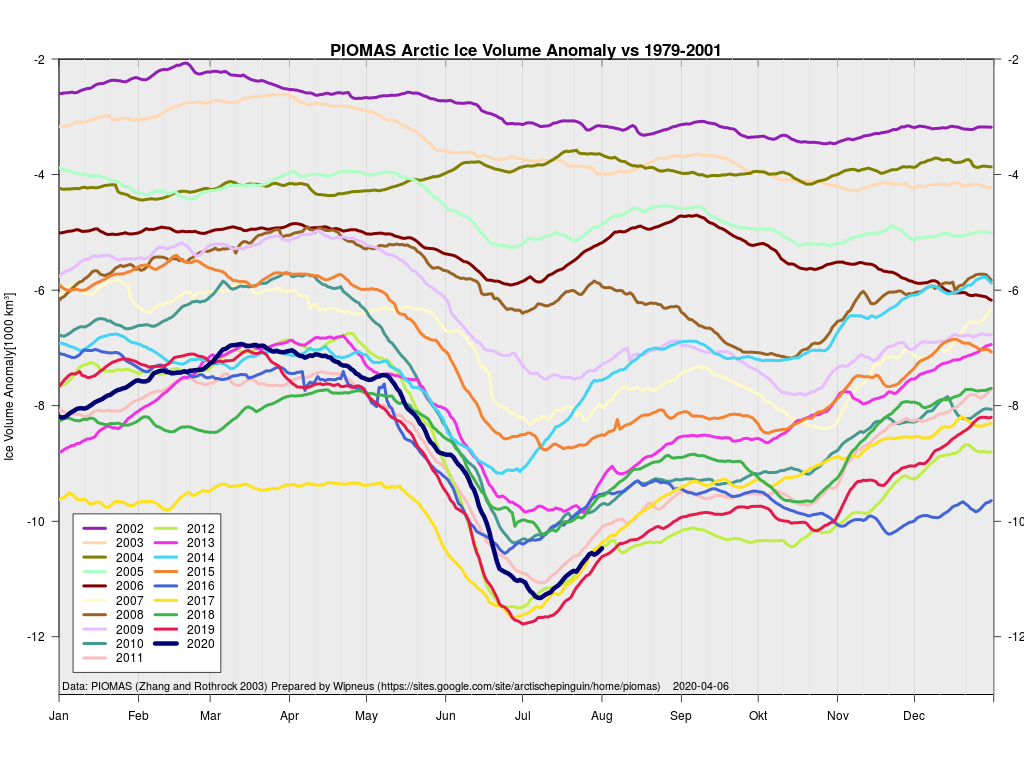
According to the Polar Science Center:
Average Arctic sea ice volume in July 2020 was 9,300 km3. This value is only 400 km3 above the record minimum value of 8,900 km3 set in 2019. This makes 2020 the fourth lowest on record for July with 2012, 2017,2019 falling just below 2020.
JAXA extent is still lowest for the date, but following the recent cyclone it looks as though it will not maintain that position for much longer:
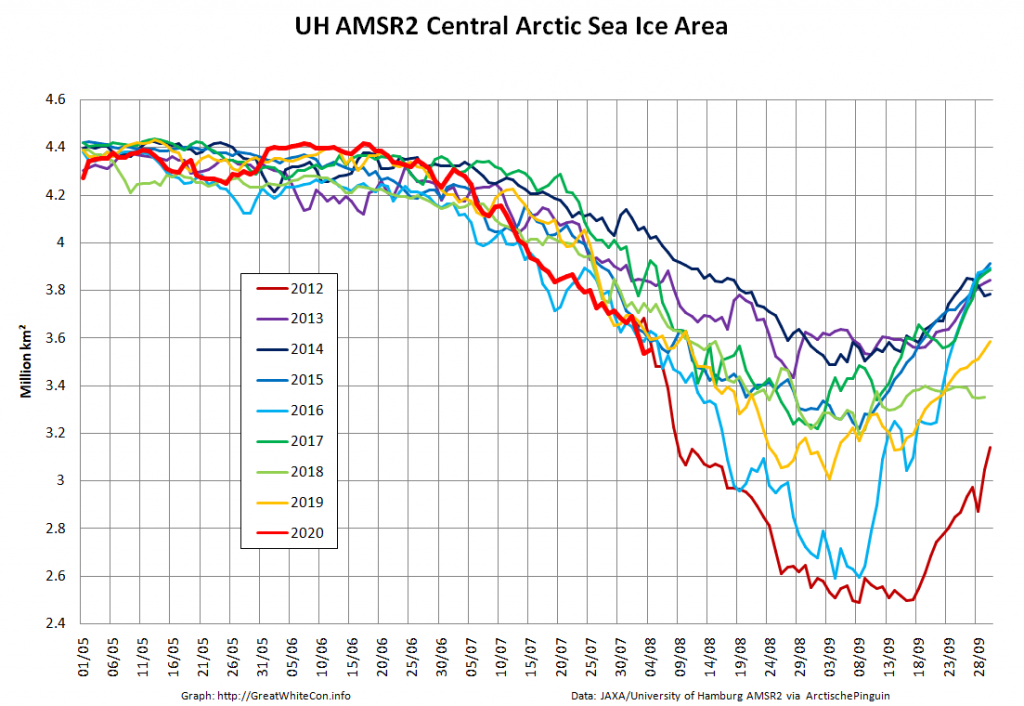
Now we’re in the month of August it’s possible to do a direct comparison with AMSR2 data for 2012. Here’s sea ice area for the Central Arctic Basin:
All of a sudden JAXA extent is in 3rd place in the race to the minimum:
However let’s also take a close look at the state of the sea ice in the Beaufort and Wandel Seas shall we?
At this juncture I reckon that come mid September second place is now more likely than first. However as always, it still all depends on the weather.
Surprising as it may seem, high resolution AMSR2 Central Arctic Basin sea ice area has so far managed to keep up with the precipitous drop in 2012:

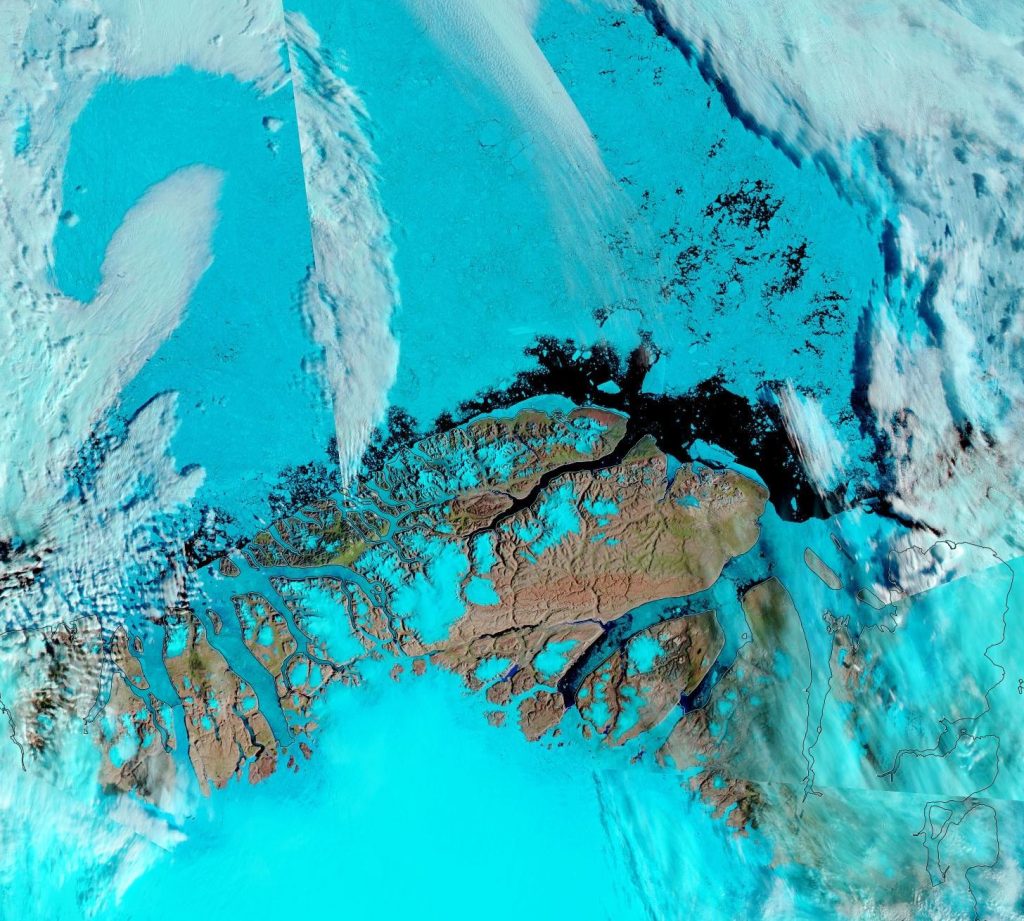
North of Greenland the clouds have cleared closer to the North Pole, to reveal this:
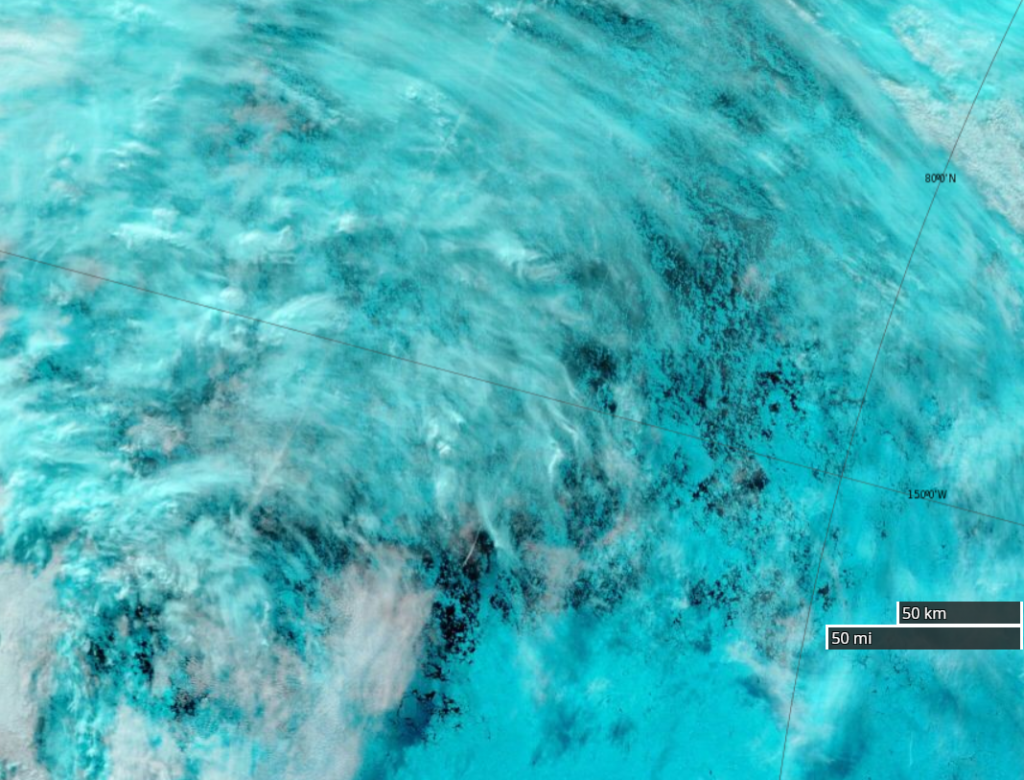
Fresh this morning from Terra, a rather cloudy view of the devastation near 80N, 150W:
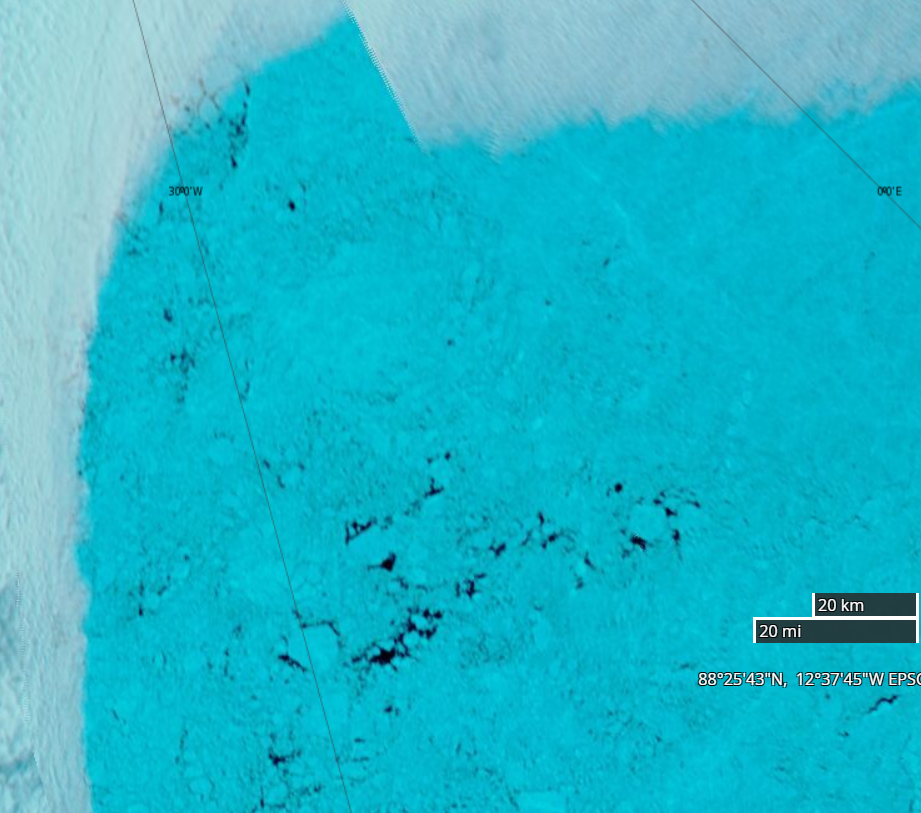
In a not entirely unexpected development one of ex Prof. Judy’s denizens is quibbling about the current condition of sea ice in the Arctic. Hence here is a close up of some “gaping holes in the sea ice cover” at 88N between Greenland and the North Pole:
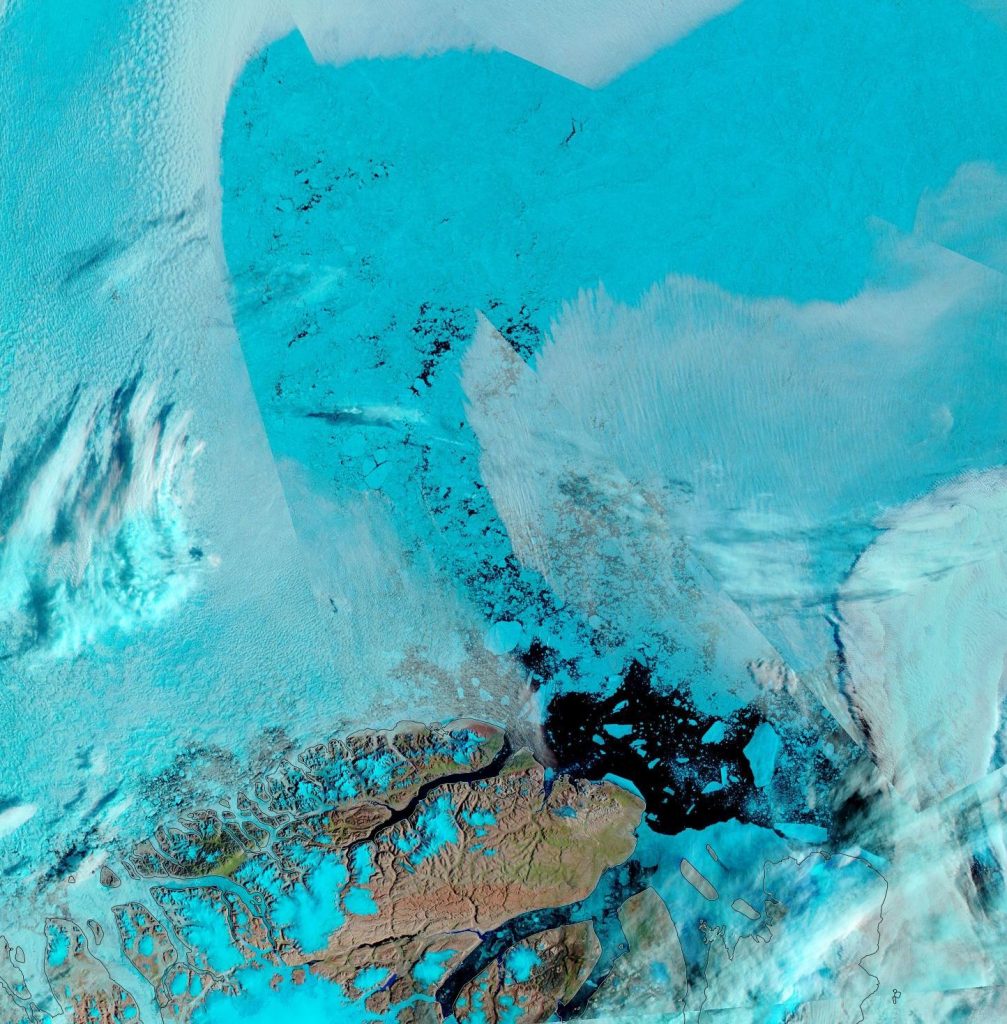
A nice clear view this morning of the marginal ice zone of the “Laptev Bite” and thereabouts from the Suomi satellite :
JAXA AMSR2 extent has fallen below 5 million km²:
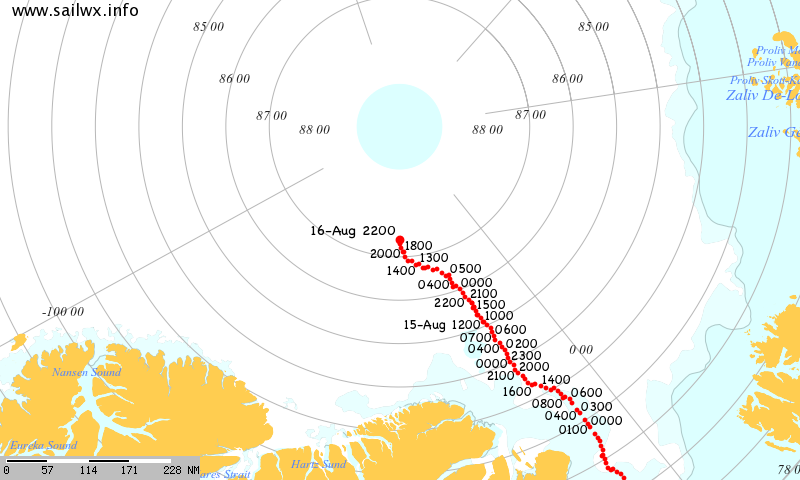
Having been flushed out of the Central Arctic through the Fram Strait the polar research vessel Polarstern is back, seemingly intent on taking a close look at the North Pole:
The mid month PIOMAS gridded thickness numbers have been published:

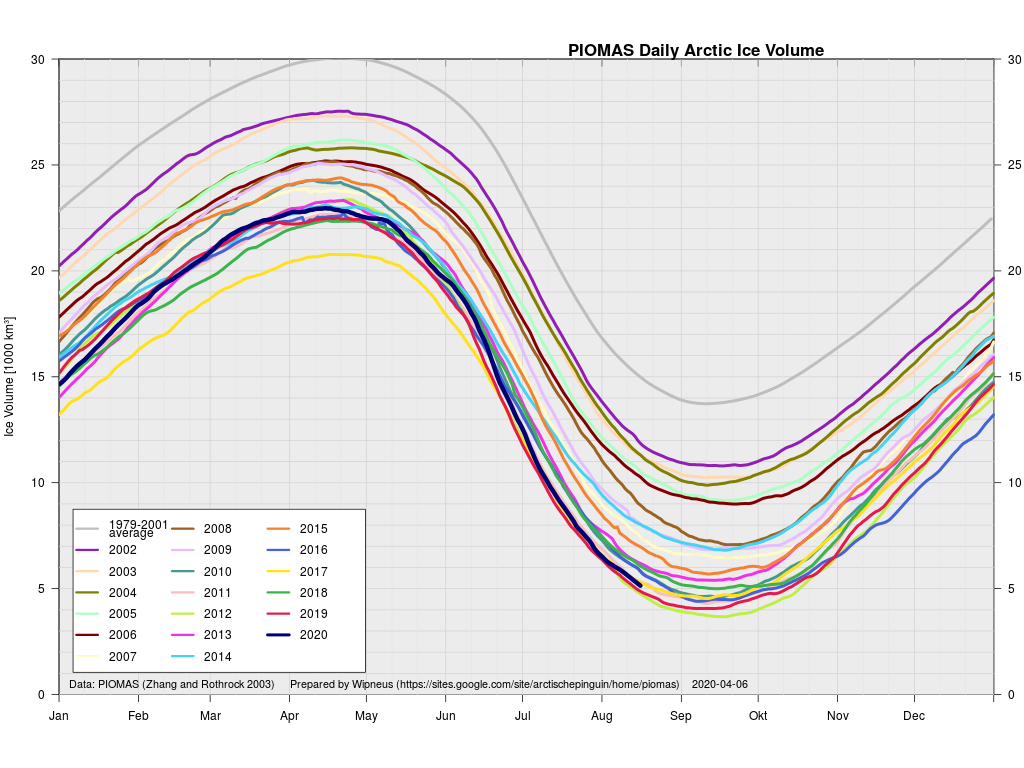
According to the Polar Science Center model Arctic sea ice volume is currently third lowest after 2012 and 2019.
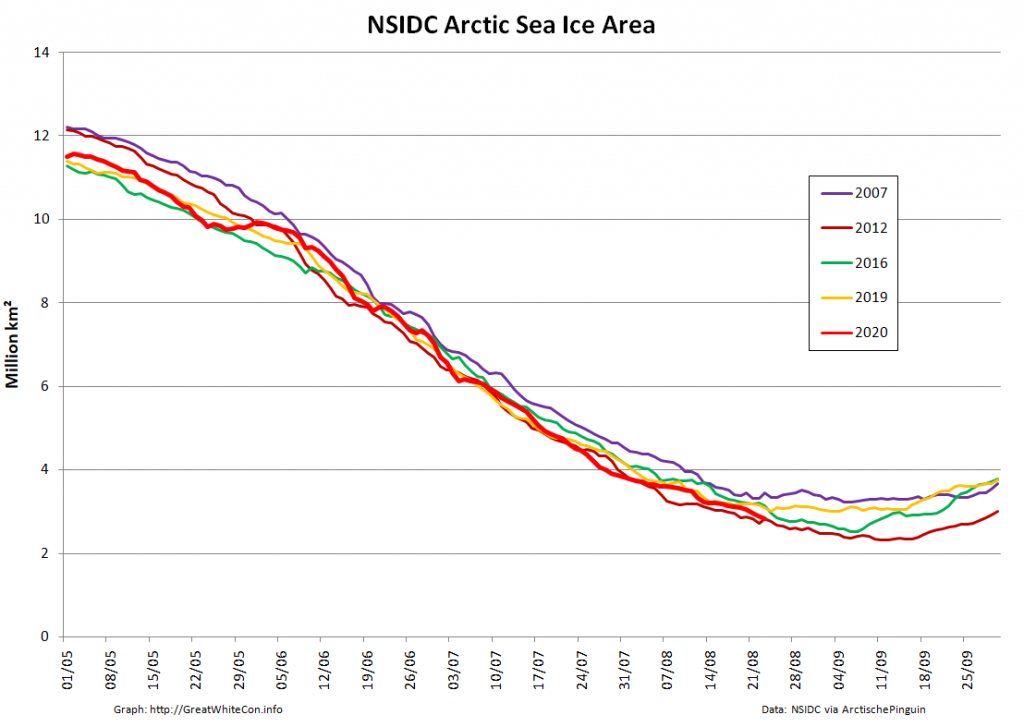
Arctic sea ice area based on NSIDC concentration data is now in a “statistical tie” with 2012 for the honour of “lowest for the date” in the satellite record:
High resolution AMSR2 area isn’t far behind:
A nice clear view of the disintegrating sea ice north of the East Siberian and Chukchi Seas yesterday:
Watch this space very closely for the next few weeks!
Jim,
Graet movie – in the Beaufort Sea Ice Movement movie, there are about 10 days missing near the end of July. Is there no data for those?
Thanks, Bas
Thanks Bas,
The process is largely automated, and it seems something has gone wrong in the “processing pipeline” somewhere.
I’ll take a look when I have a spare 5 minutes. Which won’t be for 2 or 3 days!
Jim
Now much improved, but looks like the University of Hamburg moved the origin of their map slightly at the end of June:
That will have to do for now!
Polarstern still seems to be heading for the North Pole itself. Currently located at 89°06’N, 036°12’W:
When was such a journey last possible?
Has it been possible for the last ten years and not before sort of thing??
I mean, was it possible in the 90s for instance?
It’s certainly been possible to sail an icebreaker to the North Pole in recent years:
https://GreatWhiteCon.info/2016/09/santa-extends-his-secret-summer-swimming-pool/
Russian nuclear icebreakers have been doing tourist trips to the North Pole for many years. I’m not sure when the first such voyage took place though. However according to Wikipedia:
“In July 1994 Yamal took an excursion to the North Pole, with the NSF (National Science Foundation – US), to celebrate the official maiden voyage.”
Doing more due diligence will have to wait until it’s no longer the middle of the night (UTC)!
However if by “such a journey” you mean heading due north of Kap Morris Jesup to the North Pole, then that has never been done as far as I am aware. Even the likes of Yamal would have had a tough time until very recently.
Maybe it would have been possible in 2018? Nobody tried though!
https://GreatWhiteCon.info/2018/08/could-northabout-circumnavigate-greenland-in-2018/
The late melting season “plummet” in extent continues. Another century break:
Polarstern reached the North Pole earlier today:
Polarstern is pressing on towards the Siberian coast endeavouring to locate an ice floe solid enough to support continued experiments as part of the MOSAiC expedition.
That search has now reached 89°00 N, 104°00′ E:
Polarstern is still searching for a suitable ice floe:
Current location: 87°42′ N, 104°30′ E
JAXA extent is still falling steeply, and is now in a “statistical tie” with 2019 for second place behind 2012 in the race for a record minimum:
Jaxa thickness looks very very dire.
Is this some kind of erratta?
This one you mean?
That’s currently displaying “ice melt concentration”, and there’s certainly still a lot of surface that’s melted.
Jim, question. I find this system of measuring the Arctic Sea ice by area and extent not very cogent. Why not measure the open water instead. That tells us the pertinent facts about total remaining sea ice surface area, by deduction. The measurement system of area and extent is probably 40 years old and somewhat inappropriate now. What do you think?
As far as the NSIDC Sea Ice Index is concerned the fact that “The measurement system of area and extent is probably 40 years old” is actually the point. Please see:
https://GreatWhiteCon.info/2016/02/dmi-masie-and-the-sea-ice-index-an-interview-with-walt-meier/
How might one “measure open water” during the melting season? Is there an algorithm that unequivocally differentiates between “open water” and “melt ponds” for example?
I think both open water and melt ponds are the important point because they both have high absorption of heat. It is not the disappearance of ice that is the real problem it is the appearance of open water which is the killer. Now, they are interlinked, to be sure. But open water gets rid of area and extent as different measurements. The extent is really just dispersion, the area is probably the important measure, but record lows reported in the media usually refer to extent.
Anyway, I was just looking at Zach Labe’s graphs, which are just great, but miss this easy to understand “open water” measurement which I would like to see.
Extent is indeed the number usually reported in the media and by the NSIDC, since it’s the easiest metric to measure.
What’s really most important is the heat absorbed by the ocean rather than reflected back into space. Albedo is the first step in attempting to quantify that. Sea ice area provides a better first pass at that than extent, and see also Nico Sun’s “Albedo-Warming Potential“:
There a numerous other confounding factors though, not least of which are clouds.
Arctic wide extent and area are calculated by summing the contribution of sea ice concentration in “grid cells” that differ in size depending on the satellite sensor and algorithm used to calculate a particular metric. See the 2020 minimum extent thread to see the effect that can have. At the grid cell level “open water” is simply 1 – “sea ice concentration”. Hence it doesn’t add any extra information over and above “area”?
It occurs to me that we may have already had a “blue ocean event” if we include melt ponds. One reason is the difference between direct observation from the deck of the PolarStern of the North Pole with much open water and melt ponds vs the satellite images which reveal only ice. This is very significant. It is not my own opinion or deduction, but I pass it along from a long term scientist who observes the Arctic Sea Ice, and finds the old measurement systems to be inadequate.
I beg to differ regarding “satellite images”. See for example:
https://GreatWhiteCon.info/2020/07/facts-about-the-arctic-in-july-2020/#Jul-06
The “warm blob” is back, but this time it’s rising under the sea ice in the Arctic:
https://www.sciencemag.org/news/2020/08/growing-underwater-heat-blob-speeds-demise-arctic-sea-ice
What’s more my own specialist subject of “waves in ice” gets a mention too: