Tag Archives: Wipneus

The 2018 Maximum Arctic Sea Ice Extent

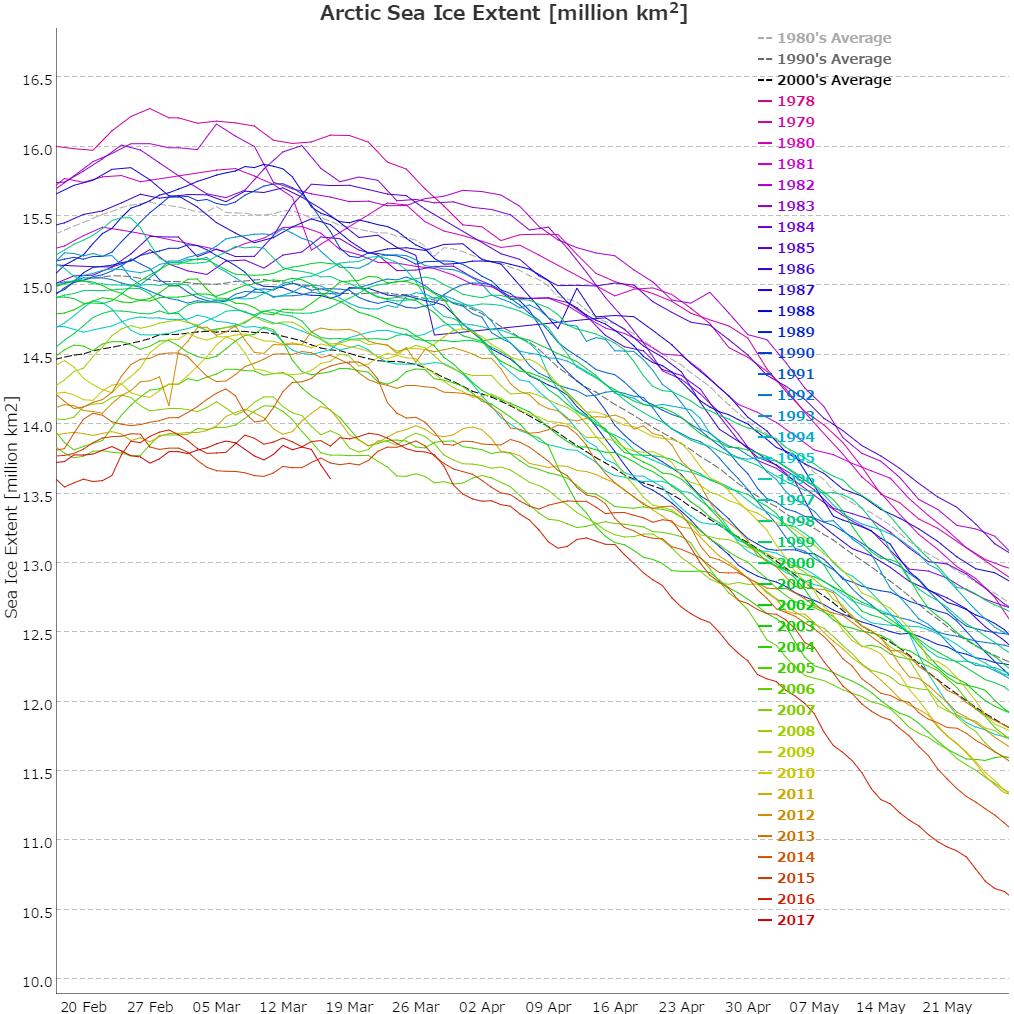
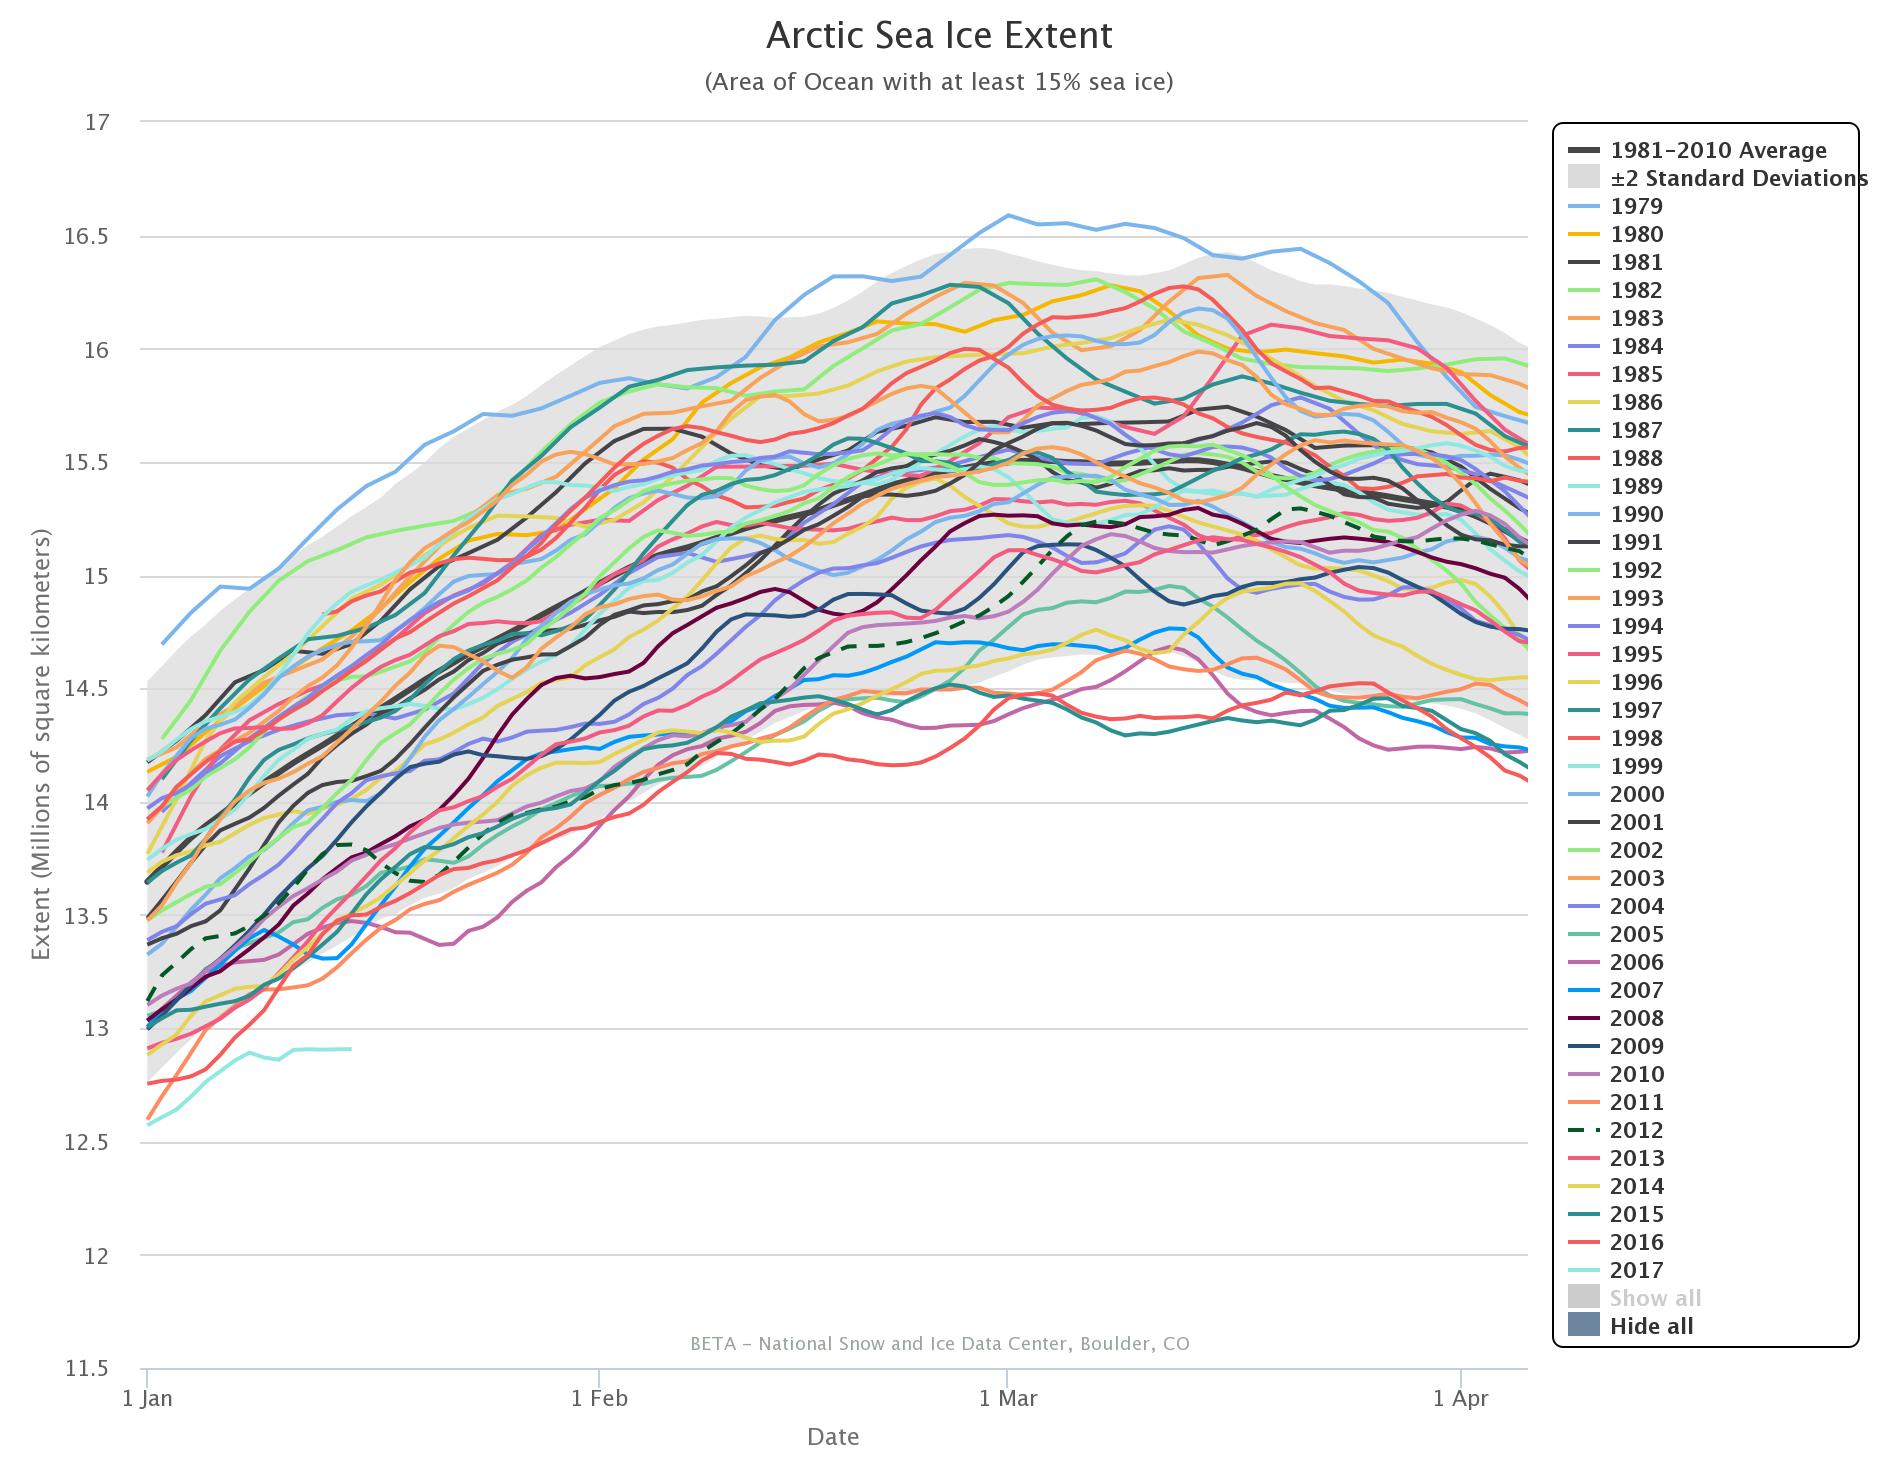
According to the latest edition of the National Snow and Ice Data Center’s “Arctic Sea Ice News”

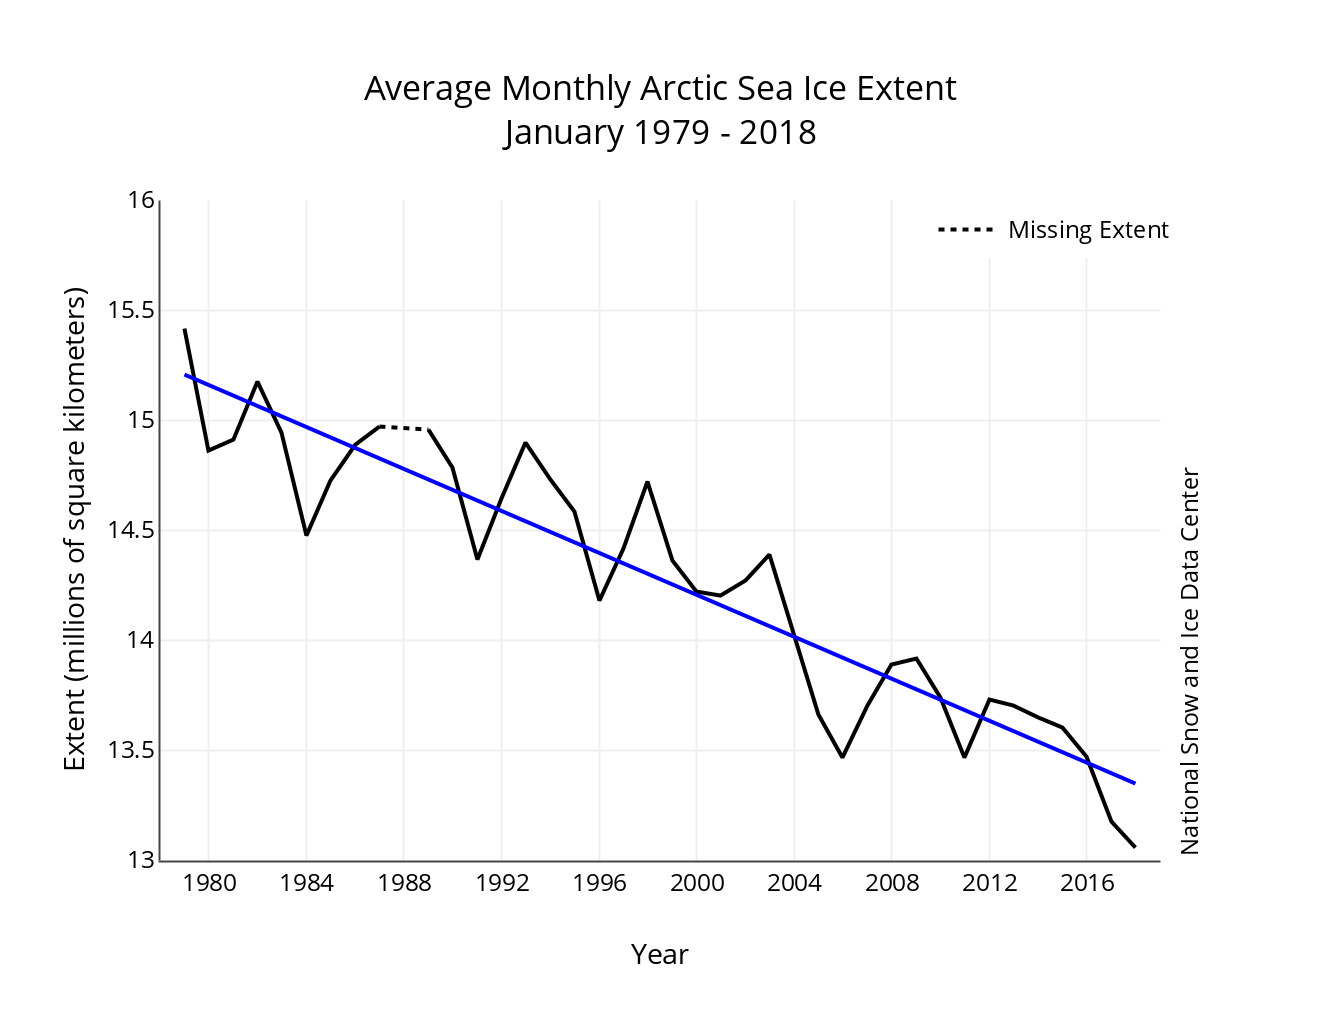
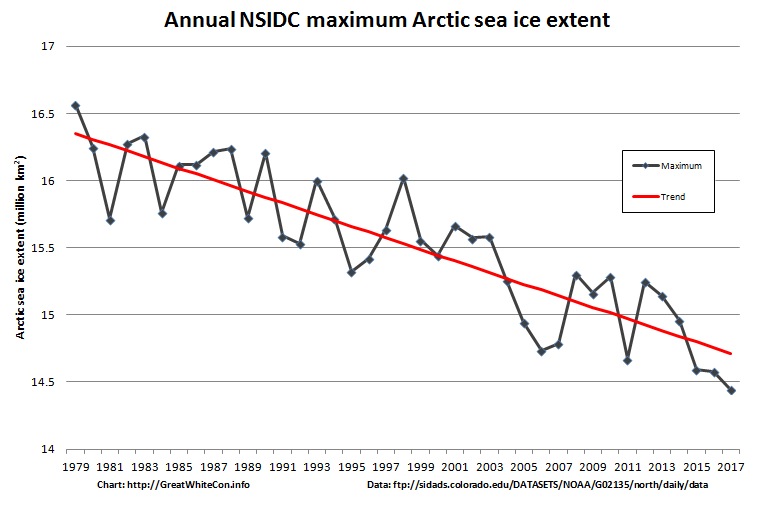
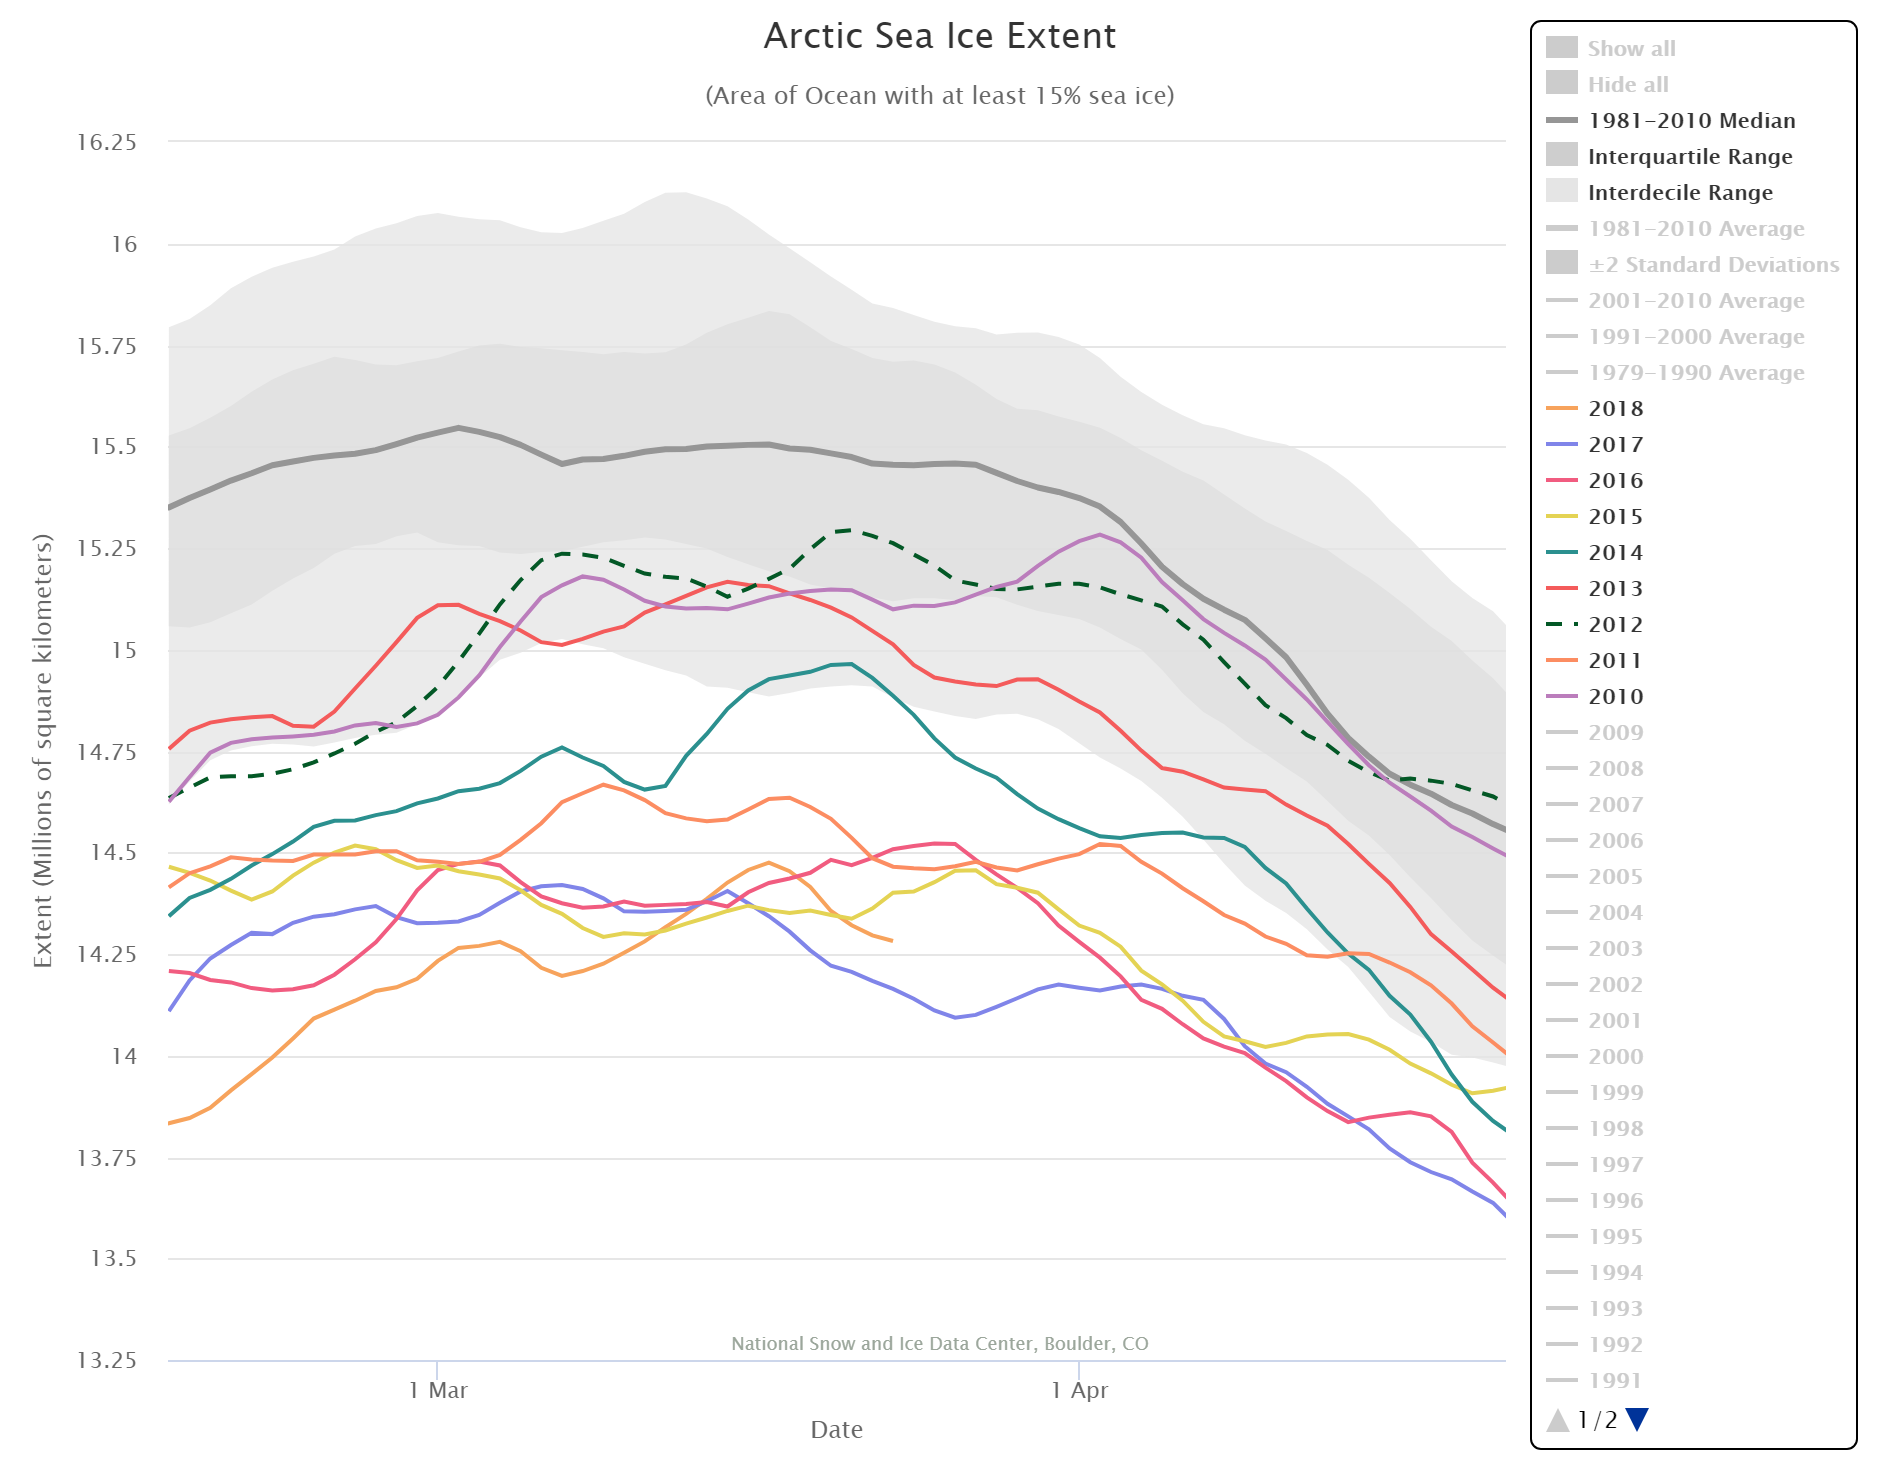
On March 17, 2018, Arctic sea ice likely reached its maximum extent for the year, at 14.48 million square kilometers (5.59 million square miles), the second lowest in the 39-year satellite record, falling just behind 2017. This year’s maximum extent is 1.16 million square kilometers (448,000 square miles) below the 1981 to 2010 average maximum of 15.64 million square kilometers (6.04 million square miles).

The four lowest seasonal maxima have all occurred during the last four years. The 2018 maximum is 60,000 square kilometers (23,200 square miles) above the record low maximum that occurred on March 7, 2017.

Here’s a close up view of recent maxima via the NSIDC’s Charctic interactive sea ice graph:

Charctic-20180323

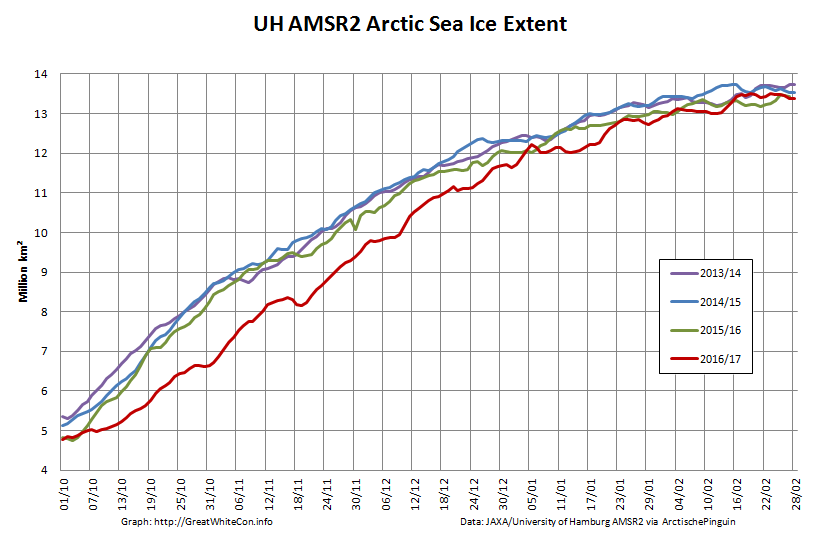
Next let’s take a look at extent data from the Japanese National Institute of Polar Research, colloquially referred to as “JAXA extent”

VISHOP_Extent-20180323

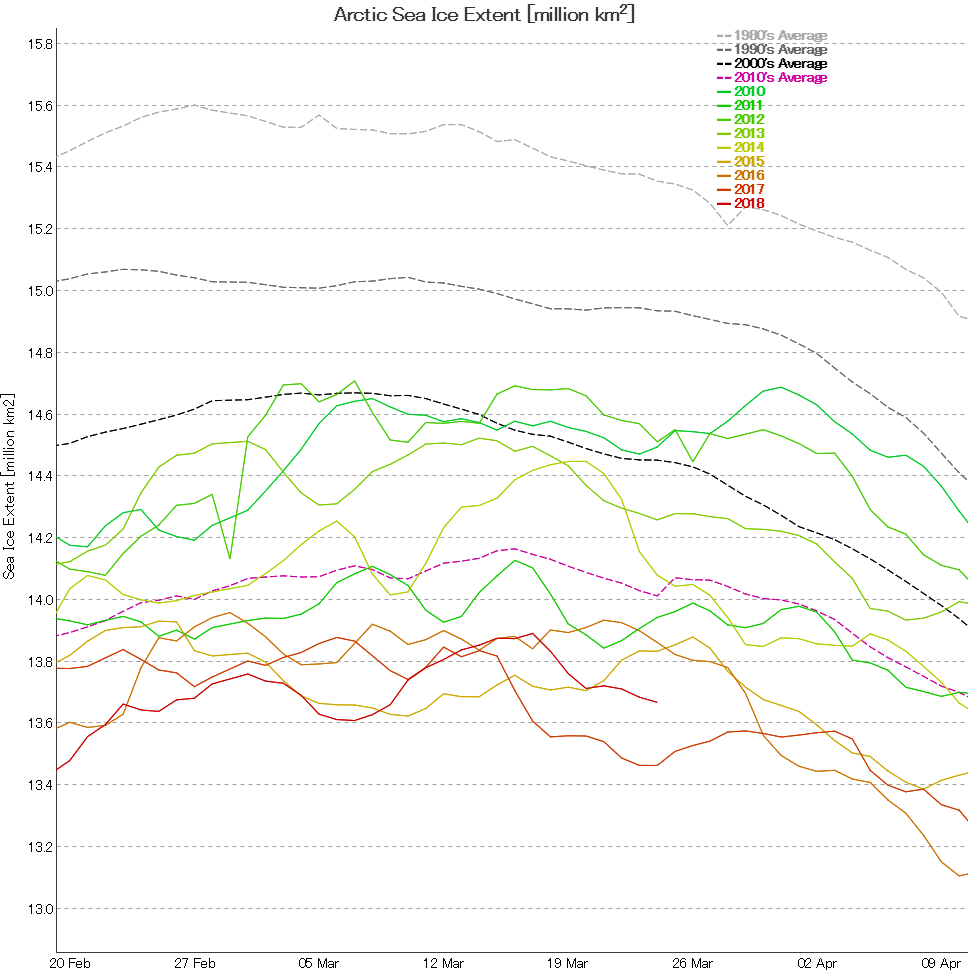
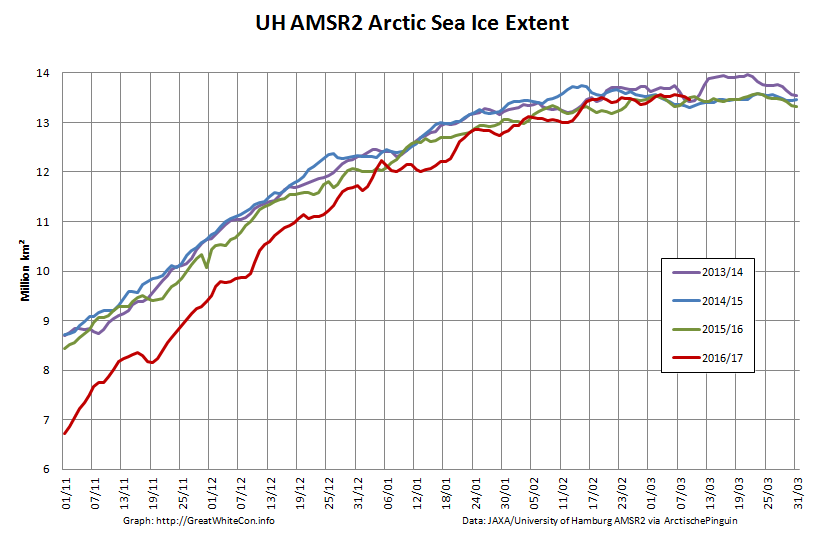
In this case the maximum was 13.89 million square kilometers, also on March 17th.

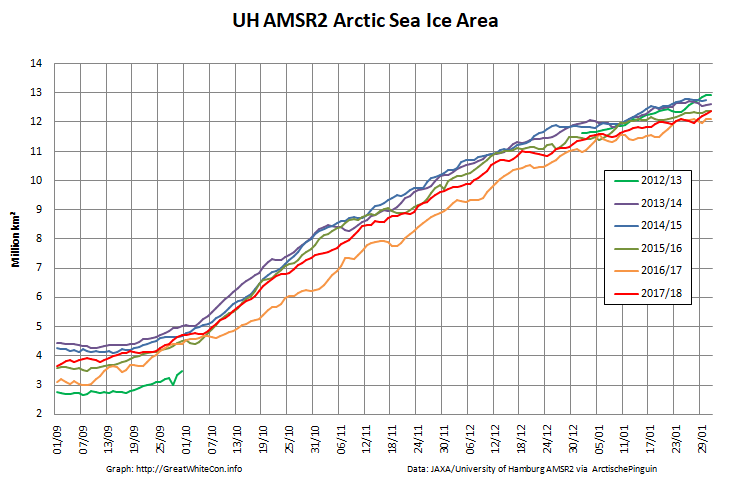
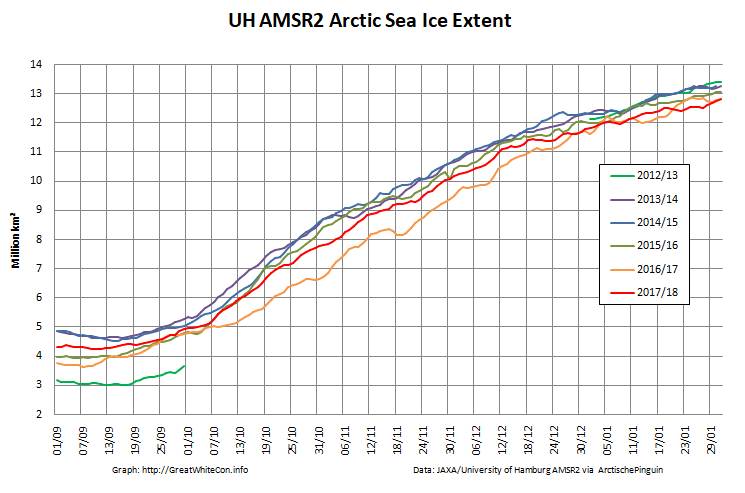
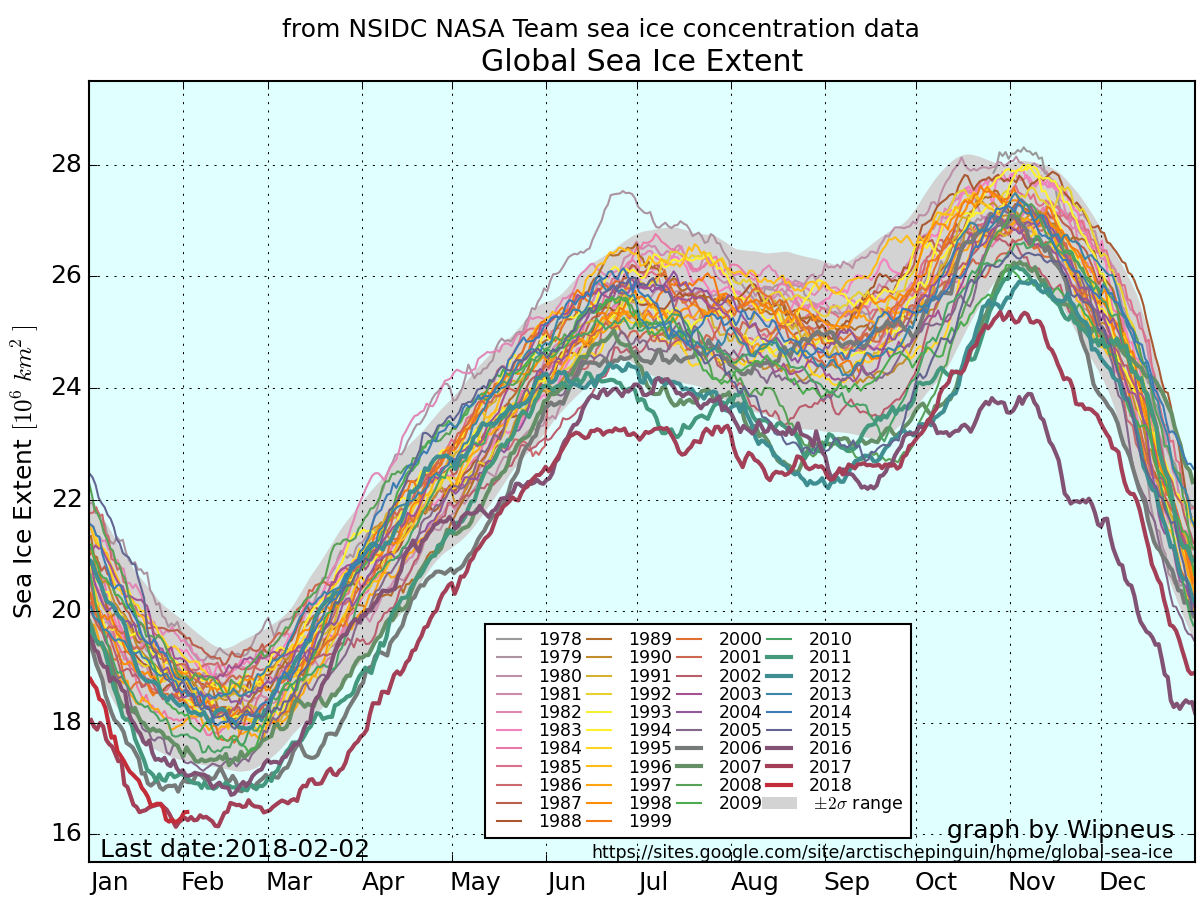
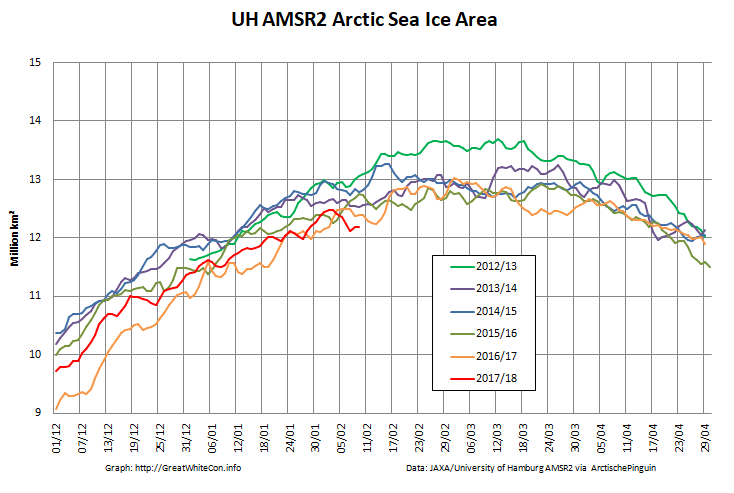
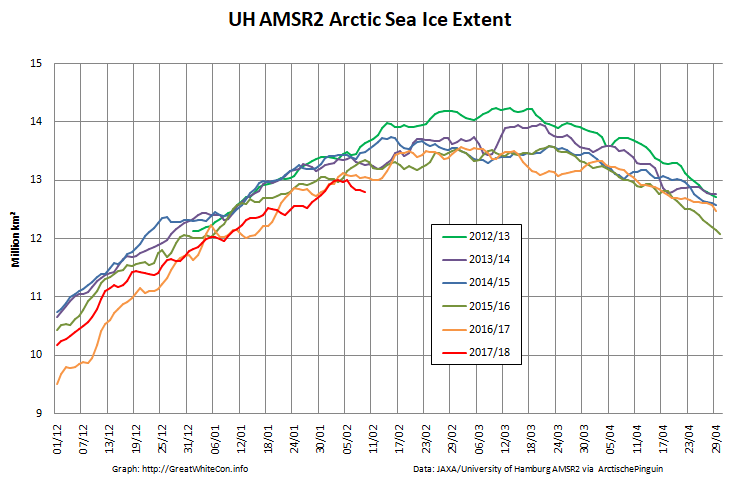
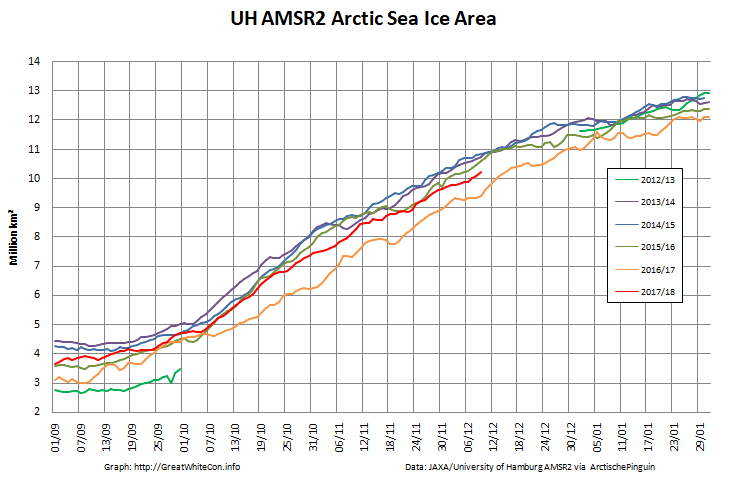
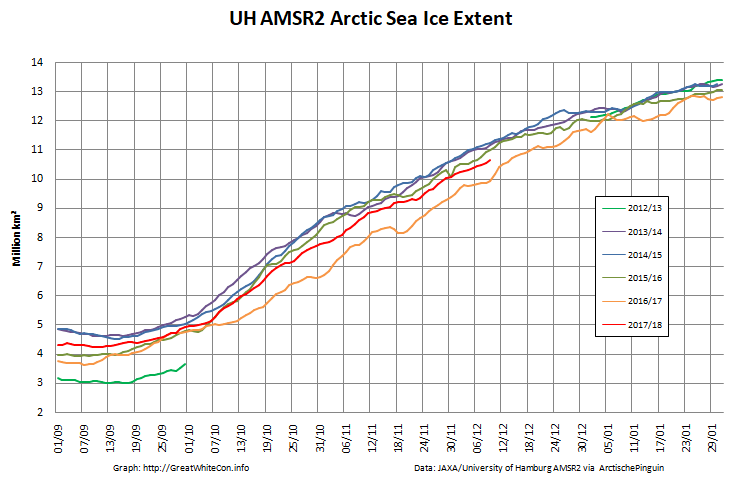
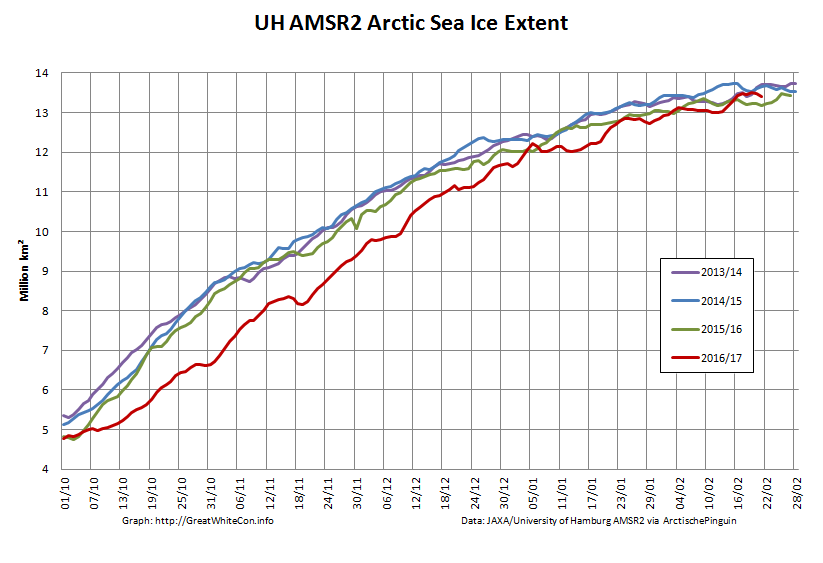
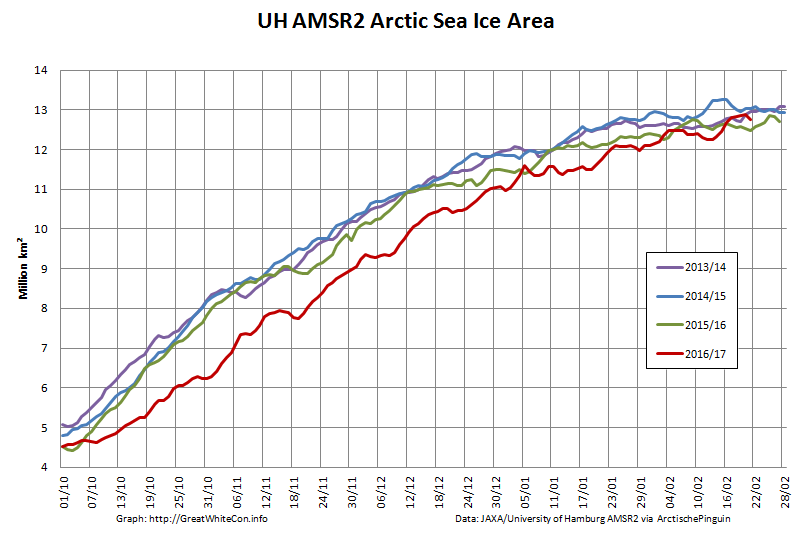
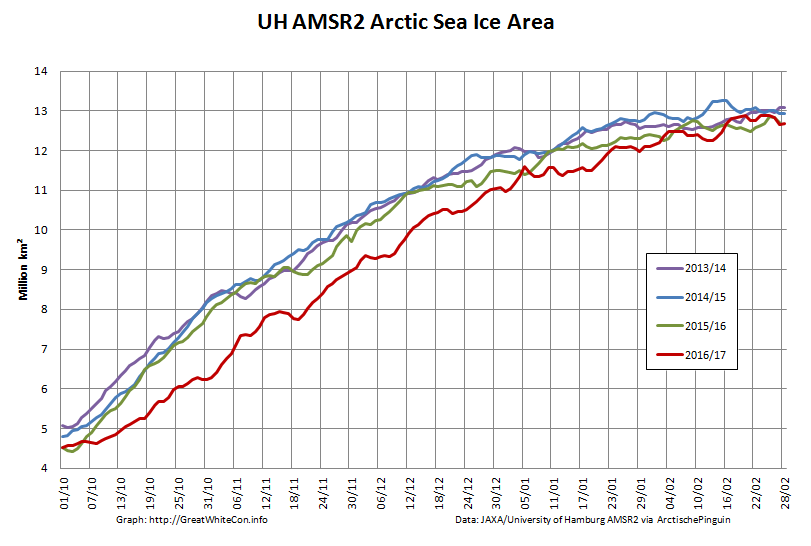
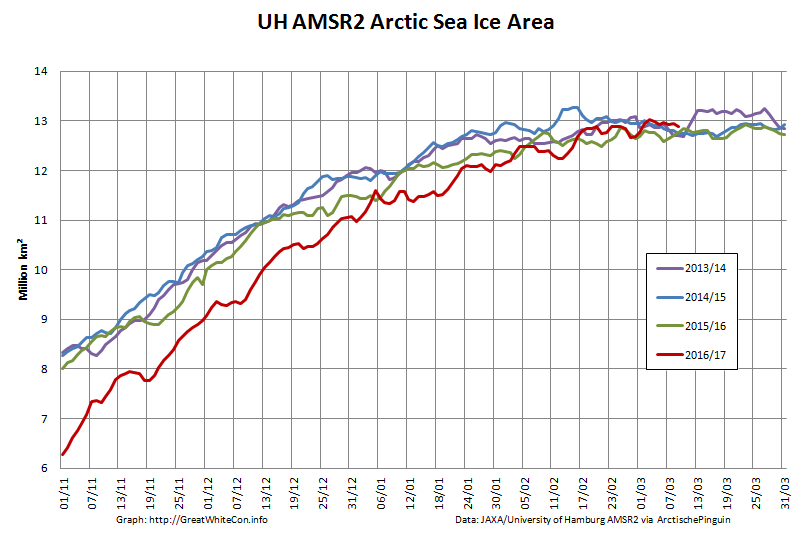
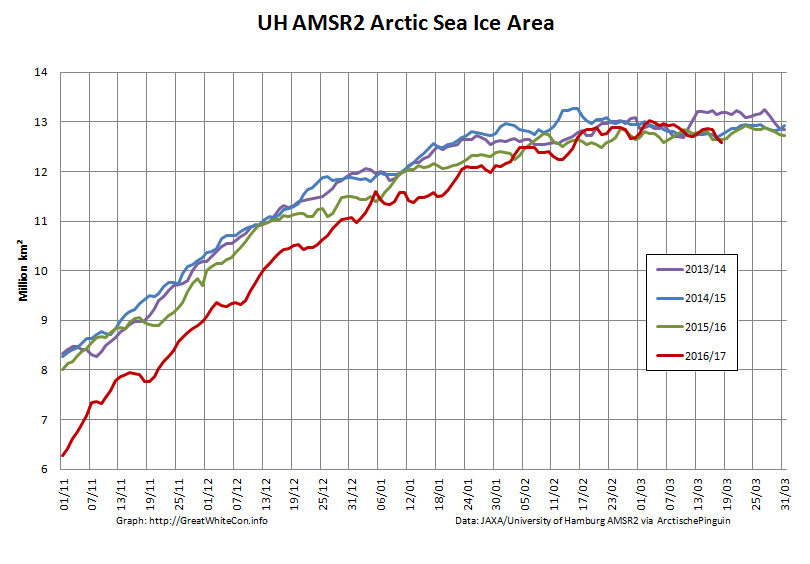
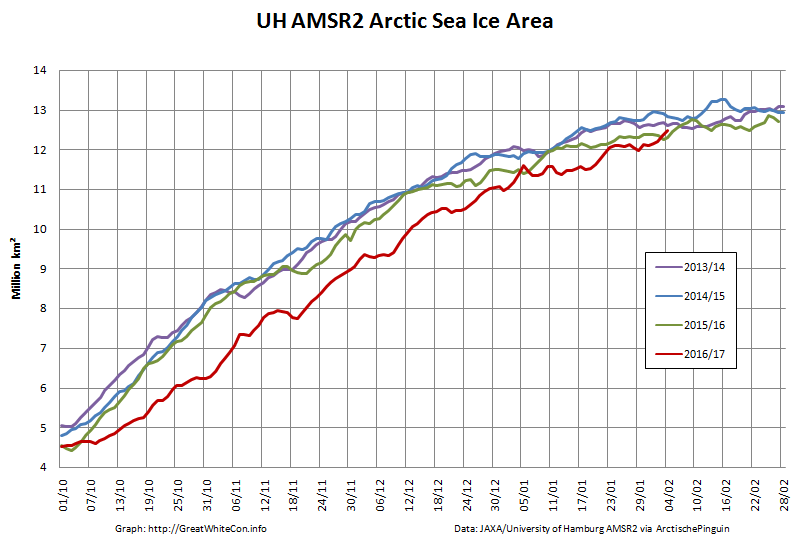
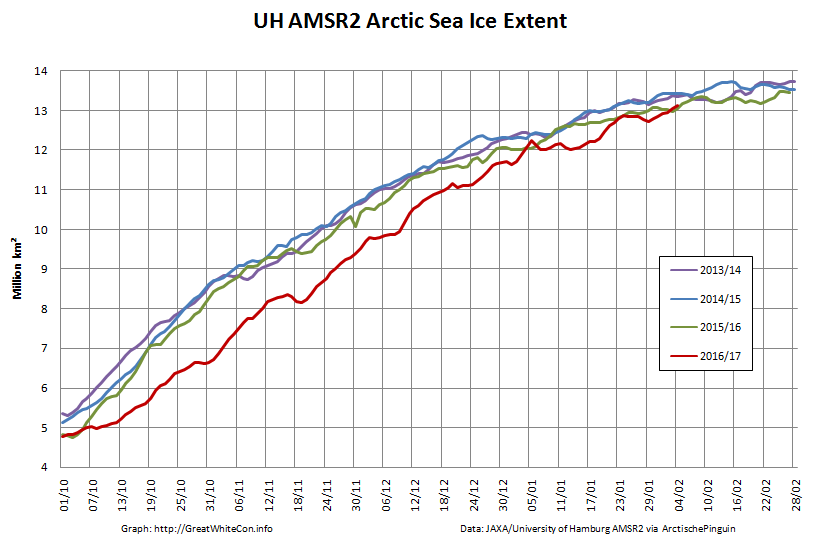
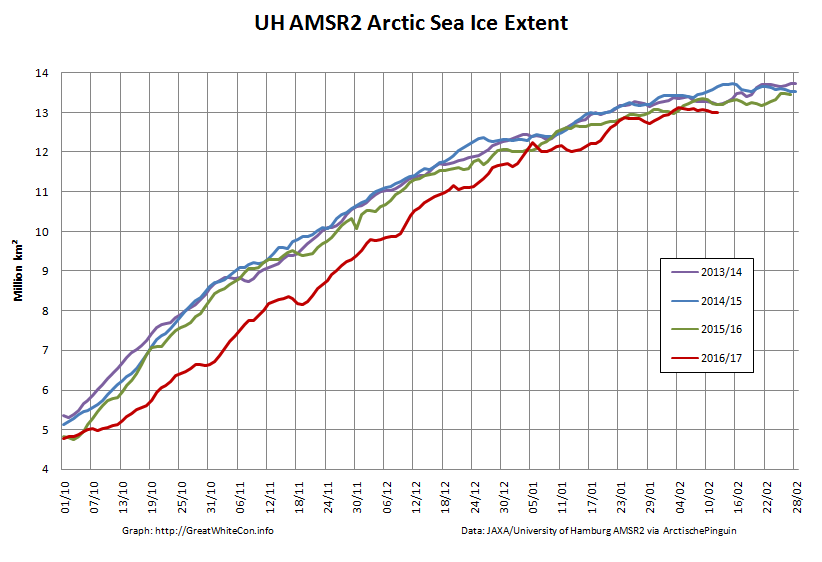
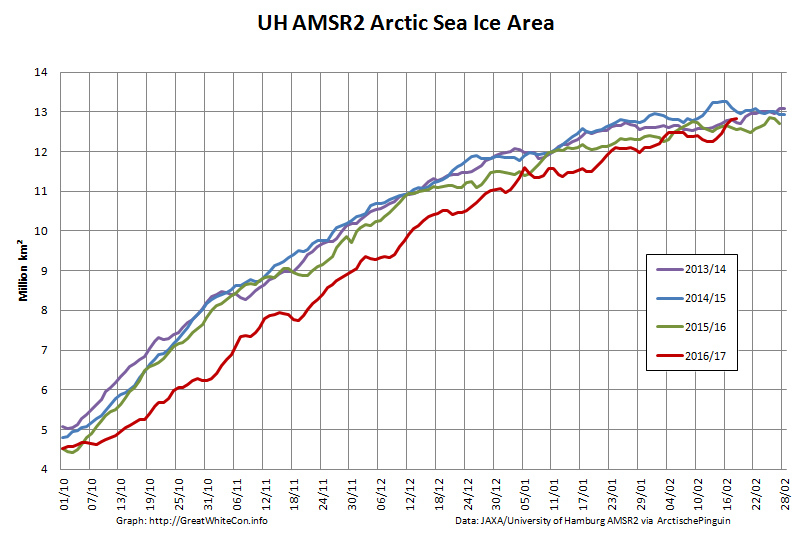
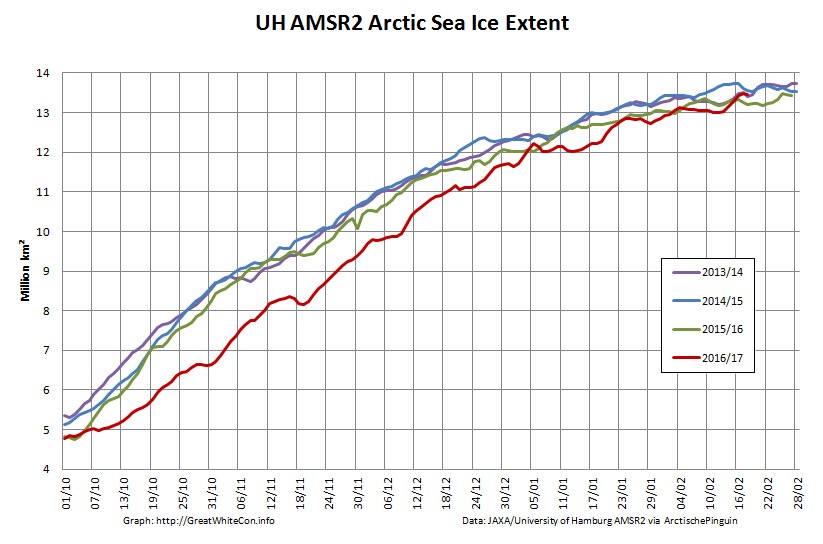
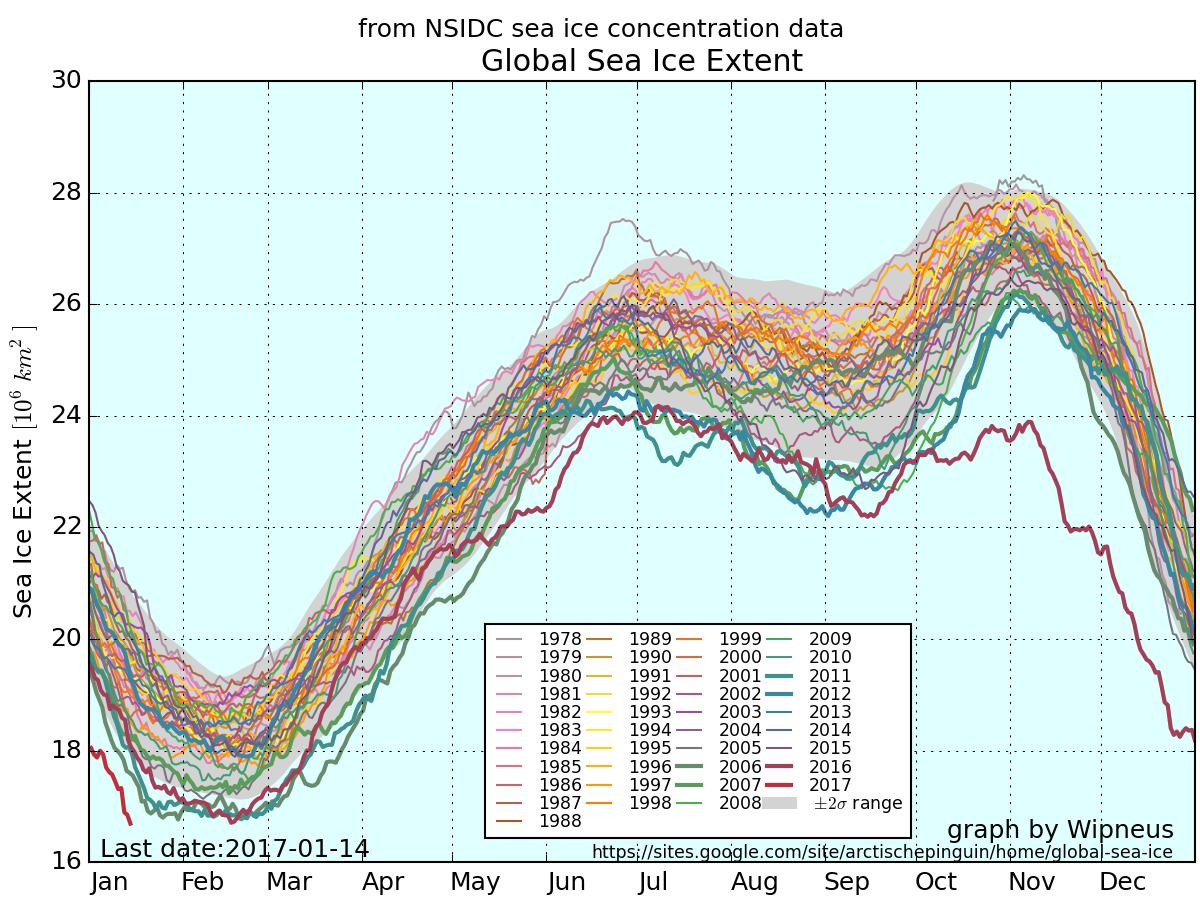
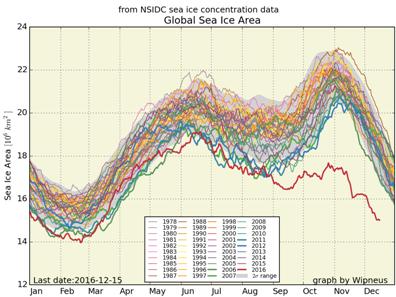
Here too are the extent and area graphs based on Wipneus’ processing of the University of Hamburg’s AMSR2 based concentration data:

UH-Arctic-Extent-2018-03-23

UH-Arctic-Area-2018-03-23

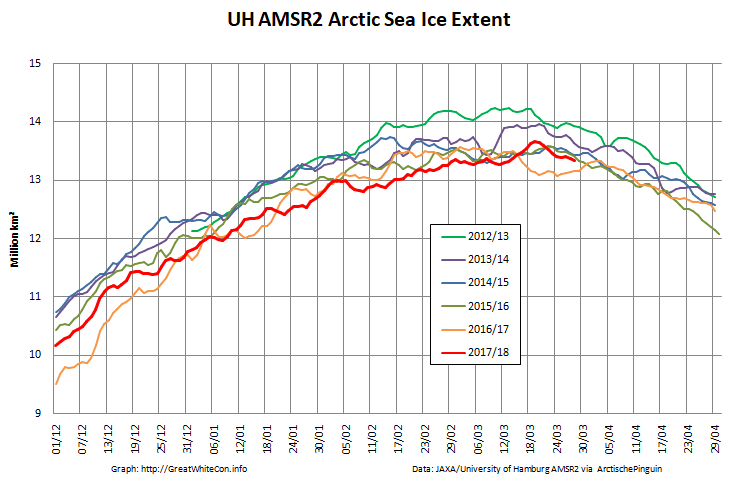
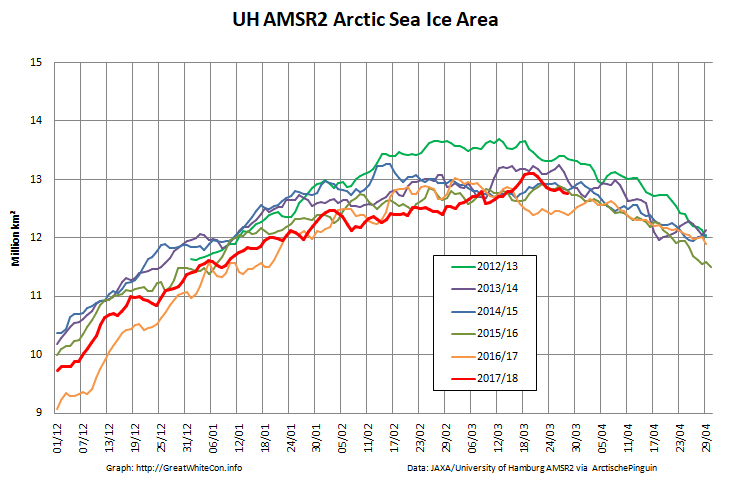
They highlight the surge in Arctic sea ice area in the middle of March due to the sudden “cold snap”:

meanT_2018-03-24
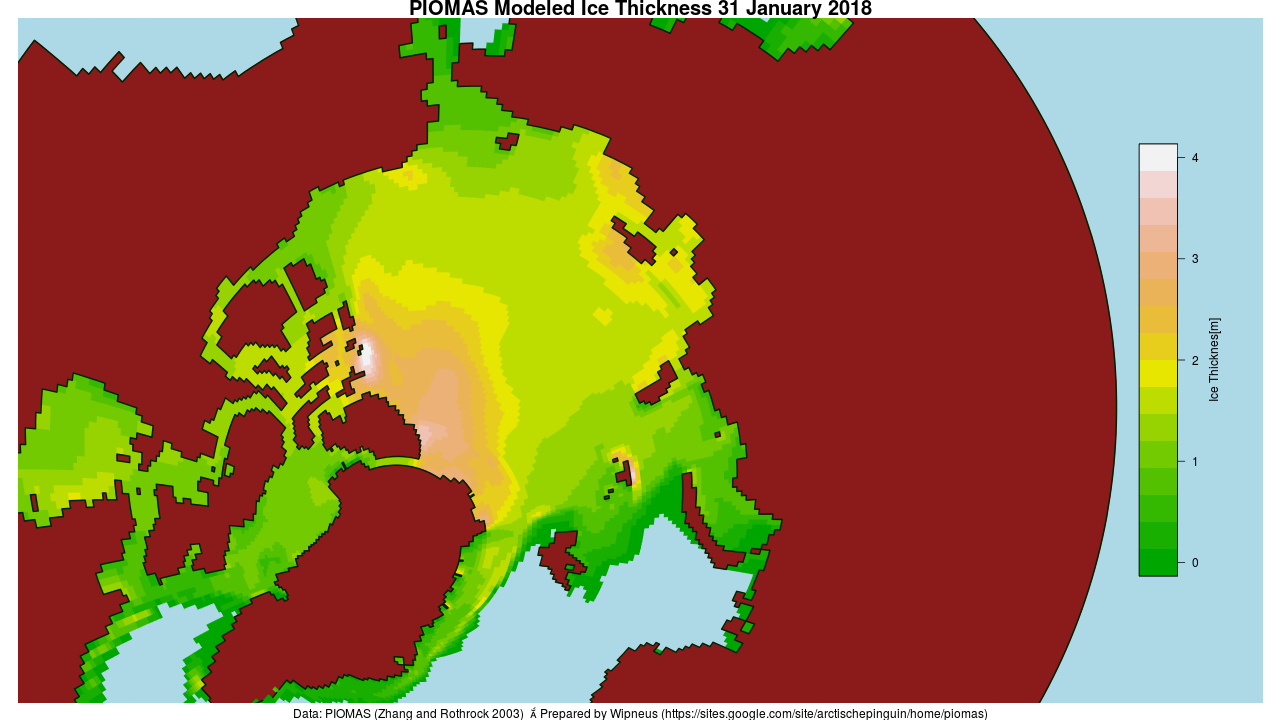
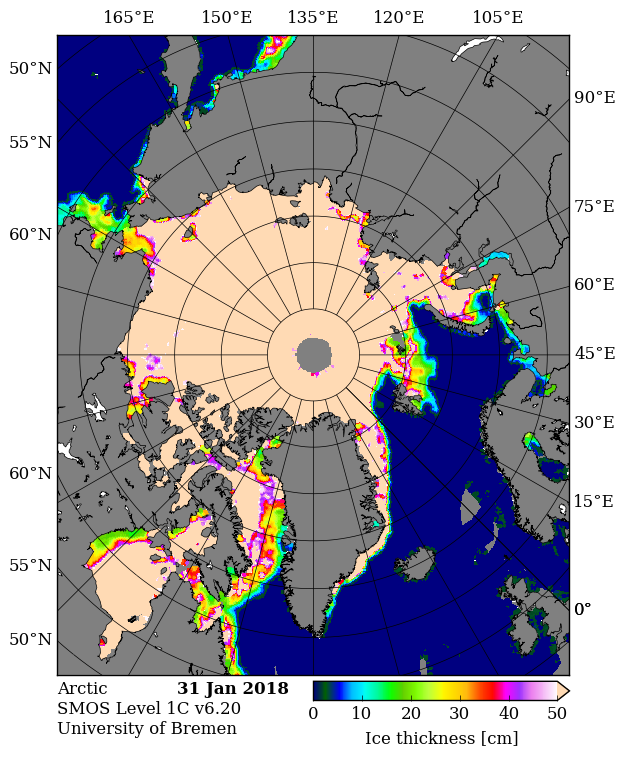
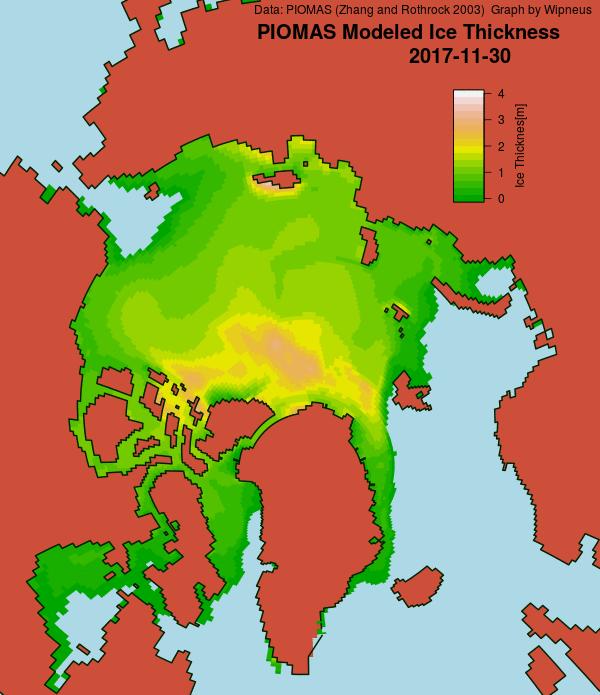
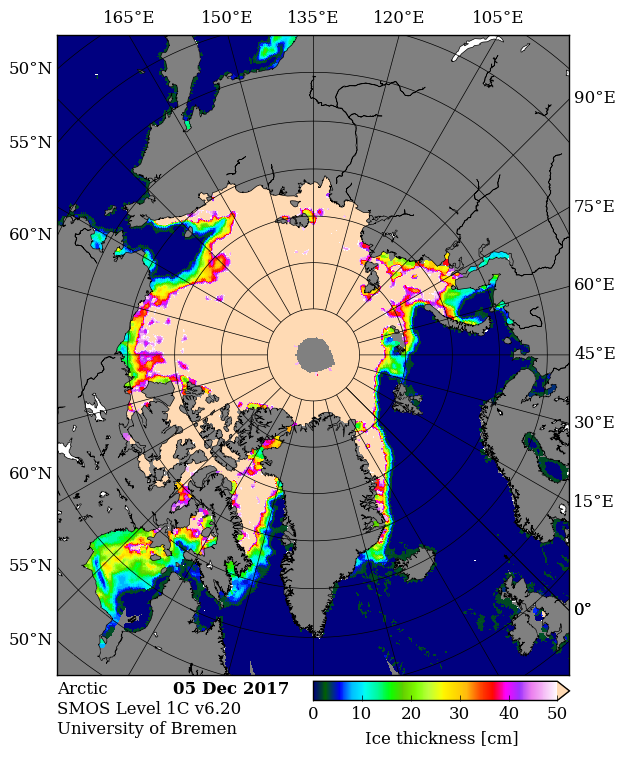
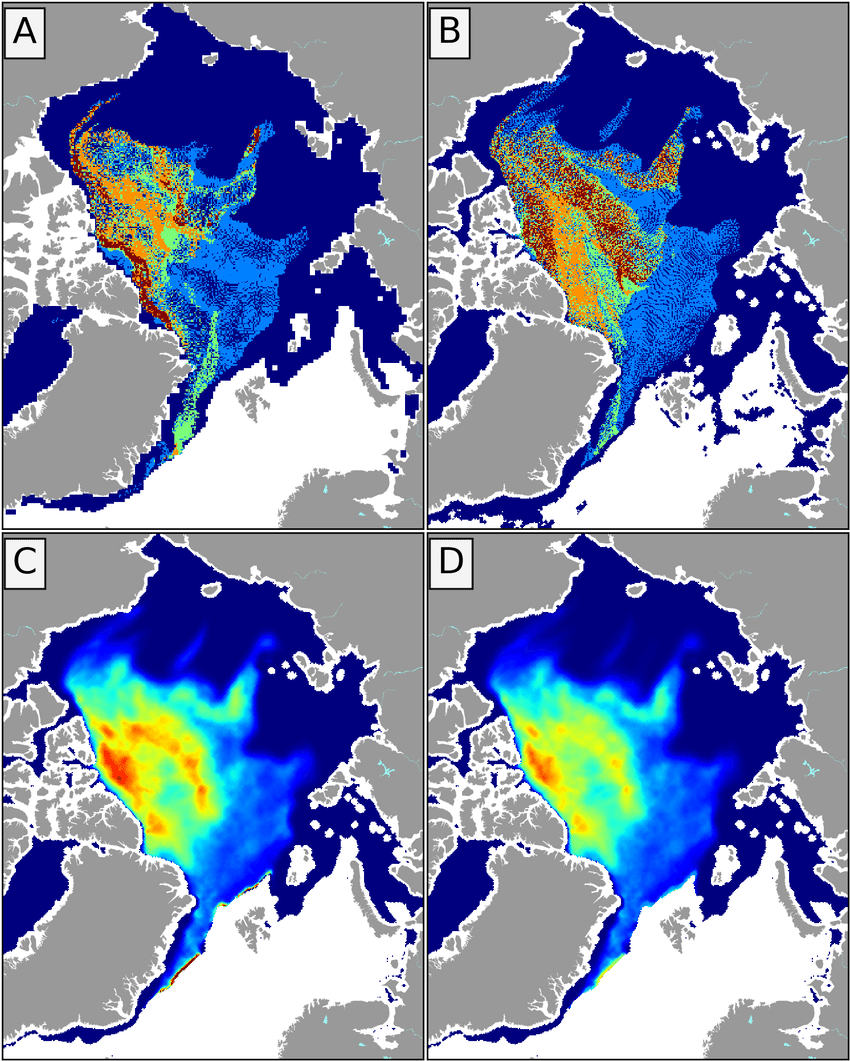
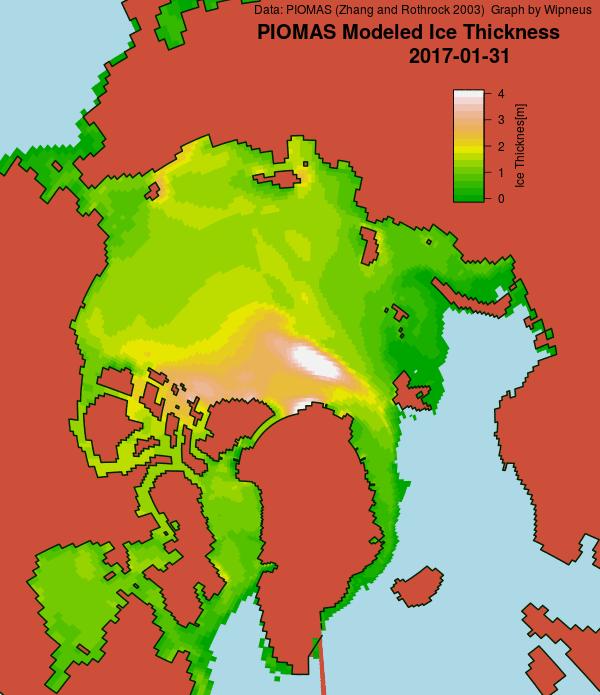
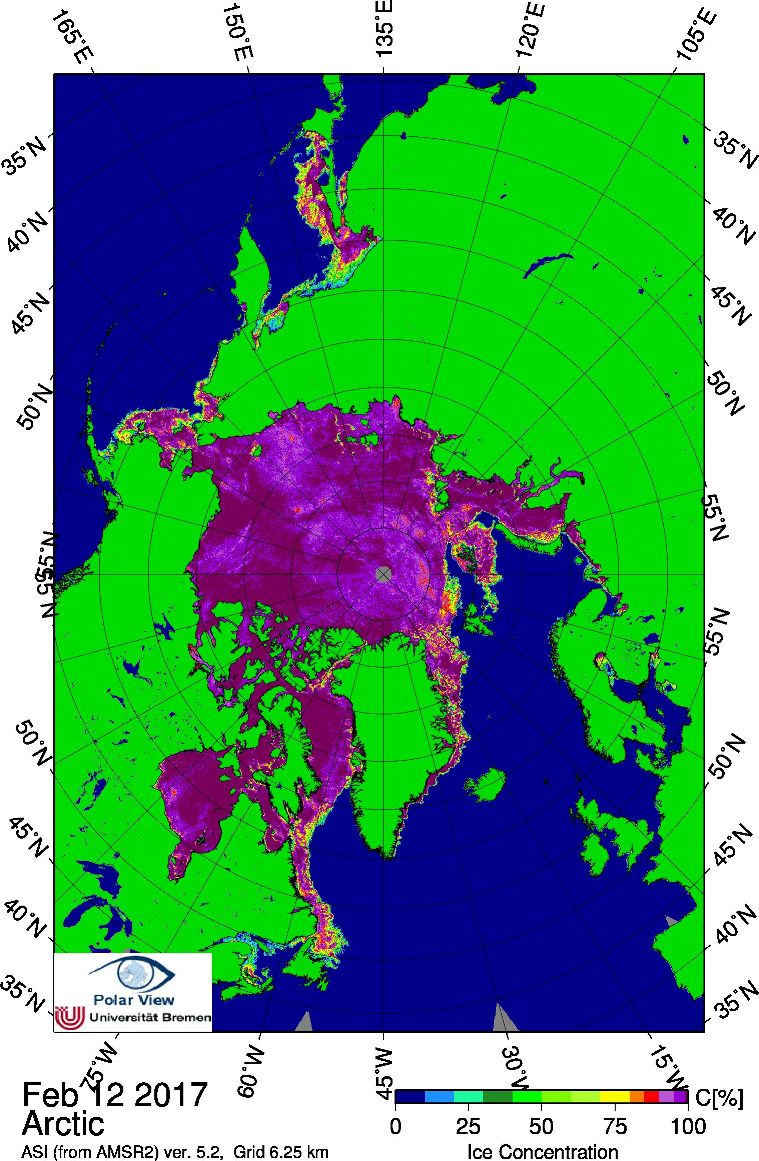
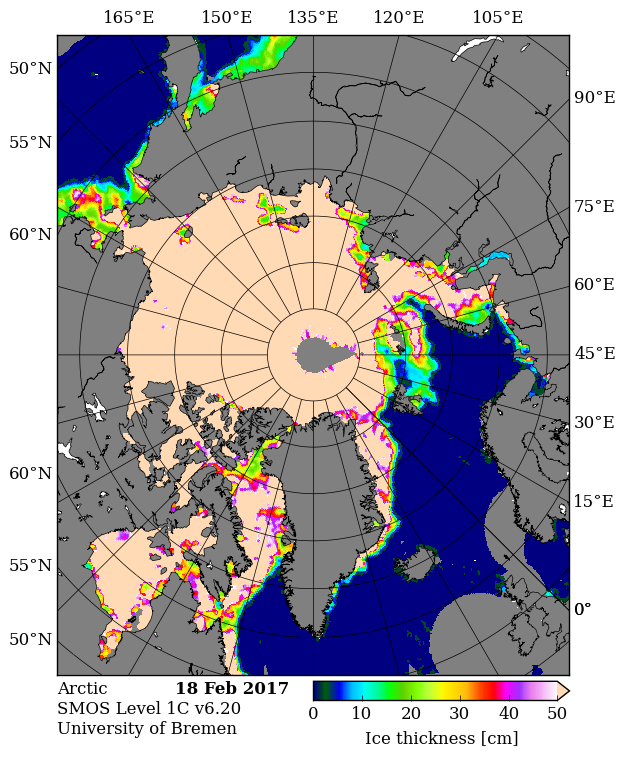
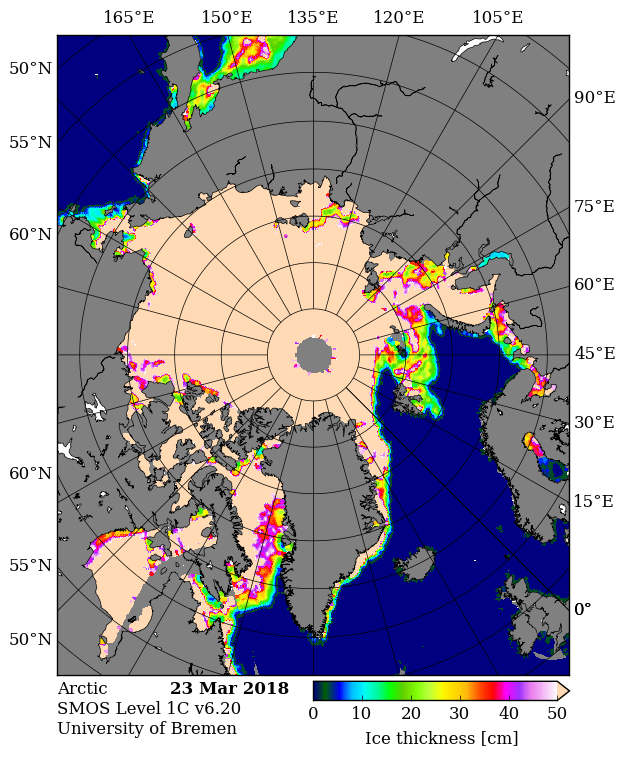
Looking at the third Arctic dimension, here’s the latest SMOS thickness map from the University of Bremen:

SMOS-20180323

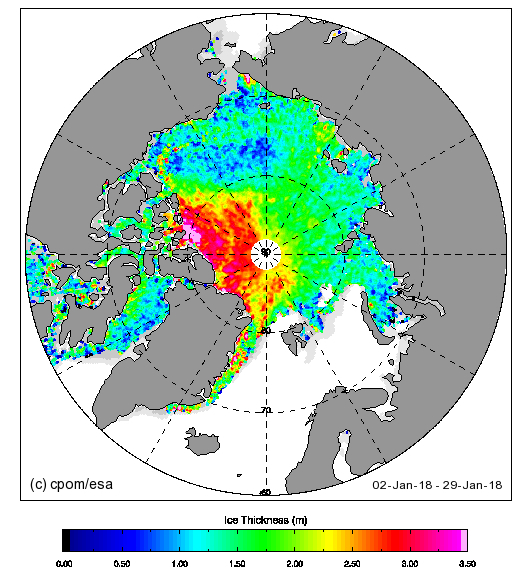
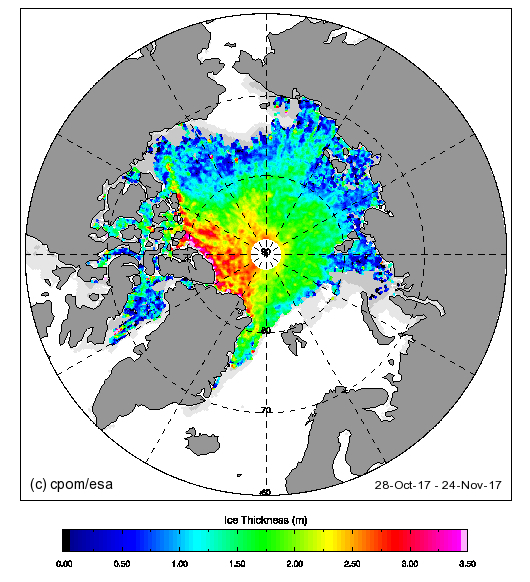
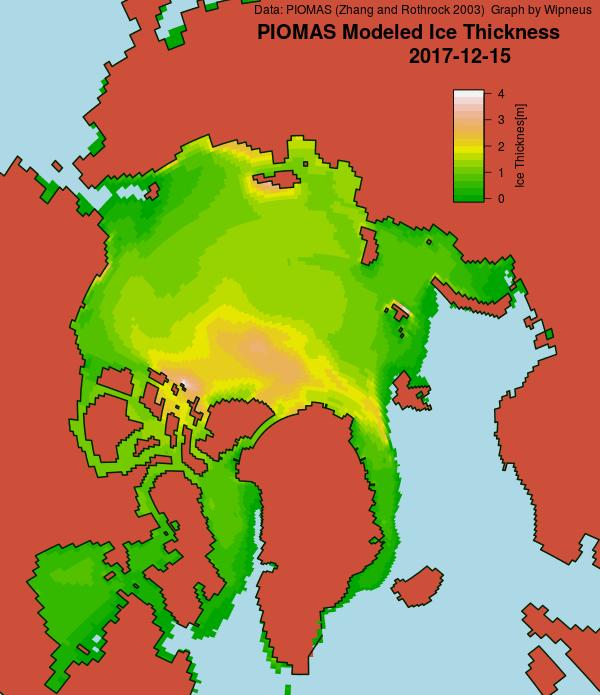
and here’s the latest CryoSat-2 thickness map:

CS2-thk_28-2018-03-21

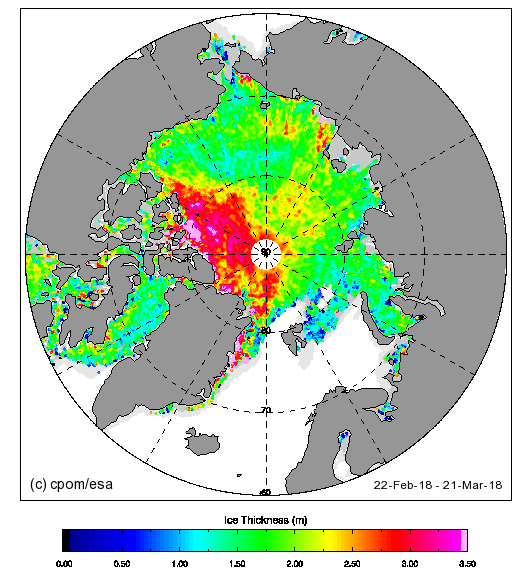
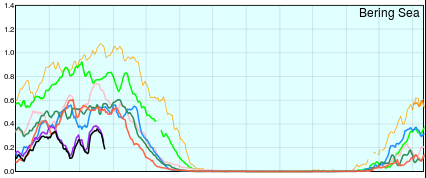
They reveal large areas of relatively thin sea ice in the Okhotsk and Barents Seas where the ice can now be expected to melt as quickly as it formed. There is also remarkably little sea ice in the Bering Sea for the time of year:

UH-Bering-Extent-2018-03-23

Facts About the Arctic in February 2018

Whilst the official PIOMAS volume figures for January have yet to be released Wipneus has worked his usual magic on the gridded thickness numbers to reveal:

PIOMAS-thkness-20180131

not to mention the calculated volume:

PIOMAS-volume-20180131

and the volume anomaly:

PIOMAS-anomaly-20180131

As Wipneus puts it:

Estimated from the thickness data, the latest value is from 31st of January: 17.57 [1000 km3], which is the second lowest value for that day, 2017 is lowest by a rather large margin at 16.16 [1000 km3].

Here are the “measured” thickness maps from SMOS:

SMOS-20180131

and CryoSat-2:

CS2-thk_28-2018-01-29

Here are the end of January Arctic wide high resolution AMSR2 graphs based on University of Hamburg data:

UH-Arctic-Area-2018-01-31

UH-Arctic-Extent-2018-01-31

In addition, since it’s that time of year, here too is Wipneus’ NSIDC global sea ice extent:

nsidc_global_extent_20180202

The minimum thus far is very slightly above last year’s value, but perhaps like last year there will be a “double dip”?

Getting back to the Arctic, here is the DMI >80N temperature plot for January:

DMI-meanT_20180201

together with the associated freezing degree days graph:

2018-02-01-DMI-FDD

Here’s a video showing the effect of the mid January cyclones on the sea ice in the Fram Strait and north of Svalbard:

Finally, for the moment at least, here is the current Fram Strait surf forecast for 12:00 UTC on February 5th:

Significant_height_of_combined_w in multi_1.glo_30mext.20180203_00021

Mean_period_of_wind_waves_surfac in multi_1.glo_30mext.20180203_00021

Those maps shows 10 meter high, 15 second period waves heading straight for the ice edge north of Svalbard.


[Edit – February 7th]

The latest edition of Arctic Sea Ice News has been published. As the NSIDC put it:

January of 2018 began and ended with satellite-era record lows in Arctic sea ice extent, resulting in a new record low for the month. Combined with low ice extent in the Antarctic, global sea ice extent is also at a record low.

monthly_ice_01_NH_v3.0

Air temperatures at the 925 hPa level (about 2,500 feet above sea level) remained unusually high over the Arctic Ocean. Nearly all of the region was at least 3 degrees Celsius (5 degrees Fahrenheit) or more above average. The largest departures from average of more than 9 degrees Celsius (16 degrees Fahrenheit) were over the Kara and Barents Seas, centered near Svalbard. On the Pacific side, air temperatures were about 5 degrees Celsius (9 degrees Fahrenheit) above average. By contrast, 925 hPa temperatures over Siberia were up to 4 degrees Celsius (7 degrees Fahrenheit) below average. The warmth over the Arctic Ocean appears to result partly from a pattern of atmospheric circulation bringing in southerly air, and partly from the release of heat into the atmosphere from open water areas.

airtemp-201801


[Edit – February 10th]

The University of Hamburg’s high resolution AMSR2 derived area is bouncing back after the recent cyclone, but extent is currently still declining:

UH-Arctic-Area-2018-02-09

UH-Arctic-Extent-2018-02-09

The recent drop in Arctic sea ice extent has pushed the NSIDC global extent to a new all time (satellite era!) low:

nsidc_global_extent_20180209

The 2017/18 Festive Season in the Arctic

Christmas is coming, and Santa’s secret summer swimming pool has frozen over once again. However the same can’t be said for the Chukchi Sea! More on that in due course, but first let’s take a look at the PIOMAS volume graph at the end of November, courtesy of the wondrous Wipneus on the Arctic Sea Ice Forum:

piomas-trnd4-2017-11

2017 is currently third lowest, behind 2012 and 2016. Next let’s take a look at Wipneus’ PIOMAS Arctic sea ice thickness map:

PIOMAS-thk-20171130

followed by the University of Bremen’s SMOS Arctic sea ice thickness map:

20171205_hvnorth__l1c

Note the large area of pale blue open ocean still visible in the Chukchi Sea towards the top left of both maps.

For another perspective on Arctic sea ice thickness here’s the latest Cryosat-2 map, which currently is based on the month up to November 24th:

CS2-thk_28-2017-11-24

Finally, for the moment at least, here’s our very own Arctic Freezing Degree Days graph based on the DMI’s >80N data:

DMI-FDD-2017-12-06

2017 is currently occupying the wide open space between the astonishingly low numbers last year and all previous years in DMI’s record. Here’s their graph for 2017 so far:

DMI-meanT_2017-12-06


[Edit – December 10th]

Current Arctic sea ice area and extent derived from the University of Hamburg’s high resolution AMSR2 data:

UH-Arctic-Area-2017-12-09

UH-Arctic-Extent-2017-12-09

Plus the latest update on the Chukchi Sea situation:

UH-Chukchi-Area-2017-12-09


[Edit – December 20th]

Wipneus has released his mid month PIOMAS update for December:

piomas-trnd4-2017-12-15

PIOMAS-thk-dec152017

The Chukchi Sea is now mostly covered in sea ice, as is the Kara Sea. Volume is still 3rd lowest behind 2016 and 2012.

Whilst on the subject of sea ice thickness a related subject is sea ice age. Here’s a new paper on that topic:

A new tracking algorithm for sea ice age distribution estimation

Note that these assorted sea ice age maps are all for January 1st 2016!

Figure-6-Comparison-of-SIA-for-the-1-Jan-2016-calculated-with-the-following-combinations

Watch this space!

The 2017 Arctic Sea Ice Maximum Extent

It’s far too early to be sure about this yet, but it’s not beyond the bounds of possibility that the 2017 maximum is already in place. Here’s our favourite high resolution extent graph calculated by “Wipneus” from University of Hamburg/JAXA AMSR2 data:

UH-Arctic-Extent-2017-02-21

The current maximum Arctic sea ice extent for 2017 is 13.49 million square kilometers on February 19th. Here’s Arctic sea ice area for good measure:

UH-Arctic-Area-2017-02-21

The current maximum area for 2017 is 12.88 million square kilometers on February 20th. Here also is the NSIDC’s 5 day averaged extent:

charctic-20170221

This reveals a current maximum extent for 2017 of 14.302 million square kilometers on February 20th.


[Edit – March 1st]

Here are the high resolution AMSR2 area and extent graphs for the end of February:

UH-Arctic-Area-2017-02-28

UH-Arctic-Extent-2017-02-28

With each day that passes the highs of February 19th/20th look more likely to have been this years maximum. Nonetheless past experience suggests it’s still far to soon to be sure about that.


[Edit – March 10th]

Arctic sea ice area and extent are declining again, having reached new heights for the year on March 3rd:

UH-Arctic-Extent-2017-03-09

UH-Arctic-Area-2017-03-09

However the 2013/14 winter showed a late surge is still possible.


[Edit – March 18th]

A “late surge” is looking increasingly unlikely. That being the case, here is our provisional long term graph of NSIDC daily Arctic sea ice extent:

NSIDC-Max-2017

Subject to an unanticipated “surge” the 2017 maximum of 14.447 million square kilometers occurred on March 5th.

JAXA extent has dropped steeply over the last couple of days, and it is now once again “lowest for the date since records began”:

JAXA-Extent-20170317

The 2017 JAXA maximum of 13.878 million square kilometers occurred on March 6th.

In the continuing absence of updates to Cryosphere Today area, here’s the high resolution Arctic sea ice area graph calculated by “Wipneus” from University of Hamburg/JAXA AMSR2 data:

UH-Arctic-Area-2017-03-18

The maximum for that particular metric was 13.03 million square kilometers on March 3rd.

Watch this space!

Facts About the Arctic in February 2017

The PIOMAS Arctic sea ice volume numbers for January 2017 have just been published. Yet another new record low for the date:

PIOMASIceVolumeAnomaly-201701

Here’s the PIOMAS gridded thickness for January 31st, courtesy of Wipneus at the Arctic Sea Ice Forum:

PIOMAS-20170131

Somewhat anomalously it shows the thickest ice some distance away from the coast of Greenland and/or Ellesmere Island. Here too is Andy Lee Robinson‘s updated PIOMAS “Arctic death spiral”:

arctic-death-spiral-1979-201701

Meanwhile yet more anomalously warm air is entering the Arctic Basin from both the Pacific and Atlantic sides:

CCI-T2Anom-20170204

That sort of thing has happened quite a few times over the 2016/17 freezing season, as you can see from this graph of cumulative Freezing Degree Days (FDD for short):

2017-02-03-DMI-FDD

The FDD graph is based on the same data as the probably much more familiar DMI “Daily mean temperatures for the Arctic area north of the 80th northern parallel” graph:

DMI-meanT-20170203

Things are warming up in the Arctic once again.


[Edit – February 5th]

Whilst we await the arrival of the forecast anomalous warmth, how are some other metrics coming along? Here’s the high resolution AMSR2 area and extent:

UH-Arctic-Area-2017-02-04

UH-Arctic-Extent-2017-02-04

It looks like they’re back in the “normal” range for now, does it not?


[Edit – February 6th]

Things currently still look fairly frosty over on the Pacific side of the Arctic, as you can see from the webcam at Utqiagvik (Barrow as was):

BarrowCam_20170206_225400

However over on the Atlantic side (and especially for “Richard”!) melting can now be observed on Svalbard:

isfjordradio-20170206

An extremely powerful cyclone off Greenland is pumping heat and moisture northwards:

Synopsis-20170206-18Z

Note that the cyclone’s MSLP fell to 940 hPa earlier today. This is the GFS precipitable water forecast for Wednesday lunchtime:

CCI-PWTR-20170206-12+48h

Finally, for the moment at least, here’s the current weather forecast for Longyearbyen in Svalbard:

2017-02-07-Longyearbyen-Fcst

All in all there’s plenty more heat and moisture on the way.


[Edit – February 13th]

The temperatures in Svalbard have now dropped back below freezing point:

Svalbard-Temps-20170213

As temperatures over parts of the Arctic Basin have reached zero degrees Celsius and above, Arctic sea ice extent has been declining:

UH-Arctic-Extent-2017-02-12

Now take a look at area:

UH-Arctic-Area-2017-02-12

Area has declined a lot! That’s because sea ice concentration is now noticeably <100% across much of the Arctic:

Bremen-AMSR2-20170212

There’s also been a discernable change in slope of the DMI freezing degree days graph:

DMI-FDD-20170213


[Edit – February 19th]

There’s been a late spurt of growth in both area and extent, which are now back in the pack of previous years:

UH-Arctic-Area-2017-02-18

UH-Arctic-Extent-2017-02-18

The newly frozen areas are currently still very thin:

SMOS-20170218

Meanwhile northern hemisphere snow cover has started to melt in earnest:

multisensor_4km_nh_snow_extent_20170218

Watch this space!

Global Sea Ice Extent Reaches Lowest *Ever Level

Here once again is the up to date version of Wipneus’ graphic graphic, this time of global sea ice extent:

nsidc_global_extent_20170114

As you can see, global sea ice extent has just reached the lowest ever level in the National Snow and Ice Data Center’s satellite records going back to 1979. It was over a month later when the previous record was broken in February 2016, so there is plenty of time for the metric to fall further.

The 2017 curves in the NSIDC’s own extent graphs are coloured in a pale shade of blue. Even so they’re easy to pick out since both Antarctic and Arctic extent are at the lowest level for the date in NSIDC’s records by a considerable margin:

Chantarctic-20170115

Charctic-20170115

Antarctic sea ice extent is still falling, and the Arctic has been flatlining for several days now and more trouble is heading its way. Another Fram Strait cyclone is brewing, and this time around the storm’s minimum central pressure is already down to 957 hPa according to Environment Canada:

Synopsis-20170116-12Z

According to the current forecasts it will continue to spin over the central Arctic for several more days, driving export of sea ice via the Fram Strait:

ACNFS sea ice drift forecast for January 20th 2017

* In NSIDC satellite records going back to 1979

The 11th Key Science Moment of 2016

A brief history of scientific “churnalism” in the age of social media. The “post-truth” of The Guardian’s 11th Key Science Moment of 2016.

On November 7th 2016 we broke this astonishing news on Twitter:

Nobody noticed! Then on November 16th 2016 Zack Labe did likewise:

The story got some legs. Zack got pushback from some “skeptics” and then the AGU blogged about the story.:

My attention was called to this issue last week thanks to the Twitter feed of Zack Labe, a PhD student in Earth Systems Science at the University of California – Irvine. He makes great graphics showing the latest data on polar climate.

Then he got interviewed by the AGU. The AGU linked back to the graphic graphic in question in the clouds at Google, but there was no mention of our November 6th article or the real source of the story. The Arctic Sea Ice Forum (ASIF for short).

It’s now December 18th, and as far as I’m aware that remains the case in the mainstream media (MSM for short). The Arctic Sea Ice Forum grew out the earlier Arctic Sea Ice Blog (ASIB for short). The proprietor of both the ASIB and ASIF has been revealed by CBC to be one Neven Curlin. They recently interviewed Neven, and even gave him top billing above Sir David Attenborough in the resulting podcast:

‘Like watching a train wreck’: Blogger quits writing about climate change

However the title of the CBC article is inaccurate, as CBC would surely have noticed if they’d read Neven’s article on the ASIB on the topic of his “sabbatical”.

Sabbatical (I hope)

Now comes news that the “astonishingly low level” of global sea ice area that we brought to the waiting world’s attention on November 7th has today been chosen by The Guardian as one of their:

12 key science moments of 2016

The story outlined above and the associated graphic graphic are conspicuous only by their absence, but the Grauniad have thoughtfully provided this pretty stock photo of some sea ice:

Scroll down the Guardian’s article to number 11, pausing to read Tamsin Edwards’ section on atmospheric carbon dioxide levels at number 9 on the way down (unlike CO₂ concentrations). There you will discover Professor Andrea Sella’s opinion that:

In October, unprecedented weather patterns drove icy winds across Siberia, pushing Arctic temperatures up to 20C above normal and parts of the Arctic Ocean failed to refreeze; in the Antarctic, sea ice thawed faster than usual. For me the bombshell came from a Dutch blogger in late November: a plot of the Arctic plus Antarctic showed sea ice this autumn to be tracking 4m km2 (the size of western Europe) below the normal average. This is a 7-sigma event – with a chance of about one in a hundred billion of being random. The ice doesn’t lie. If we don’t take this seriously now, our children will ask us why.

The “plot of the Arctic plus Antarctic” Andrea refers to was created by “Wipneus”, who I suppose could reasonably be described as a “Dutch programmer”. Neven could reasonably be described as a blogger, although he is much more than that. Although he was born in The Netherlands he no longer lives there.

Here’s the current state of play:

nsidc_global_area_20161215-400

Are your children asking “Why?” yet?

Should anybody wish to pose that question on Twitter please see:

New Calving of the Zachariae Isstrom Glacier

The Zachariæ Isstrøm glacier in North East Greenland is in the news at the moment. Here’s a recent article from The Guardian for example, which states that:

A major glacier in Greenland that holds enough water to raise global sea levels by half a metre has begun to crumble into the North Atlantic Ocean, scientists say. The calving of the glacier into chunks of floating ice will set in train a rise in sea levels that will continue for decades to come, the US team warns.

“Even if we have some really cool years ahead, we think the glacier is now unstable,” said Jeremie Mouginot at the University of California, Irvine. “Now this has started, it will continue until it retreats to a ridge about 30km back which could stabilise it and perhaps slow that retreat down.”

Mouginot and his colleagues drew on 40 years of satellite data and aerial surveys to show that the enormous Zachariae Isstrom glacier began to recede three times faster from 2012, with its retreat speeding up by 125 metres per year every year until the most recent measurements in 2015.

The same records revealed that from 2002 to 2014 the area of the glacier’s floating shelf shrank by a massive 95%, according to a report in the journal Science. The glacier has now become detached from a stabilising sill and is losing ice at a rate of 4.5bn tonnes a year.

Eric Rignot, professor of Earth system science at the University of California, Irvine, said that the glacier was “being hit from above and below”, with rising air temperatures driving melting at the top of the glacier, and its underside being eroded away by ocean currents that are warmer now than in the past.

“The glacier is now breaking into bits and pieces and retreating into deeper ground,” he said. The rapid retreat is expected to continue for 20 to 30 more years, until the glacier reaches another natural ledge that slows it down.

The Guardian article includes a picture of Zachariæ Isstrøm, along with much of the rest of North East Greenland. Here it is again, together with a helpful annotation revealing the location of the calving face of Zachariæ Isstrøm in amongst all the snow and ice:

zach-guardian

That’s still not really much help when it comes to visualising the “retreat speeding up by 125 metres per year”, so here’s a closer look at Zachariae Isstrom using an image prepared by Espen Olsen for the Arctic Sea Ice Forum, which is based on a Landsat 8 satellite image from September 2014:

Retreat of the calving face of the Zachariae Isstrøm glacier between 2009 and 2015

North East Greenland is in the dark at the moment, but if you want to take a closer look at recent changes to Zachariæ Isstrøm for yourself you can do so with the aid of NASA’s EOSDIS Worldview web site, which allows you to scroll through images from both the Aqua and Terra satellites. Here’s one from August 26th 2015:

NASA Worldview “true-color” image of the Zachariae Isstrøm glacier on August 26th 2015, derived from the MODIS sensor on the Aqua satellite

Our headline for today announces that yet another large chunk of ice has just detached itself from Zachariæ Isstrøm. You may wonder how we can be so sure of that when it’s dark in North East Greenland? That’s because yet another satellite can “see” in the dark, using synthetic aperture radar. Here’s an animation prepared earlier today by “Wipneus” using data from the European Space Agency’s Sentinel 1A satellite, once again for the Arctic Sea Ice Forum:

Animated comparison of Sentinel 1A visualisations of the Zachariae Isstrøm calving face on 4th and 16th November 2015

Can you spot “The new iceberg [that] seems to lie on its side”?

The conclusion to all this frantic activity, according to Mouginot, Rignot et al. at least, is that:

The Zachariæ Isstrøm / Nioghalvfjerdsfjorden sector is one of three major marine-based basins in Greenland along with the Jakobshavn Isbræ and Petermann–Humboldt glaciers, each holding a 0.6-m sea-level equivalent. Jakobshavn Isbræ started a rapid retreat (18 km in 2001-2015) following the collapse of its ice shelf and has undergone massive calving events since 2010. The central channel of the Petermann ice shelf lost 250 m of ice in 2002-2010, and the ice front retreated 33 km in 2010-2012. The Nioghalvfjerdsfjorden ice shelf will become vulnerable to break up in the near future if thinning continues. These observations combined suggest that all three major marine-based basins are undergoing significant changes at present. Jakobshavn Isbræ and Zachariæ Isstrøm have already transitioned to tidewater glacier regime, with increased calf-ice production and ice melting by the ocean. The retreat of these marine-based sectors is likely to increase sea-level rise from Greenland for decades to come.