Tag Archives: SII

Trump’s Climate Cuts Affect the NSIDC

I frequently post a summary of the Arctic section of the United States’ National Snow and Ice Data Center’s monthly review of the current state of the cryosphere. Here is the most recent edition.

However, this month I have some additional bad news to report. According to a May 6th “Level of Service Update for Data Products” from the NSIDC:

Effective May 5, 2025, NOAA’s National Centers for Environmental Information (NCEI) will decommission its snow and ice data products from the Coasts, Oceans, and Geophysics Science Division (COGS).

As a result, the level of services for affected products below will be reduced to Basic—meaning they will remain accessible but may not be actively maintained, updated, or fully supported.

If you rely on these products in your work, research, education, or planning, we invite you to share your story at [email protected]. Your input can help us demonstrate the importance of these data sets and advocate for future support.

I will certainly share my story with the NSIDC. If you are a resident of the US you may also wish to contact your local friendly neighbourhood politician(s) about the matter?

[Update – May 9th]

Mark Serreze, Director of the National Snow and Ice Data Center, replied to my email and told me that:

We are acutely aware of the importance of the SII and Sea Ice Today.  Millions of visits per year.  High priority. We’re in the middle of discussions about to make sure that we have continuity.

Thanks for your support.  Everything helps.

One of the less well known data products provided by the NSIDC is EASE-Grid Sea Ice Age.

I recently used that particular mine of essential cryospheric information to produce this educational YouTube video:

The video reveals the underlying reason for the “fast transition” of Arctic sea ice cover from thick multi-year ice to a reduced area of much more mobile young ice.

To be continued…

Clutz Clutches at Minimum Extent Straws

On several previous occasions “Snow White” and I have documented Ron Clutz’s misuse of MASIE Arctic sea ice extent data on his “Science Matters” blog. We agree with Ron that science matters, so on several occasions we have attempted to direct his attention to my interview with NASA/NSIDC scientist Walt Meier. Walt’s words of wisdom included:

Year-to-year comparisons and trend estimates will be more accurate in the passive microwave data than in MASIE.

It will probably not surprise you to learn that Ron has not learned anything from our repeated efforts. In his article entitled “2024 Arctic Ice Beats 2007 by Half a Wadham” earlier today Ron proudly displays this graph:

You will note that Ron does not provide details of his data source. However I have recently noted a sudden lack of SSMIS passive microwave data emanating from NOAA. The OSI SAF reported it this way on September 12th:

Dear OSI SAF Sea Ice Concentration User,

Due to missing input data, we have not been able to generate L2 products, corresponding to F-16 / F-17 / F-18 since Sep 11 19:36 UTC.

We apologize for any inconvenience.

The NSIDC’s sea ice home page puts it this way today:

Now day 260 of 2024 is September 16th, so it seems safe to assume that Ron is erroneously using his favourite MASIE metric for year to year comparisons yet again. In his article Ron states that:

SII was reporting deficits as high as 0.5M km2 (half a Wadham) compared to  MASIE early in September.  For some reason, that dataset has not been updated for the last five days.

It appears as though Ron has also not yet learned how to find NSIDC’s sea ice home page on the world wide interweb!

I added this hopefully helpful comment below Ron’s article. For some strange reason it is yet to emerge from his moderation queue:

[Update – September 18th]

Our regular reader(s) will not be surprised to learn that my helpful comment yesterday is no longer in Ron’s moderation queue, but is now languishing underfoot on his cutting room floor.

Ron has written another Arctic article using the graph reproduced above. This one is entitled: “2024 Arctic Ice Abounds at Average Daily Minimum“. In it Ron assures his flock of faithful followers that:

We are close to the annual Arctic ice extent minimum, which typically occurs on or about day 260 (mid September). Some take any year’s slightly lower minimum as proof that Arctic ice is dying, but the image above shows the Arctic heart is beating clear and strong.

Over this decade, the Arctic ice minimum has not declined, but since 2007 looks like fluctuations around a plateau.

Ron has also changed his phraseology regarding the recent SSMIS data outage. This time it reads:

For some reason, apparently data access issues, that dataset has not been updated for the last five days.

“Snow White” felt compelled to leave Ron another helpful comment concerning his new words of Arctic wisdom:

Watch this space!

The 2017 Arctic Sea Ice Maximum Extent

It’s far too early to be sure about this yet, but it’s not beyond the bounds of possibility that the 2017 maximum is already in place. Here’s our favourite high resolution extent graph calculated by “Wipneus” from University of Hamburg/JAXA AMSR2 data:

UH-Arctic-Extent-2017-02-21

The current maximum Arctic sea ice extent for 2017 is 13.49 million square kilometers on February 19th. Here’s Arctic sea ice area for good measure:

UH-Arctic-Area-2017-02-21

The current maximum area for 2017 is 12.88 million square kilometers on February 20th. Here also is the NSIDC’s 5 day averaged extent:

charctic-20170221

This reveals a current maximum extent for 2017 of 14.302 million square kilometers on February 20th.


[Edit – March 1st]

Here are the high resolution AMSR2 area and extent graphs for the end of February:

UH-Arctic-Area-2017-02-28

UH-Arctic-Extent-2017-02-28

With each day that passes the highs of February 19th/20th look more likely to have been this years maximum. Nonetheless past experience suggests it’s still far to soon to be sure about that.


[Edit – March 10th]

Arctic sea ice area and extent are declining again, having reached new heights for the year on March 3rd:

UH-Arctic-Extent-2017-03-09

UH-Arctic-Area-2017-03-09

However the 2013/14 winter showed a late surge is still possible.


[Edit – March 18th]

A “late surge” is looking increasingly unlikely. That being the case, here is our provisional long term graph of NSIDC daily Arctic sea ice extent:

NSIDC-Max-2017

Subject to an unanticipated “surge” the 2017 maximum of 14.447 million square kilometers occurred on March 5th.

JAXA extent has dropped steeply over the last couple of days, and it is now once again “lowest for the date since records began”:

JAXA-Extent-20170317

The 2017 JAXA maximum of 13.878 million square kilometers occurred on March 6th.

In the continuing absence of updates to Cryosphere Today area, here’s the high resolution Arctic sea ice area graph calculated by “Wipneus” from University of Hamburg/JAXA AMSR2 data:

UH-Arctic-Area-2017-03-18

The maximum for that particular metric was 13.03 million square kilometers on March 3rd.

Watch this space!

Satellite Problems With Arctic Sea Ice Measurement

Skeptical sorts across the cryoblogosphere are in meltdown mode at the moment. They seem to be unaware that satellites don’t last forever in the harsh environment of space, and the individual scientific instruments carried by a satellite don’t either. Some failures are more spectacular than others however. By way of illustration here’s one recent report from Space.com:

The February [2015] explosion of an American military satellite may cause some problems for orbiting spacecraft after all, a new study reports.

The U.S. Air Force’s 20-year-old Defense Meteorological Satellite Program Flight 13 (DMSP-F13) craft blew apart on Feb. 3 after experiencing a power-system faillure. Analyses by the European Space Agency and other organizations found that the cloud of space junk generated by the explosion shouldn’t pose much of a threat to their missions, but the new research suggests that not all spacecraft are in the clear.

Another DMSP satellite started pushing up the metaphorical daisies earlier this year. Last month Space Flight Now reported that:

The U.S. Air Force has been unable to send commands to the service’s newest weather satellite for nearly a month, and engineers are trying to determine if the spacecraft can be salvaged, officials said last week.

The polar-orbiting Defense Meteorological Satellite Program Flight 19, or DMSP F19, spacecraft stopped responding to orders from the ground Feb. 11, the Air Force said in a March 3 press release.

“At this time, it is not known what caused the anomaly or if the satellite will be recovered, and the anomaly is under investigation,” the Air Force said. “There are no other known issues with the satellite.”

Designed for a five-year service life, DMSP F19 launched April 3, 2014, from California atop a United Launch Alliance Atlas 5 rocket. It is the newest in the Air Force’s series of DMSP weather observatories designed to help forecasters predict storms, clouds, fog and dust storms that could inhibit global military operations.

The data provided by the Special Sensor Microwave Imager/Sounder (SSMIS) instrument carried aboard several of the DMSP series of satellites is used by the National Snow and Ice Data Center to calculate their Sea Ice Index metric of Arctic sea ice extent. However suddenly Boulder has a problem. As we reported earlier this week the SSMIS sensor carried by DMSP F17 appears to be malfunctioning. This can be seen in this visualisation of the data from the European Ocean and Sea Ice Satellite Application Facility(OSI-SAF):

nt_20160409_f17_nrt_n

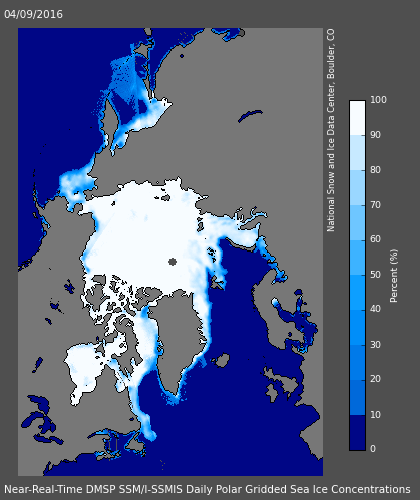
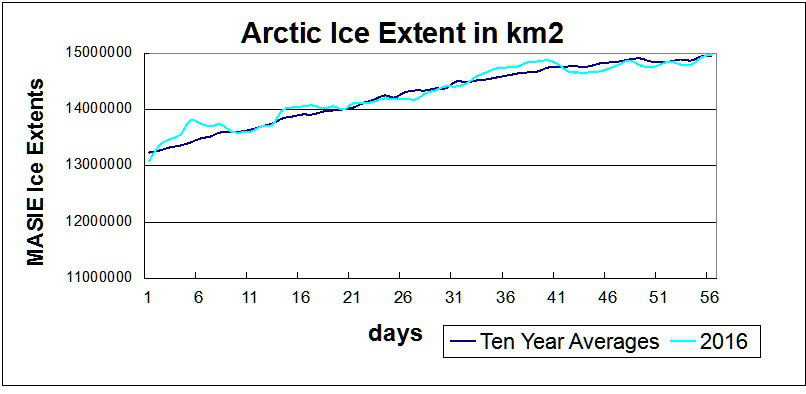
Look closely at the top centre of the image to see a large patch of spurious “sea ice”. Here’s the resulting SII extent graph from the NSIDC:

NSIDC_NH_20160410

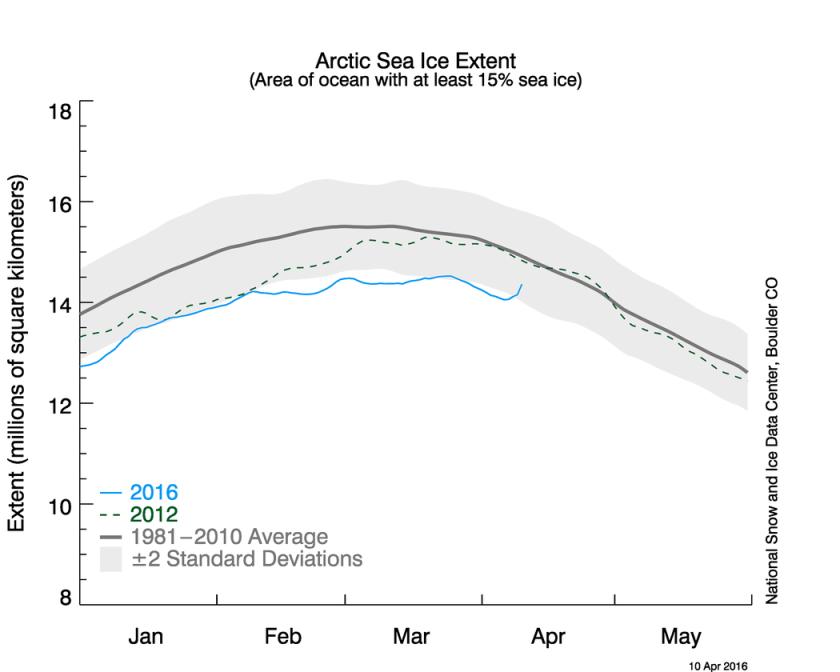
Anthony Watts reported this news in typically fanciful fashion:

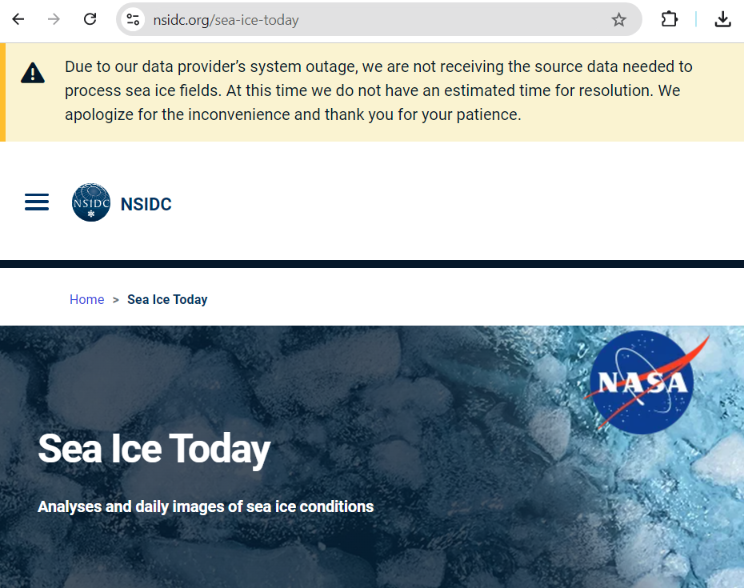
There is this small notice on the NSIDC page:

“The daily sea ice extent images are currently displaying erroneous data. NSIDC is investigating.”

It looks to be a problem with the DMSP F17 satellite.

Makes you wonder how long this has been going on and if the anomalously low readings we’ve seen for awhile are due to a slow sensor degradation.

Time will tell.

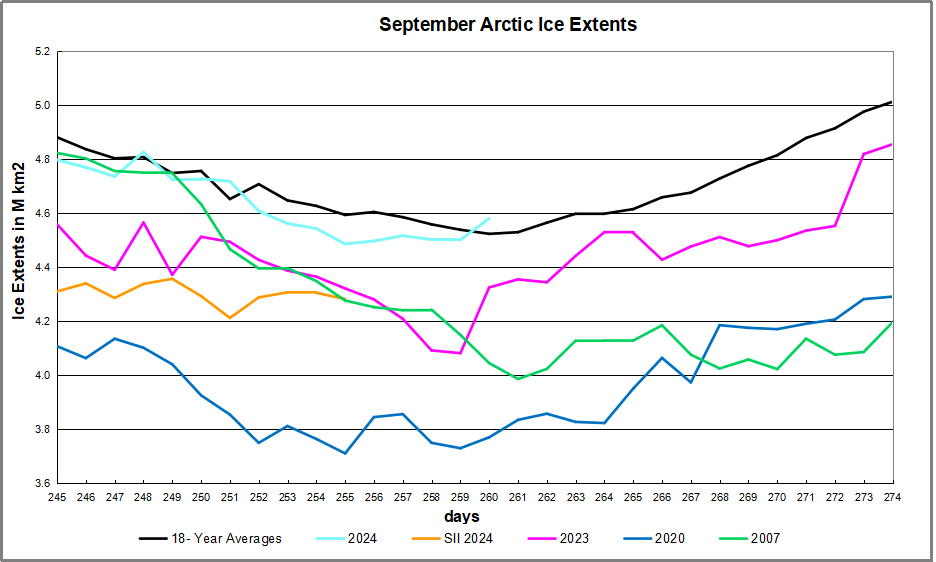
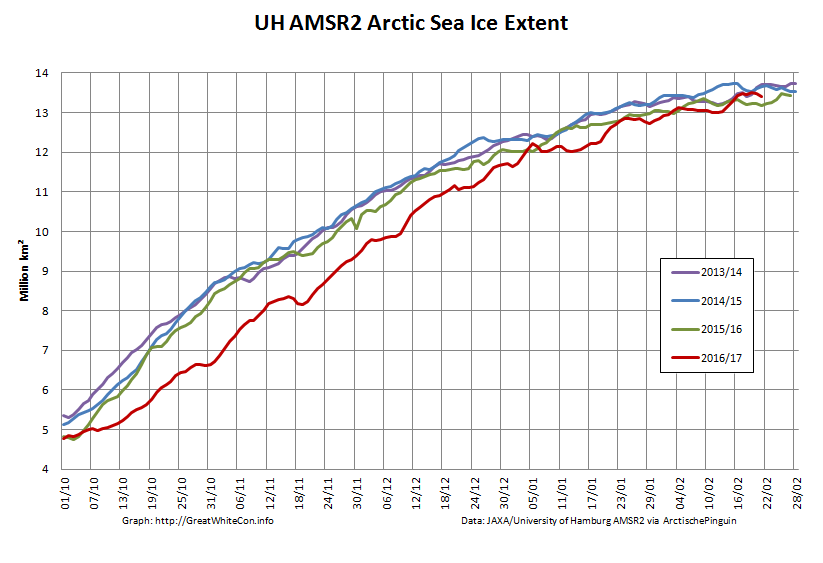
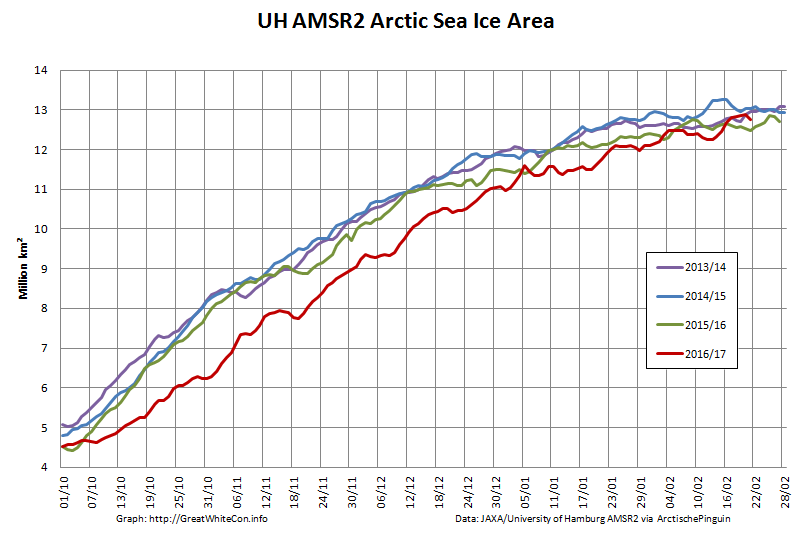
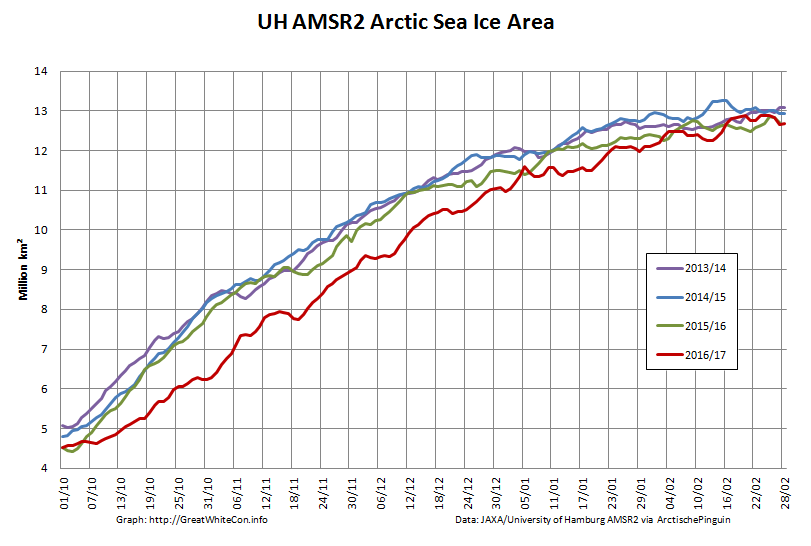
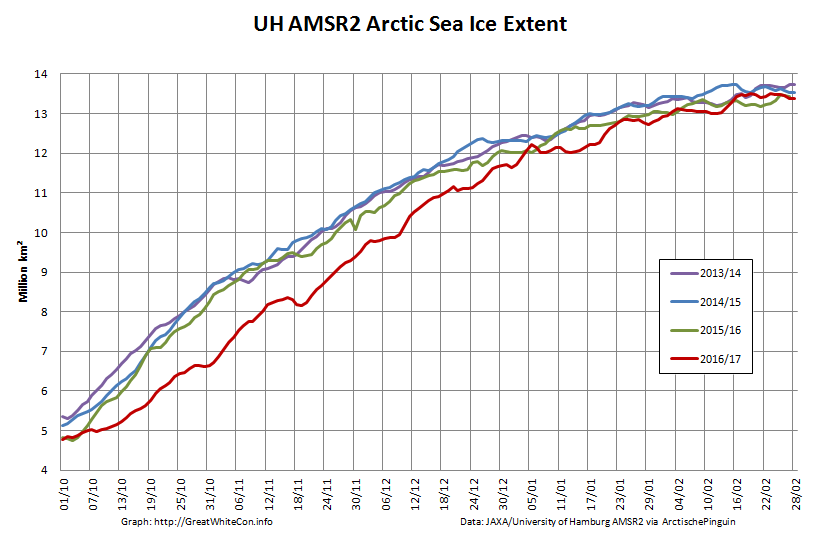
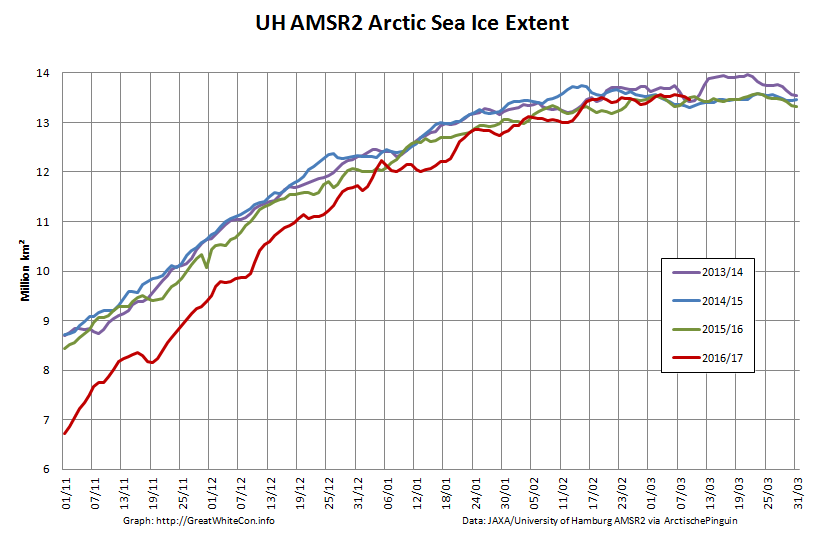
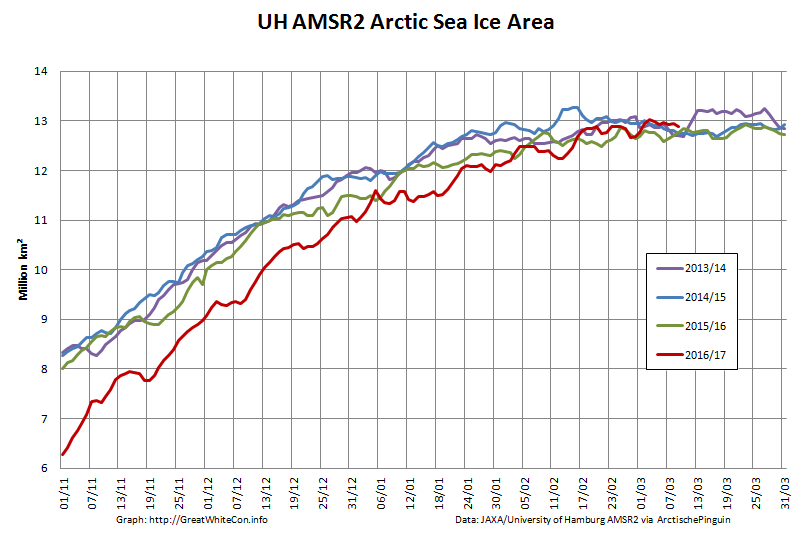
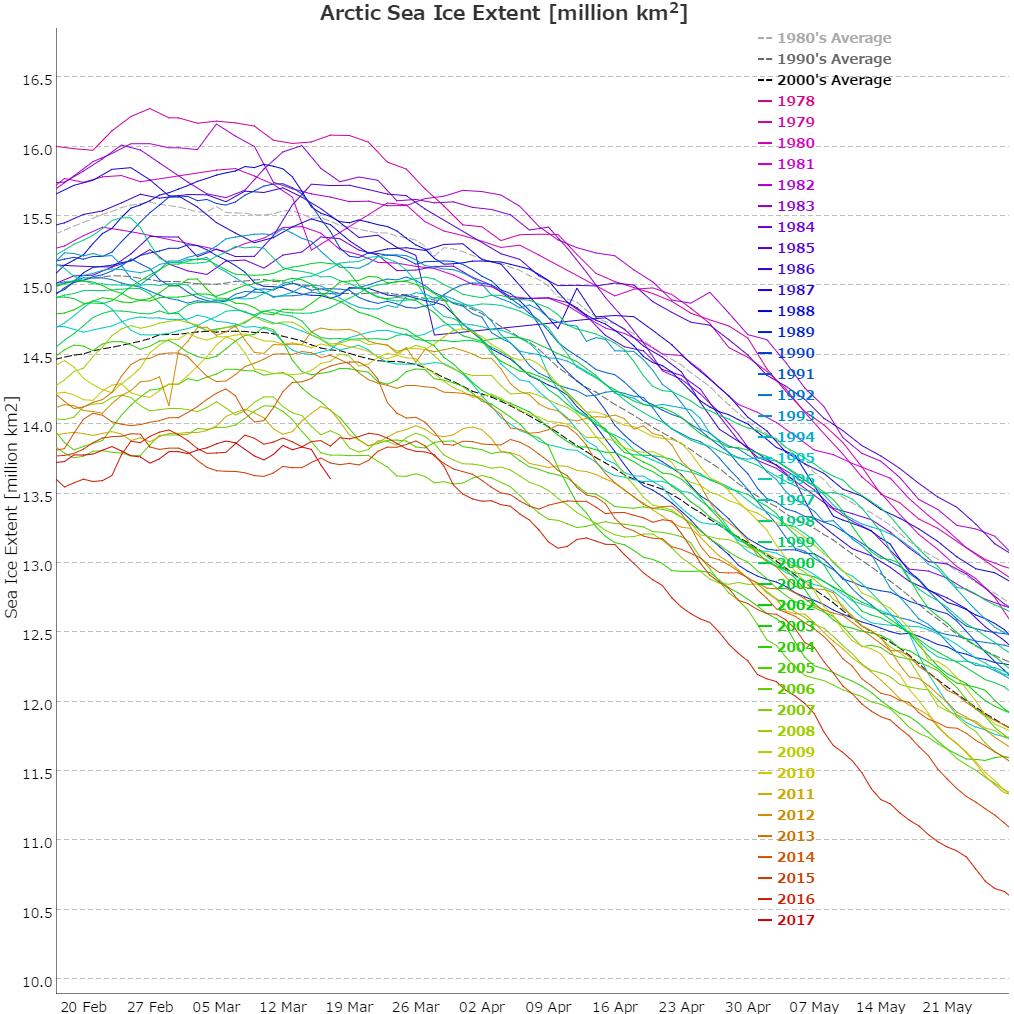
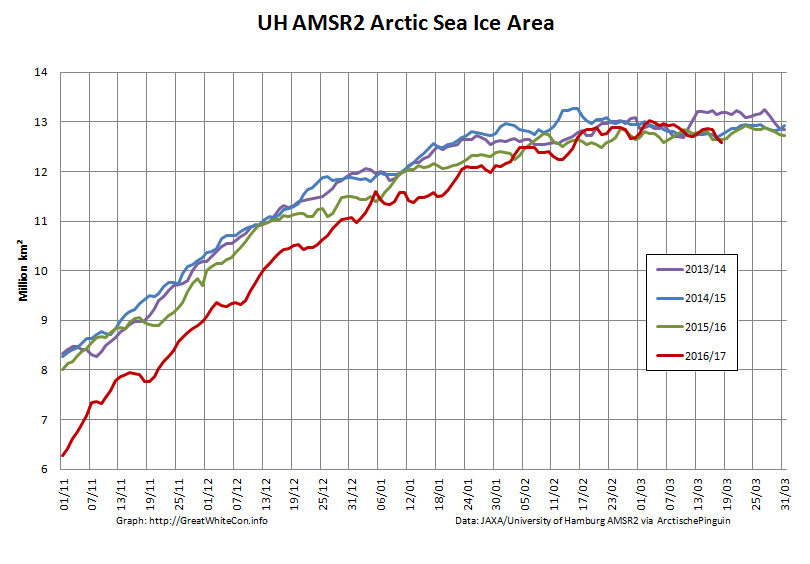
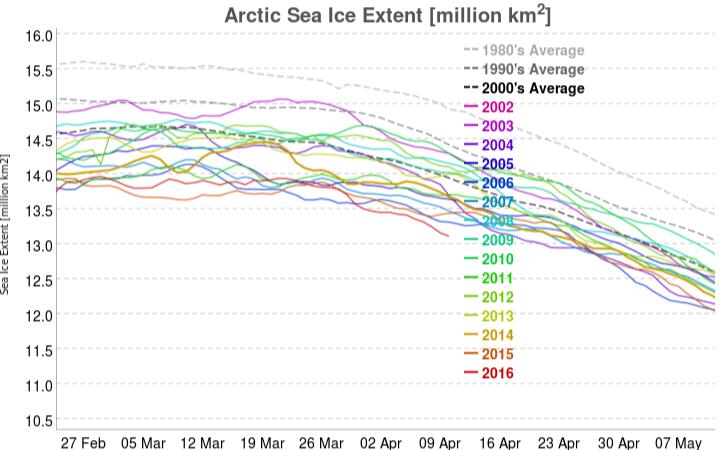
For a more realistic interpretation of the facts we suggest that instead of reading the propaganda perpetrated at WUWT you instead examine this graph derived using data from the AMSR2 sensor on board the Japanese SHIZUKU satellite:

JAXA-20160410

Mr. Watts evidently takes a very US centric view of these matters, since he neglected to report this timely news bulletin from the OSI-SAF:

Due to the previously reported problems with one of the channels on SSMIS onboard DMSP F17, OSI SAF is now working on replacing DMSP F17 with DMSP F18 in our sea ice products.

Currently, the switch to F18 has been implemented for the ice concentration product (OSI-401). The product dated 20160410 has been reprocessed and is available on our FTP server, ftp://osisaf.met.no/prod/ice/conc/ and ftp://osisaf.met.no/archive/ice/conc/2016/04

The ice edge and type products (OSI-402 and OSI-403) will be updated to use F18 tomorrow, 2016-04-12.

It seems Willis Eschenbach, the current Watts Up With That resident sea ice expert, is already beavering away endeavouring to prove Anthony’s case for him:

We have no way to know if this has been a gradual decrease followed by a failure, so yes, it’s certainly possible that the previous data is bad. Doesn’t mean it is, but we’d be fools not to check.

We suggested a simple check:

Why not compare the NSIDC’s SSMIS data from F-17 with JAXA’s AMSR2 data from Shizuku? Wouldn’t that do the trick?

Willis replied:

I meant that just from the bad reading alone, we don’t know if the previous data is bad. Yes, we can check it in the way you suggest and other ways … which is why I said we’d be fools not to check.

We think that if he does his due diligence he will find that he is in actual fact engaged on a fool’s errand, but time will indeed tell. Let’s wait and see what Willis n Willard can come up with, shall we? Meanwhile we also cannot help but wonder what the dynamic duo might make of our own due diligence replicating the results of another collaboration of theirs:

“The Awful Terrible Horrible Arctic Sea Ice Crisis”

Gross Deception About MASIE and the Sea Ice Index

Our title for today is a reference back to a 2015 article by Paul Homewood on his “Not A Lot Of People Know That” blog, in which he told a load of old porky pies about the National Snow and Ice Data Center’s graphs of Arctic sea ice extent. Only last week Mr. Homewood cooked up another pile of porky pies concerning the Danish Meteorolical Institute’s Arctic sea ice extent metric. Now he has turned his pie baking skills to the Multisensor Analyzed Sea Ice Extent (MASIE for short), which is “a prototype collaborative product of the National Ice Center and NSIDC”.

Mr. Homewood obviously hadn’t done a whole lot of homework on MASIE before firing up his porky pie production line, since he used the self same recipe posted on the so called “Science Matters” blog of Ron Clutz shortly before. In fact he just reprinted the first part of Ron’s article and added a handy link to Ron’s even bigger pile of porky pies beneath it. Hence both Paul and Ron’s web sites currently proudly proclaim that:

Something strange is happening in the reporting of sea ice extents in the Arctic. I am not suggesting that “Something is rotten in the state of Denmark.” That issue about a Danish graph seems to be subsiding, though there are unresolved questions. What if the 30% DMI graph is overestimating and the 15% DMI graph is underestimating?

The MASIE record from NIC shows an average year in progress, with new highs occurring well above the 2015 maximum:

Clutz-masie-2016-to-day-56r

While I am compelled to agree with Ron and Paul that “something strange is happening in the reporting of sea ice extents in the Arctic” we disagree about everything else! One reason for that is because only a few days ago I interviewed NASA scientist Walt Meier following a suggestion by Ron Clutz that I do precisely that. Please read the edited highlights of that interview, and note in addition that Walt assured me that he had not previously been contacted by either of Messrs. Clutz and Homewood. Having never previously contacted Mr. Meier, here’s what Ron Clutz would have his loyal readership believe this weekend:

NOAA Is Losing Arctic Ice

Why the Discrepancy between SII and MASIE?

The issue also concerns Walter Meier who is in charge of SII, and as a true scientist, he is looking to get the best measurements possible. He and several colleagues compared SII and MASIE and published their findings last October. The purpose of the analysis was stated thus:

Our comparison is not meant to be an extensive validation of either product, but to illustrate as guidance for future use how the two products behave in different regimes.

Here is what Dr. Meier’s peer reviewed paper from October last year concluded on the matter:

Operational modelers require timely data that are as accurate as possible to initialize forecast models. In particular, an accurate ice edge is important because of the influence of the interaction of sea ice and water with the overlying atmosphere on the model fluxes. Consistency of data is also desirable for operational models, but is a secondary concern because the models are regularly reinitialized for their synoptic forecasts. Operational observations like MASIE make the most sense for these applications. However, the quality and amount of information used to produce the operational analyses vary.

Climate modelers desire consistent long-term data to minimize model biases and better understand and potentially improve model physics. The passive microwave record is useful, but has limitations. Regions of thin ice are underestimated and if the ice cover is diffuse with low concentration, ice-covered regions may be detected as open water. Even thin ice modifies heat and moisture transfer and thus may affect atmospheric and oceanic coupling. Surface melt results in an underestimation of concentration. This should be considered when evaluating model concentrations with passive microwave data.

and here once again is what he told me a few short days ago:

Since the quantity and quality of [MASIE] data varies the time series will not be consistent over time.

For some strange reasom Mr. Clutz’s article mentions none of this. Needless to say I have attempted to bring this unfortunate oversight to the attention of Ron & Paul:

2016-02-28_1007-RonClutz

Even more unfortunately it seems that their joint acute snow blindness has got even worse over the last few days, since they still haven’t noticed my link to Walt Meier’s words waiting patiently in their WordPress.com “moderation queues”.

Whilst we wish them on their recovery from their painful ailment, here’s an alternative interpretation of the MASIE data:

MASIE-Min

Operational modellers for the use of! Here’s what the NSIDC’s Sea Ice Index currently reveals to climate scientists:

Charctic-20160226

NSIDC Arctic sea ice extent is evidently still currently lowest *ever for the date.

DMI, MASIE and the Sea Ice Index – An Interview With Walt Meier

For some reason best known to himself Anthony Watts has jumped on the “DMIGate” bandwagon started by Paul Homewood over on this side of the Atlantic a few days ago. In his latest article Mr. Watts quotes with approval the “Not A Lot Of People Know That” article which we have already covered in some depth.

Here yet again is one of my comments that recently ended up on the NALOPKT cutting room floor:

2016-02-21_1811-NALOPKT

You will note that I was suggesting that Ron Clutz’s extremely selectively interpretation of some of Walt Meier’s academic papers left a lot to be desired. Particularly given the additional fuel added to the “skulduggery” fire by the Watts Up With That article it seemed sensible to phone up NASA and ask Walt for his views on the second hottest Arctic sea ice topic on the planet at the moment, according to Messrs. Clutz and Homewood at least. That is the relative merits of Multisensor Analyzed Sea Ice Extent (MASIE for short) versus the National Snow and Ice Data Center’s Sea Ice Index (SII for short) for determining Arctic sea ice trends.

According to the NSIDC:

MASIE sea ice products are developed from National Ice Center (NIC for short) data with support from the U.S. Navy and from NOAA. MASIE is hosted by NOAA@NSIDC.

whereas:

The Sea Ice Index provides a quick look at Arctic- and Antarctic-wide changes in sea ice. It is a source for consistent, up-to-date sea ice extent and concentration images and data values from November 1978 to the present.

As luck would have I managed to get through to Walt on my second attempt, and he graciously agreed to be interviewed at extremely short notice. He told me that whilst he now worked at NASA he used to be at the NSIDC, and still collaborated with them. Here are the edited highlights of his thoughts on “MASIE v SII”:

MASIE repackages data from the NIC, and incorporates an ice edge hand drawn by analysts working with whatever satellite data they have available at the time. It is an “operational” product designed to produce a “best effort” ice edge each day, based on whatever data may be available at the time.

Visual data is obviously not available in winter, and the ice edge is often obscured by clouds in summer. Synthetic Aperture Radar can “see in the dark” and through clouds, but suffers from different limitations. The whole of the Arctic isn’t covered every day for example. In addition, and unlike the SII, data from different satellite sensors is incorporated which means there are inevitably inconsistencies from day to day and from year to year. There is also an element of “human subjectivity” because different analysts are working with different sources of data from one day to the next. Since the quantity and quality of data varies the time series will not be consistent over time.

On the other hand the SII was designed to use a consistent methodology over a long period of time using a single type of sensor. 100% automatically processed passive microwave data is the “gold standard” when it comes to determining sea ice trends. It is subject to some biases and thus is not necessarily as accurate on a given day as MASIE. However, the biases are consistent over time, so the time series will be consistent over time. This means that year-to-year comparisons and trend estimates will be more accurate in the passive microwave data than in MASIE.

So there you have it. If you’re on the bridge of a vessel sailing in Arctic waters then MASIE is the right tool for the job. If on the other hand you’re sat in front of a computer trying to get the best estimate of trends in Arctic sea ice extent then the Sea Ice Index is what you’ll grab from your toolkit.

Having had a chance to examine the “evidence” of DMI “skulduggery” presented by Messrs. Watts and Homewood, Walt sent me a follow up email. Here is what it says:

Regarding DMI, the issue seems quite simple. The 30% plot is an older version that they stopped supporting as they transitioned to the 15% plot. I don’t know specifically why the 30% plot went awry, but there is generally automatic quality control done to make sure the final results are accurate and consistent. If such QC is not done, a lot of incorrect values can occur. I suspect that since the older version was no longer supported, the QC wasn’t being watched and something went wrong that they didn’t bother to fix (or maybe didn’t even notice) because the new 15% version is the official DMI output.

Not a lot of people know that, because Watts, Homewood et al. have developed the nasty habit of “snipping” comments to that effect as and when the mood takes them, which based on my own experience seems to be remarkably often in this day and age.