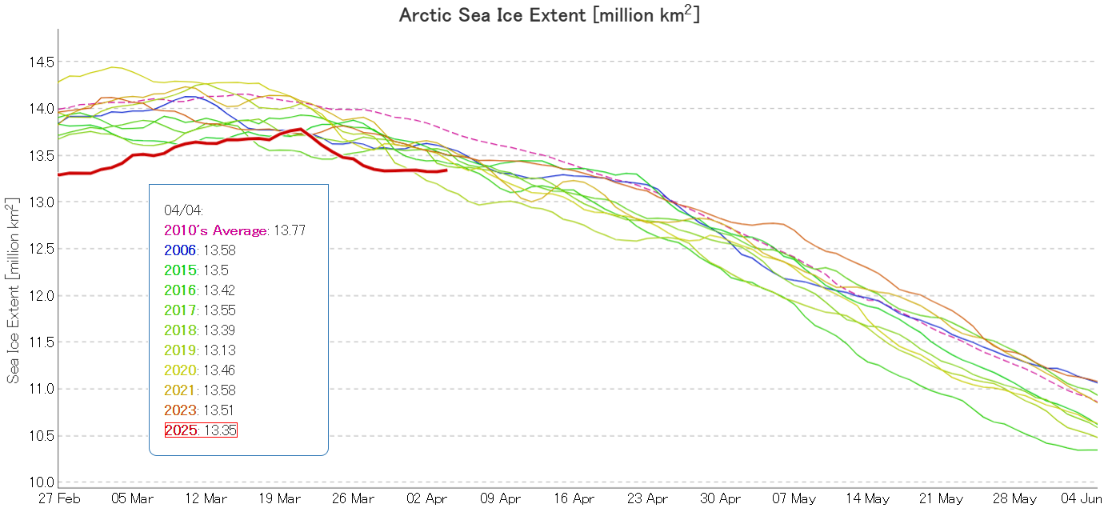
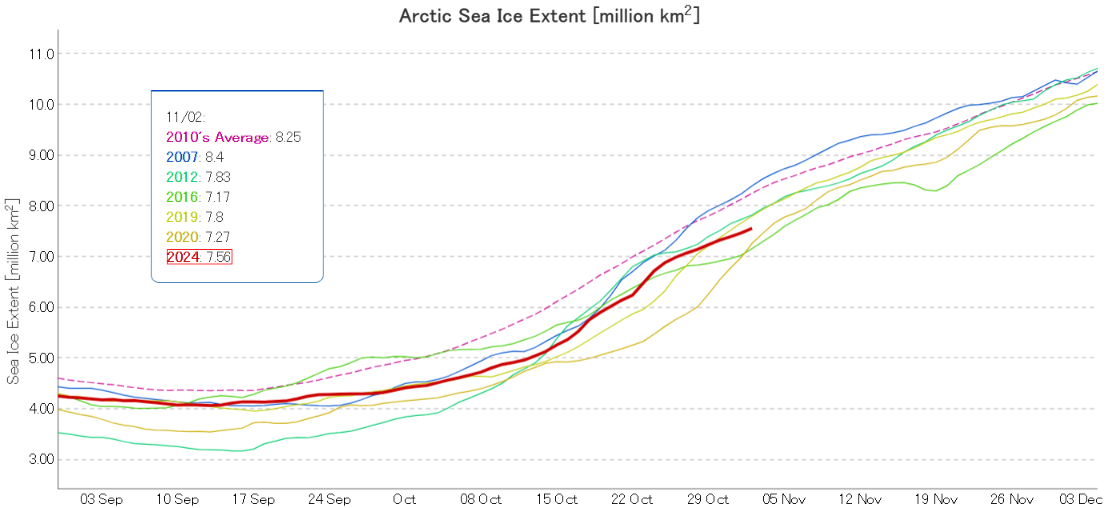
The Laptev and East Siberian Seas have now refrozen. Consequently Arctic sea ice extent is now increasing more slowly, and JAXA/ViSHOP extent is 3rd lowest for the date in the satellite era:
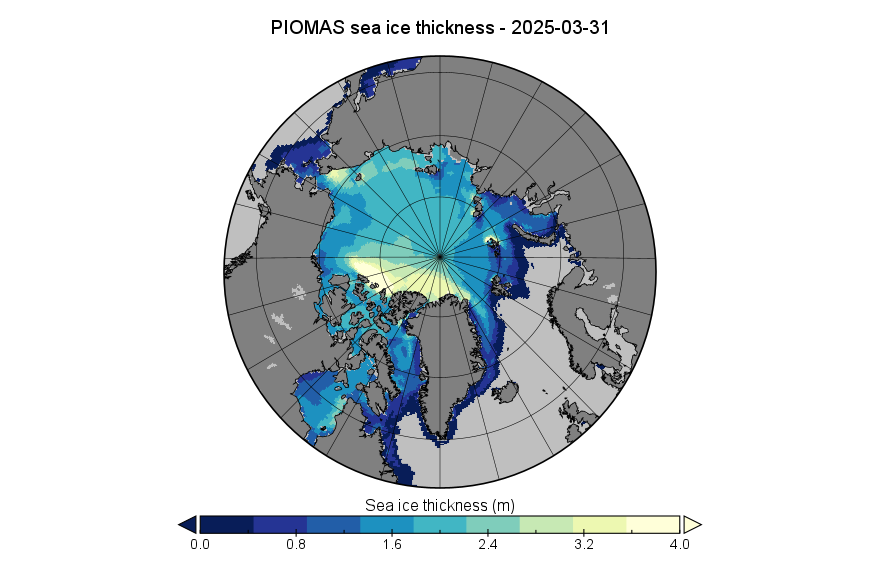
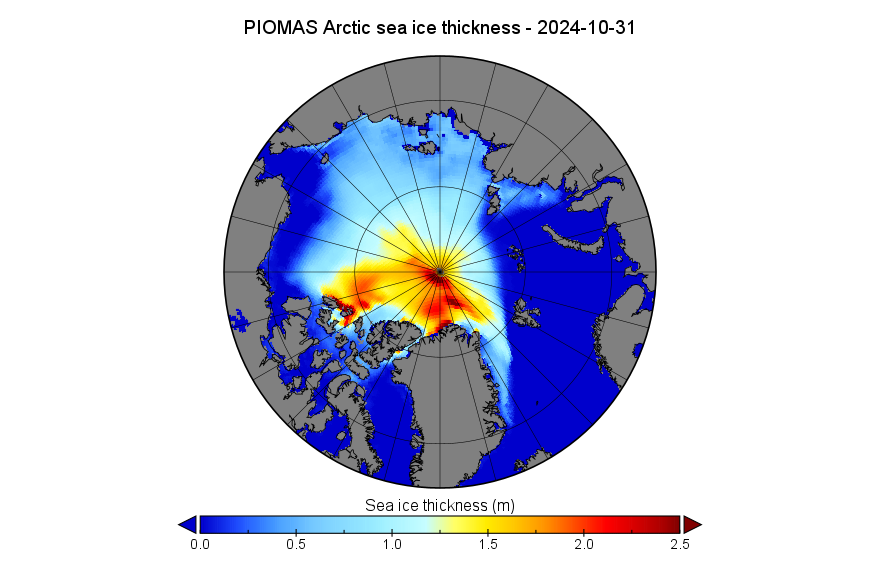
Note the change in scale from previous months, to allow for easier comparison with the “near real time” CryoSat-2/SMOS merged thickness data from the Alfred Wegener Institute:
A couple of years ago I was asked to provide “a handful of things [you] will be keeping an eye on over the next few months to judge how ‘good’ or ‘bad’ the melt is going?”
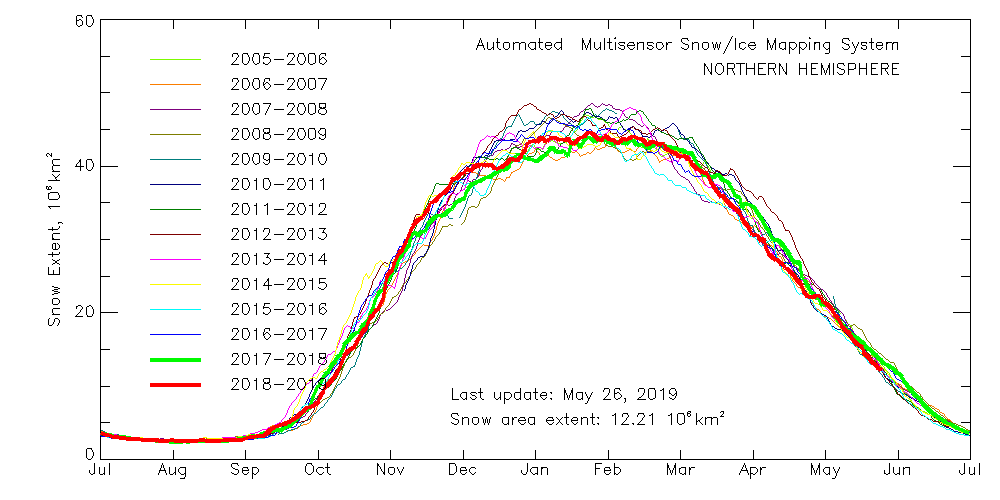
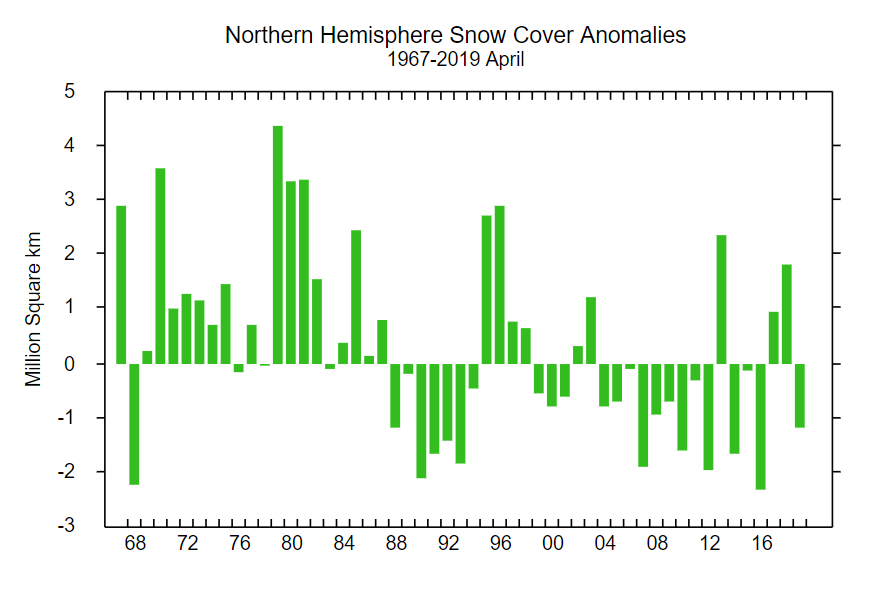
That suggests snow cover over land is close to recent lows, which is confirmed by the Rutgers University snow cover anomaly graph for April:
This year is anomalously low, but not by as much as 2012 and 2016. For completeness, here also is the current US National Ice Center snow cover map:
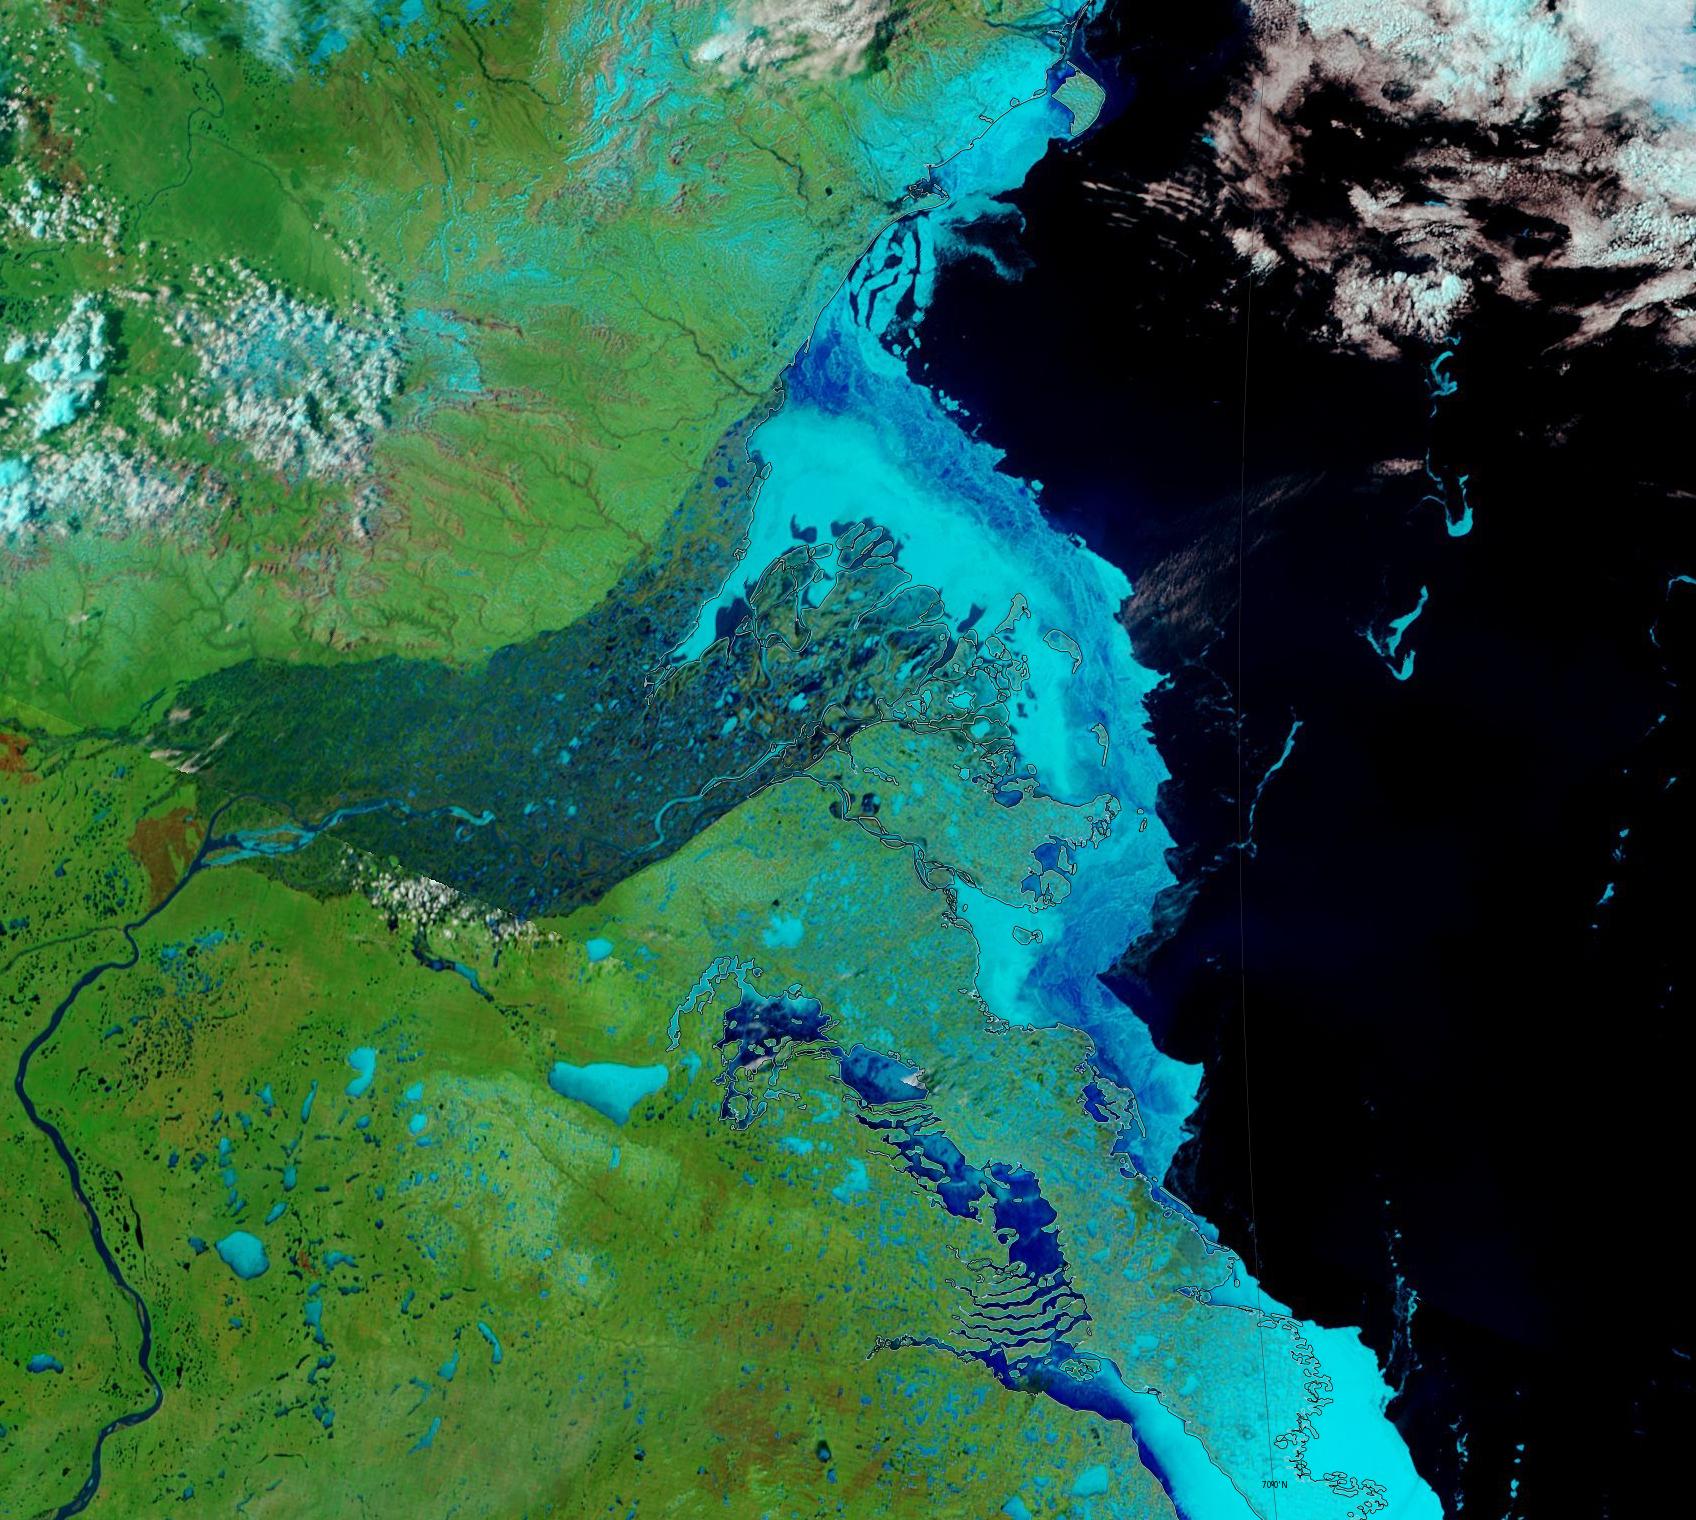
Moving on to melt ponds, there are plenty to be seen on the fast ice around the Mackenzie river delta:
NASA Worldview “false-color” image of the Mackenzie Delta on May 24th 2019, derived from the MODIS sensor on the Terra satellite
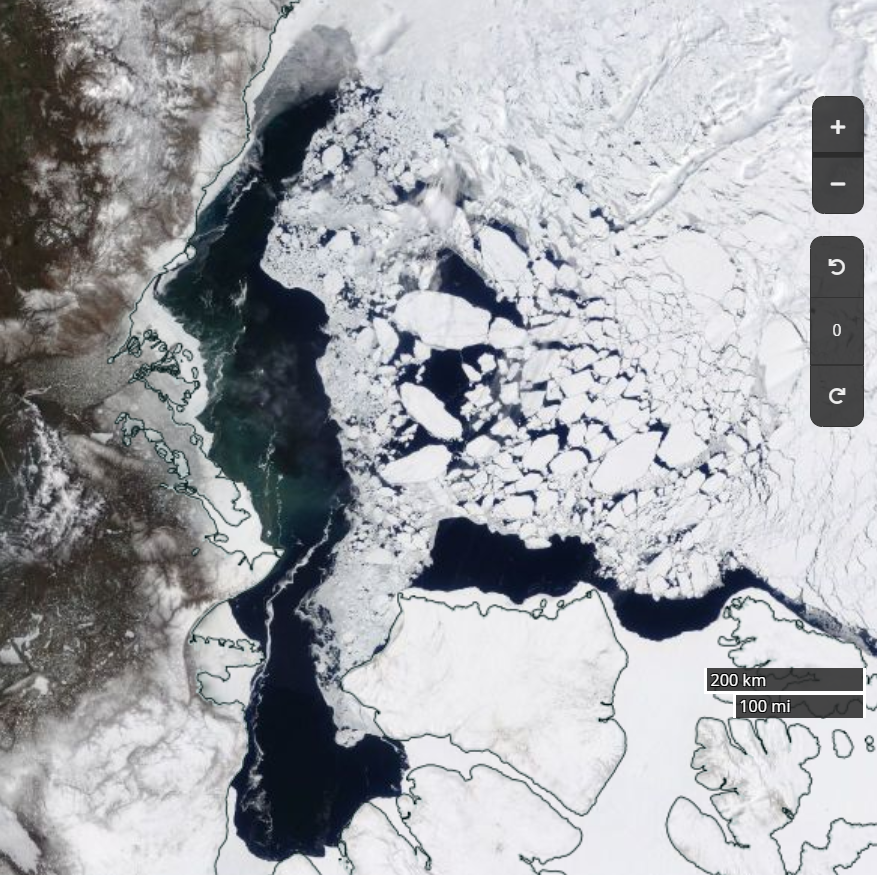
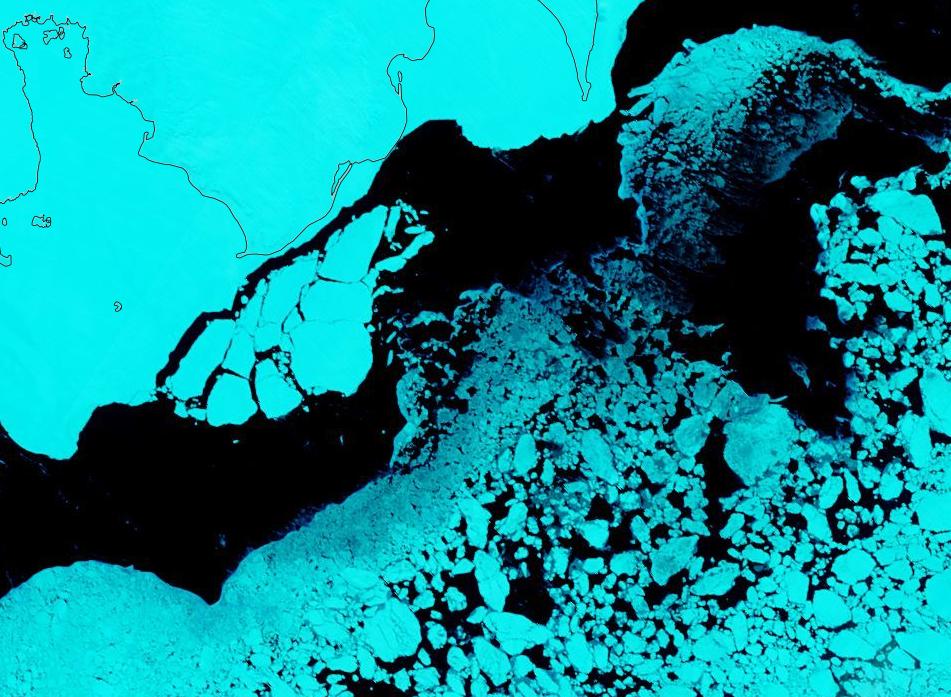
There also seem to be signs of some at a higher latitude off Ostrov Kotelny in the New Siberian Islands:
NASA Worldview “false-color” image of the Laptev Sea on May 23rd 2019, derived from the MODIS sensor on the Terra satellite
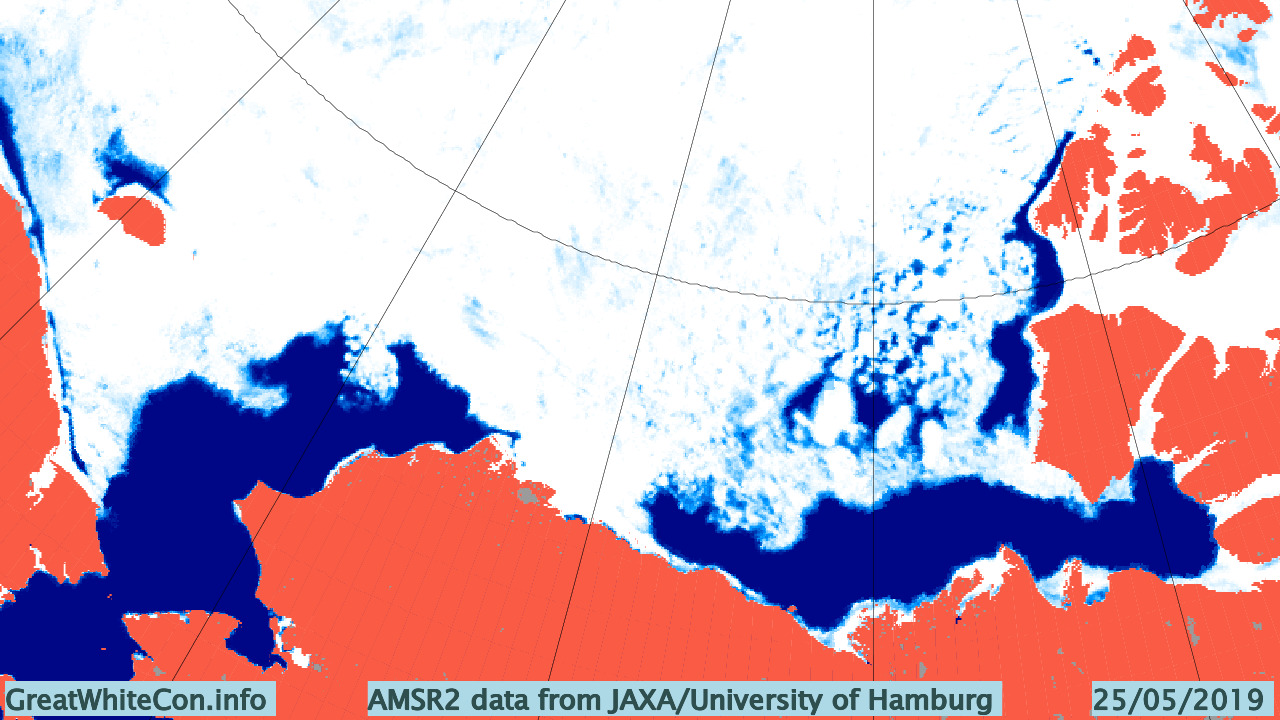
This year there is also a lot of open water in the Chukchi Sea, and almost no sea ice left in the Bering Sea:
Compared with 2016 at the same time of year I am compelled to say that with June 1st just around the corner the 2019 summer melting season is primed to progress more quickly.
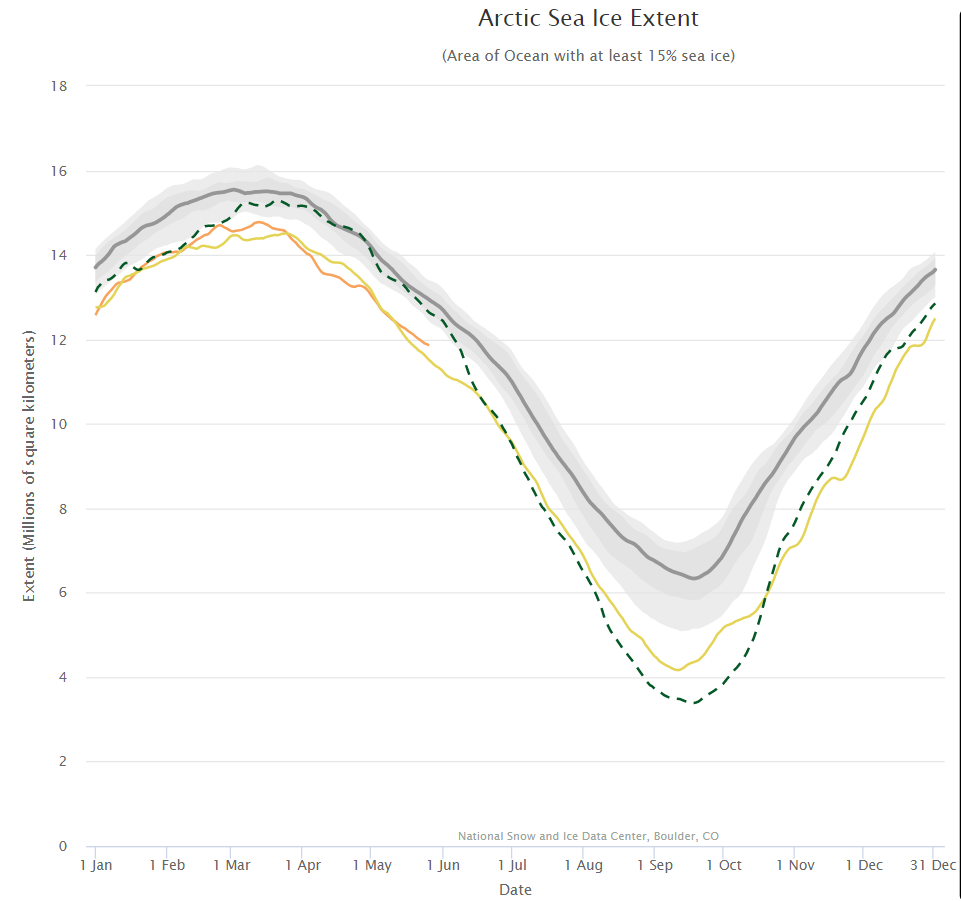
The next obvious comparison to make is with the (in)famous year of 2012, which resulted in the lowest ever minimum extent in the satellite record. Firstly let’s look at the National Snow and Ice Data Center’s graph of Arctic sea ice extent:
Currently extent is significantly below 2012, albeit somewhat above 2016 at the same time of year. And what of melt ponds? In 2012 there was evidence of less snow cover over land and more surface water on the ice on the Siberian side of the Arctic:
NASA Worldview “false-color” image of the Eastern Arctic on May 25th 2012, derived from the MODIS sensor on the Terra satellite
Other than that Arctic sea ice in 2019 looks to be in worse shape than in 2012.
[Edit – May 27th]
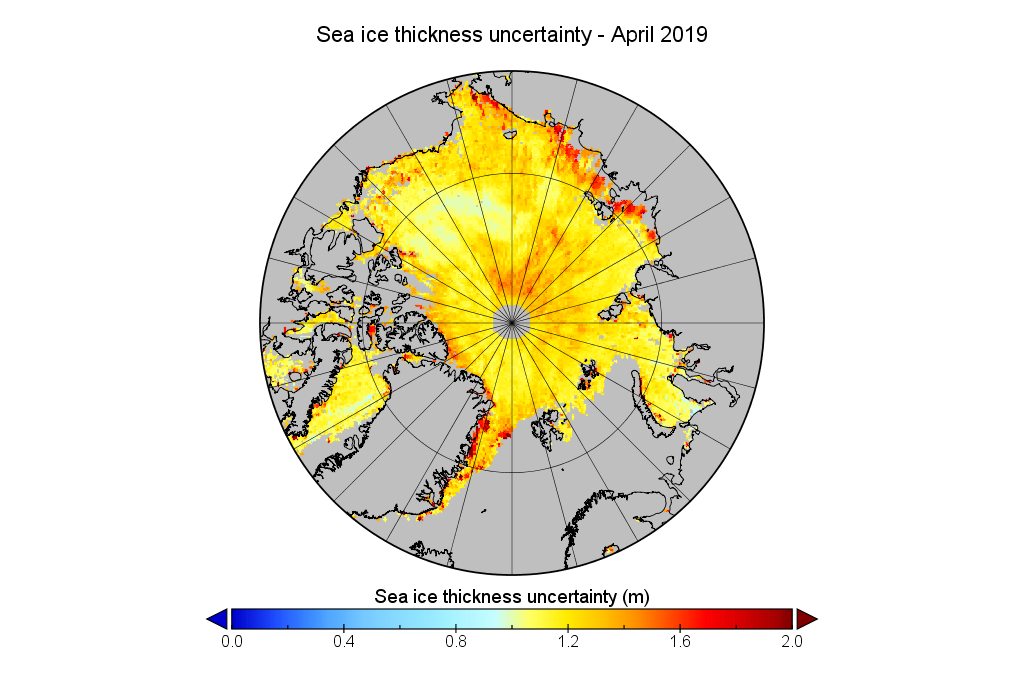
We’ve established that the extent of Arctic sea ice at the end of May 2019 is less than in 2012, but something else to consider is whether that ice is currently thicker than in 2012, or not. Satellites can have a reasonable stab at measuring the area of sea ice, but the third dimension is much trickier. The European Space Agency’s CryoSat-2 satellite has been attempting to measure sea ice thickness since 2010, so let’s take at the conclusions it has reached:
Don’t forget to take a good long look at the associated uncertainties too:
Our usual excuse for an article such as this is an attempt by a “pleasure craft” such as the plucky little yacht Northabout to journey past Russia’s northern shores. I’m not aware of any such plans for this year, but here is some interesting NSR 2018 news. According to Reuters:
A Maersk vessel loaded with Russian fish and South Korean electronics will next week become the first container ship to navigate an Arctic sea route that Russia hopes will become a new shipping highway.
The Arctic voyage by the 3,600 20-foot container capacity Venta Maersk is the latest step in the expansion of the so-called Northern Sea Route which is becoming more accessible to ships as climate change reduces the amount of sea ice.
The brand new Venta Maersk, one of the world’s largest ice-class vessels, will also collect scientific data, said Maersk, underlining that the voyage is a one-off trial for now.
The press release continues:
The decision by Maersk, the world’s biggest container shipping group, to test out the route is a positive sign for Russia, which hopes this could become a mini Suez Canal, cutting sea transport times from Asia to Europe.
“A well-respected company like Maersk sending a container ship through the Arctic, definitely signals there’s something there,” Malte Humpert, a senior fellow at U.S.-based think-tank Arctic Institute, said.
“Currently, we do not see the Northern Sea Route as an alternative to our usual routes. Today, the passage is only feasible for around three months a year which may change with time,” a spokeswoman for Maersk said.
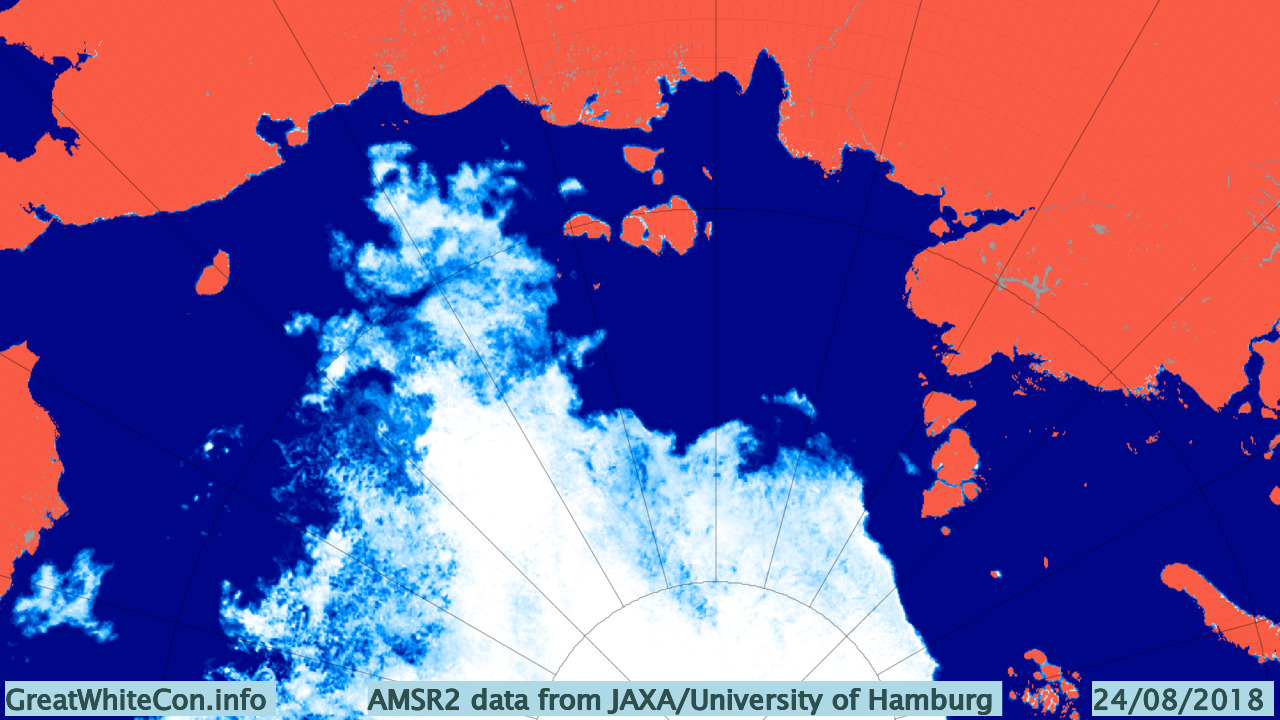
Here’s the sea ice situation that the Venta Maersk is heading for:
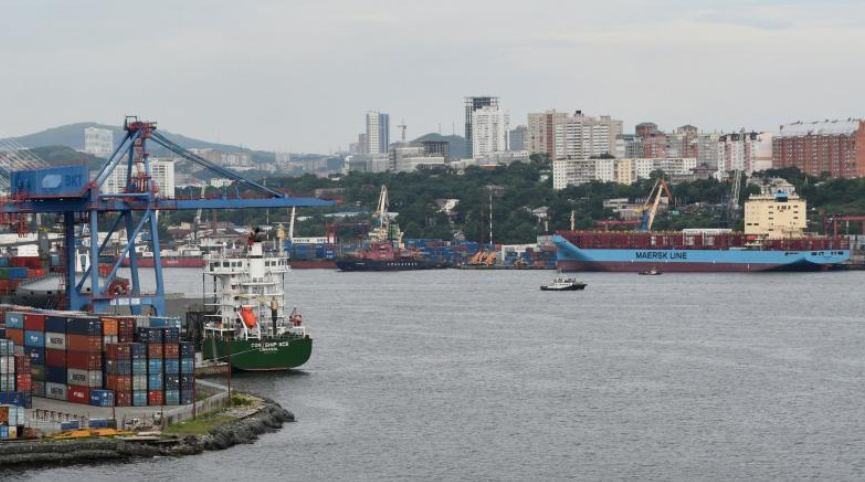
According to AMSR2 there’s still some sea ice quite close to shore in the East Siberian Sea. Meanwhile according to Marine Traffic the Venta Maersk has already left Vladivostok:
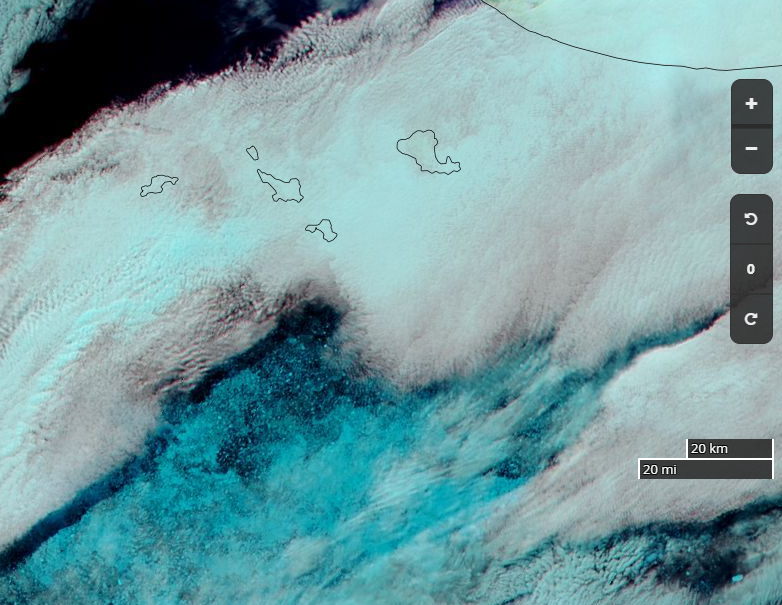
It will be a little while before she’s braving the dangers of the sea ice in the East Siberian Sea. Hopefully by that time we’ll have some clear satellite images at visual frequencies of anything solid in the path of all those containers. In the meantime here’s a glimpse through the clouds of the approximate ice edge on August 23rd:
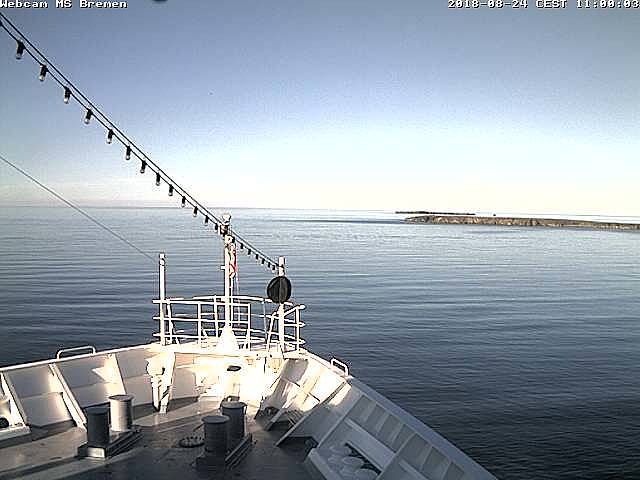
Meanwhile the Hapag Lloyd cruise ship Bremen is currently en route from Tromso to Nome via the Northern Sea Route. She is currently crossing the Laptev Sea heading for the ESS “choke point” from the opposite direction:
This website uses cookies to improve your experience. We'll assume you're ok with this, but you can opt-out if you wish. Cookie settingsACCEPT
Privacy & Cookies Policy
Privacy Overview
This website uses cookies to improve your experience while you navigate through the website. Out of these, the cookies that are categorized as necessary are stored on your browser as they are essential for the working of basic functionalities of the website. We also use third-party cookies that help us analyze and understand how you use this website. These cookies will be stored in your browser only with your consent. You also have the option to opt-out of these cookies. But opting out of some of these cookies may affect your browsing experience.
Necessary cookies are absolutely essential for the website to function properly. This category only includes cookies that ensures basic functionalities and security features of the website. These cookies do not store any personal information.
Any cookies that may not be particularly necessary for the website to function and is used specifically to collect user personal data via analytics, ads, other embedded contents are termed as non-necessary cookies. It is mandatory to procure user consent prior to running these cookies on your website.