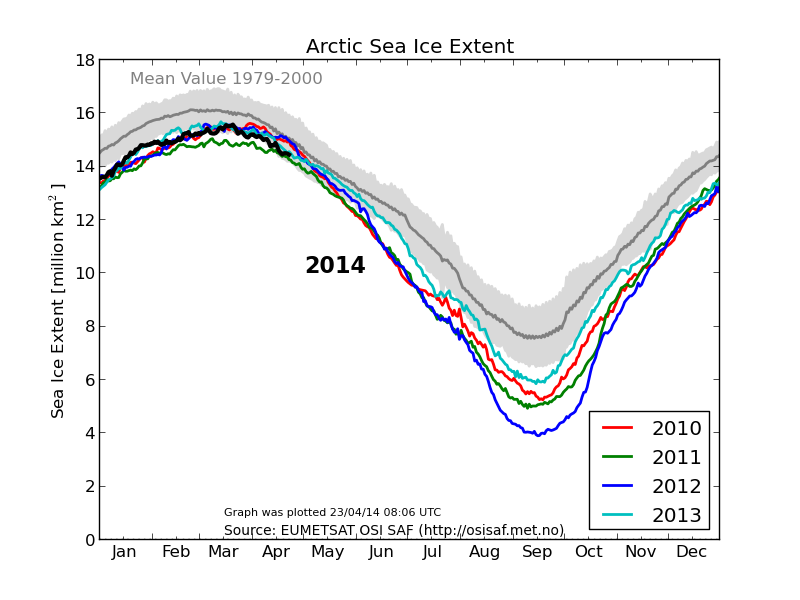
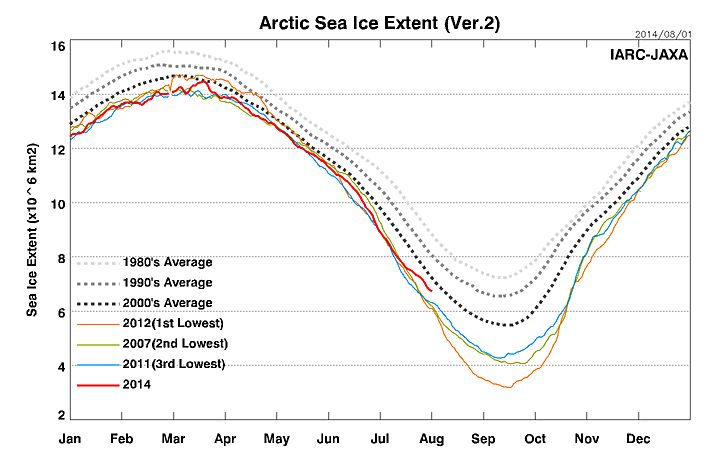
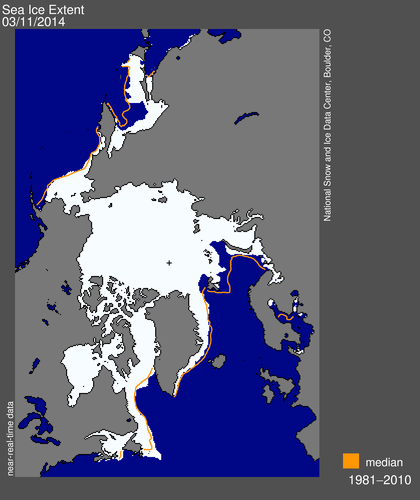
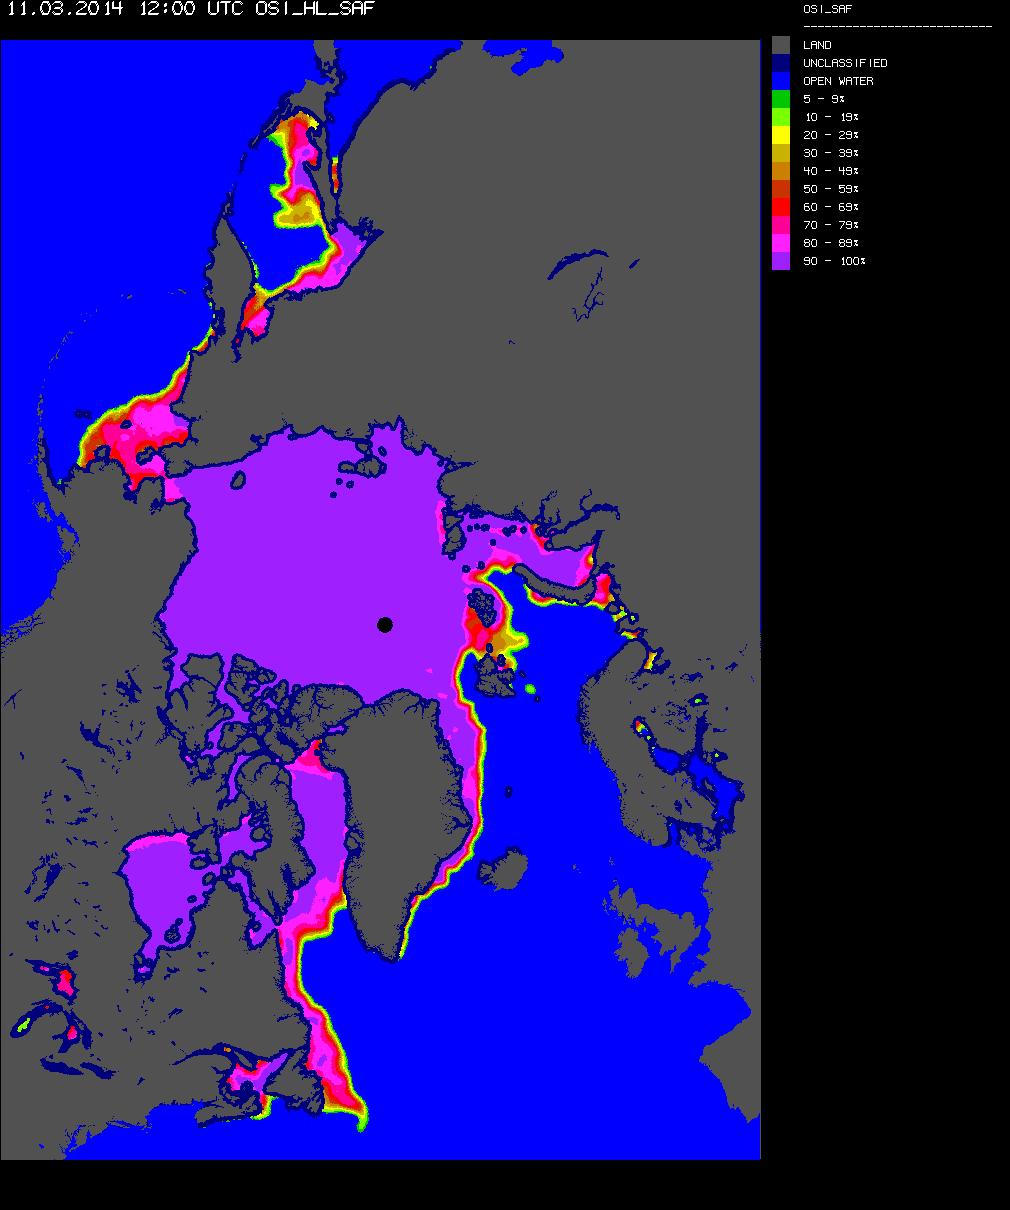
Over on the (un)Real Science blog this morning Steve/Tony proudly explains “Why Arctic Ice Extent Is Up Over 60% In The Last Two Years“.
Needless to say we are unimpressed by the following explanation:
Them:
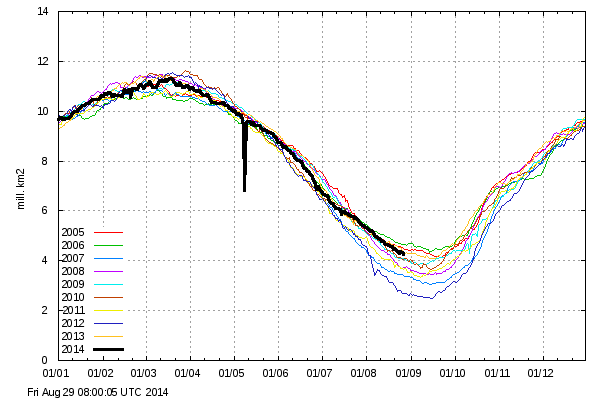
The Danish Meteorological Institute shows a 63% increase in Arctic sea ice extent since the same date in 2012, and an increase of 76% since the 2012 summer minimum. Current extent is 4.4 million km², up from 2.7 million km² on August 28, 2012.
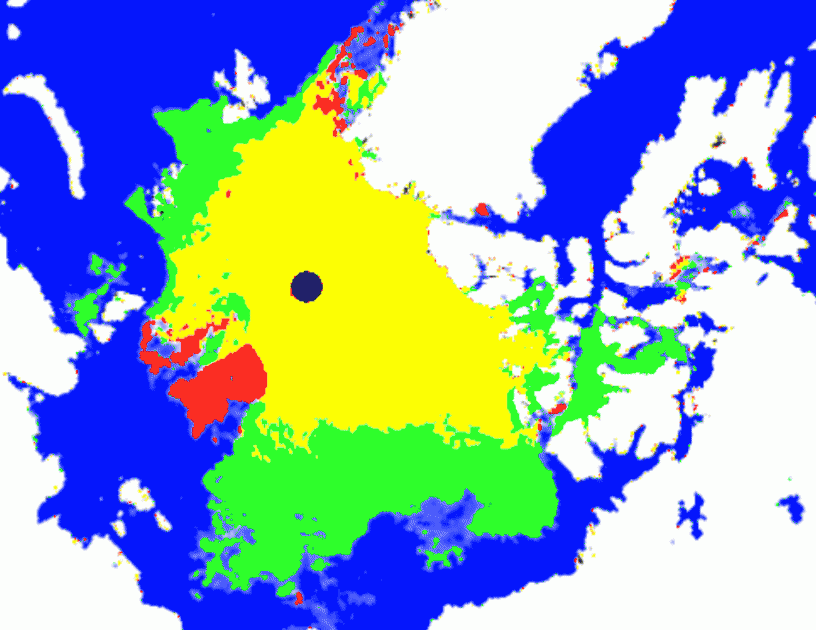
My methodology is similar numerically to DMI’s, I used maps from the Japan Aerospace Exploration Agency to generate the map below. Green shows ice gain since the same date in 2012, and red shows ice loss. My calculation shows a 64% increase in ice, almost identical to the calculations from DMI.
A favorite comment from alarmists is “the increase in ice extent is meaningless, because the ice is getting thinner“
They have it exactly backwards. The reason why ice extent is up, is because the ice is thicker.
Us:
At the risk of repeating myself:
@SteveSGoddard #Arctic #SeaIce coverage has shrunk by 1.6% over the last year, using your methodology at least. pic.twitter.com/VoBoJrhIQR
— Jim Hunt (@jim_hunt) August 28, 2014
Where’s your evidence that “the ice is thicker”? Thus far such evidence is conspicuous only by its absence in these hallowed halls.
Them:
Where’s your evidence that it isn’t?
Us:
At the risk of repeating myself repeating myself:
@SteveSGoddard There isn't much #Arctic #SeaIce left over 1.5 m thick! Here's the evidence: http://t.co/GXlLuwNyUe pic.twitter.com/cB02O73XY0
— Jim Hunt (@jim_hunt) August 14, 2014
Mind you I’m not the one proudly proclaiming “ice extent is up, because the ice is thicker.”. Steve/Tony is, but for some strange reason he provides visualisations of extent and age but not thickness!
Them:
Lets put it another way. Age of the ice is a proxy for ice thickness. But, if you don’t believe in proxies, just tell us.
Us:
Les – If you believe in proxies then PIOMAS Arctic sea ice volume for April 2014 was less than April 2012.
If instead you prefer the evidence of your own eyes then perhaps you can explain where all that red stuff in the Beaufort Sea in Steve/Tony’s animation has gone?
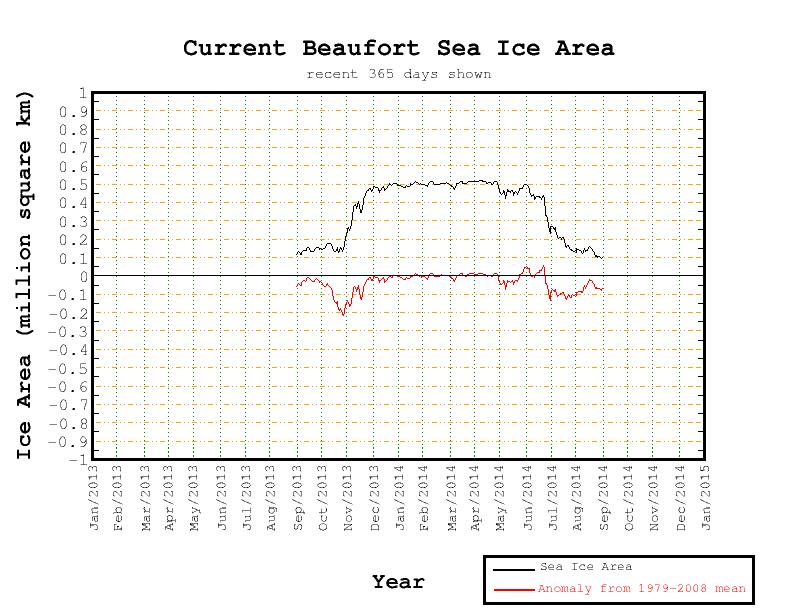
If “older, thicker ice is moving towards Alaska” then it looks like it’s melting there, not “accumulating”.
Them:
Mr. Hunt’s evidence…..
“NRL does not warrant or represent this INFORMATION is fit for any particular purpose,”
Us:
Anything/Gail/Sophie – Do you have any idea what this is?

Them:
Here’s a quick summary for people who aren’t following.
SG makes a post comparing 2012 and 2014. Jim argues with SG’s claim of thicker ice by comparing 2013 extent to 2014. When that gets called out, he shows the same silly 2014 plot that has no 2012 plot to compare to…still no valid comparison. After some back-and-forths and tangents, he brings up PIOMAS. When asked to compare thickness in PIOMAS 2012/2014, he avoids the question (twice).
Is there a single metric out there showing 2014 to be worse than 2012?
– Scott
Us:
Here’s a quick summary for you Scott:
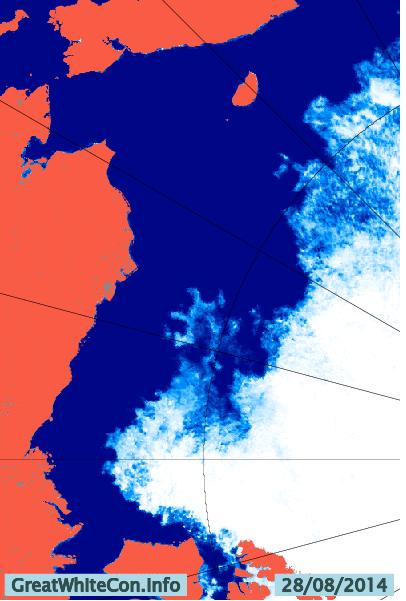
Where’s all the “older, thicker ice in the western Arctic” that SG keeps referring to hiding?
Them:
Nice image, Jim. You have chosen a metric. So that’s half the story. Where’s the 2012 equivalent of that image so we can see if SG is wrong about 2014 vs 2012?
-Scott
Us:
Thank you for your kind words Scott.
I haven’t “chosen a metric”. I have nonetheless already shown you one comparison with 2013, using TH’s very own “metric”. To complete the story, and at the risk of repeating myself once again, perhaps you can explain where all the “older, thicker ice accumulating on the Pacific side” that TH keeps referring to is hiding?
Them:
We’ll keep you Posted!