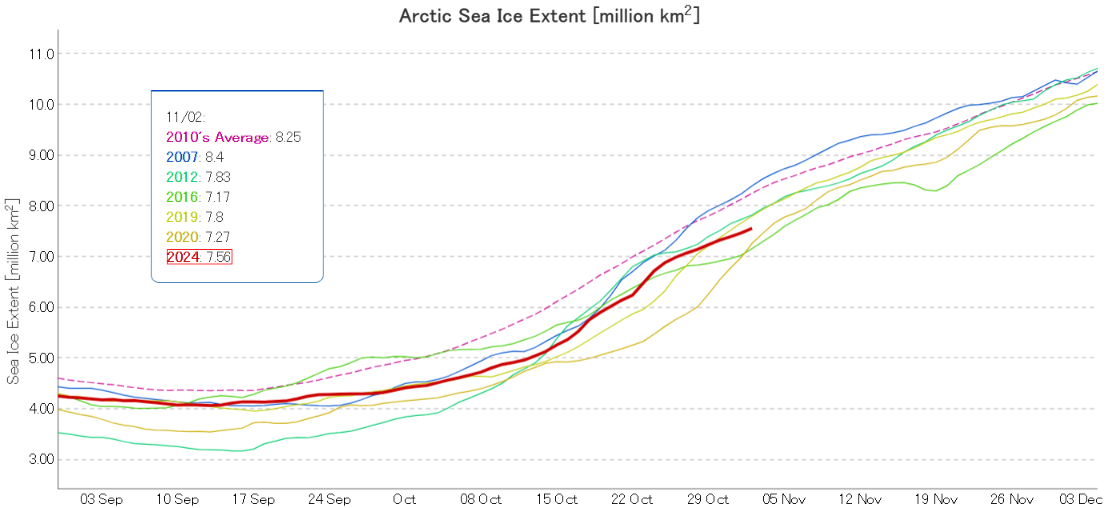
The Laptev and East Siberian Seas have now refrozen. Consequently Arctic sea ice extent is now increasing more slowly, and JAXA/ViSHOP extent is 3rd lowest for the date in the satellite era:
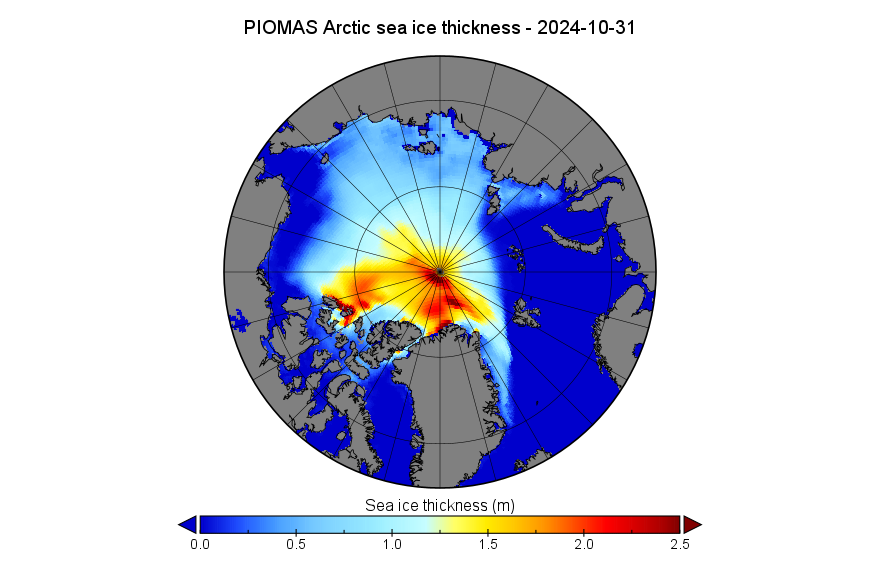
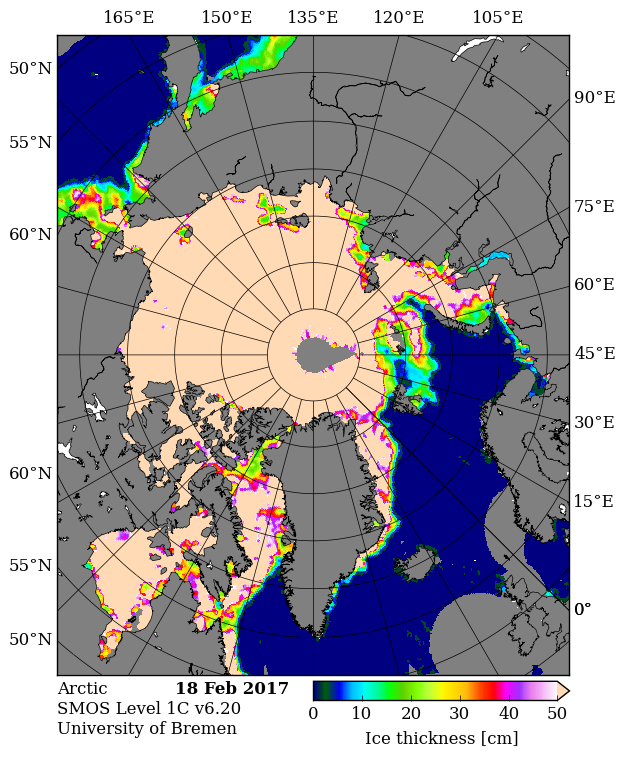
Note the change in scale from previous months, to allow for easier comparison with the “near real time” CryoSat-2/SMOS merged thickness data from the Alfred Wegener Institute:
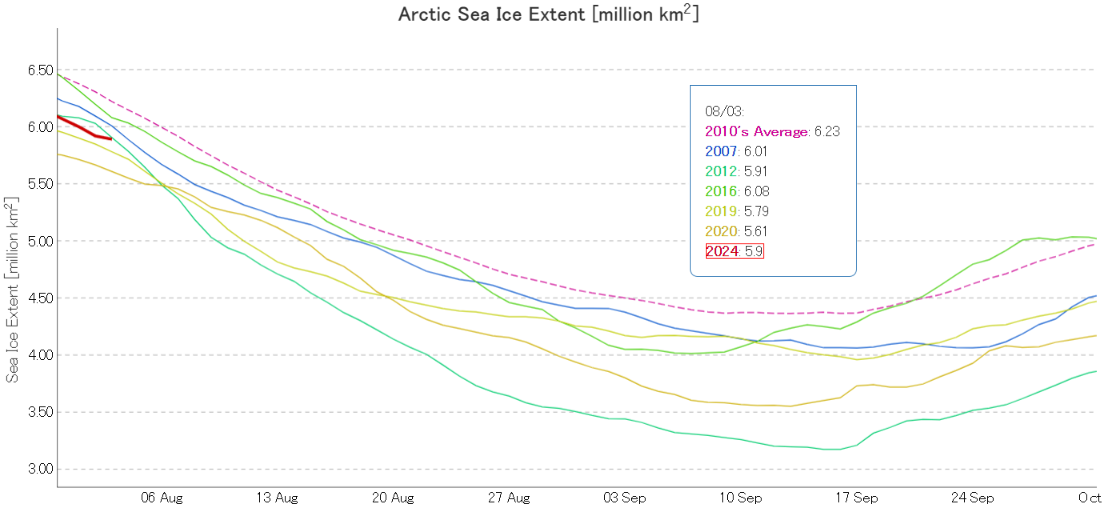
At the beginning of August JAXA/ViSHOP extent is 3rd lowest for the date in the satellite era:
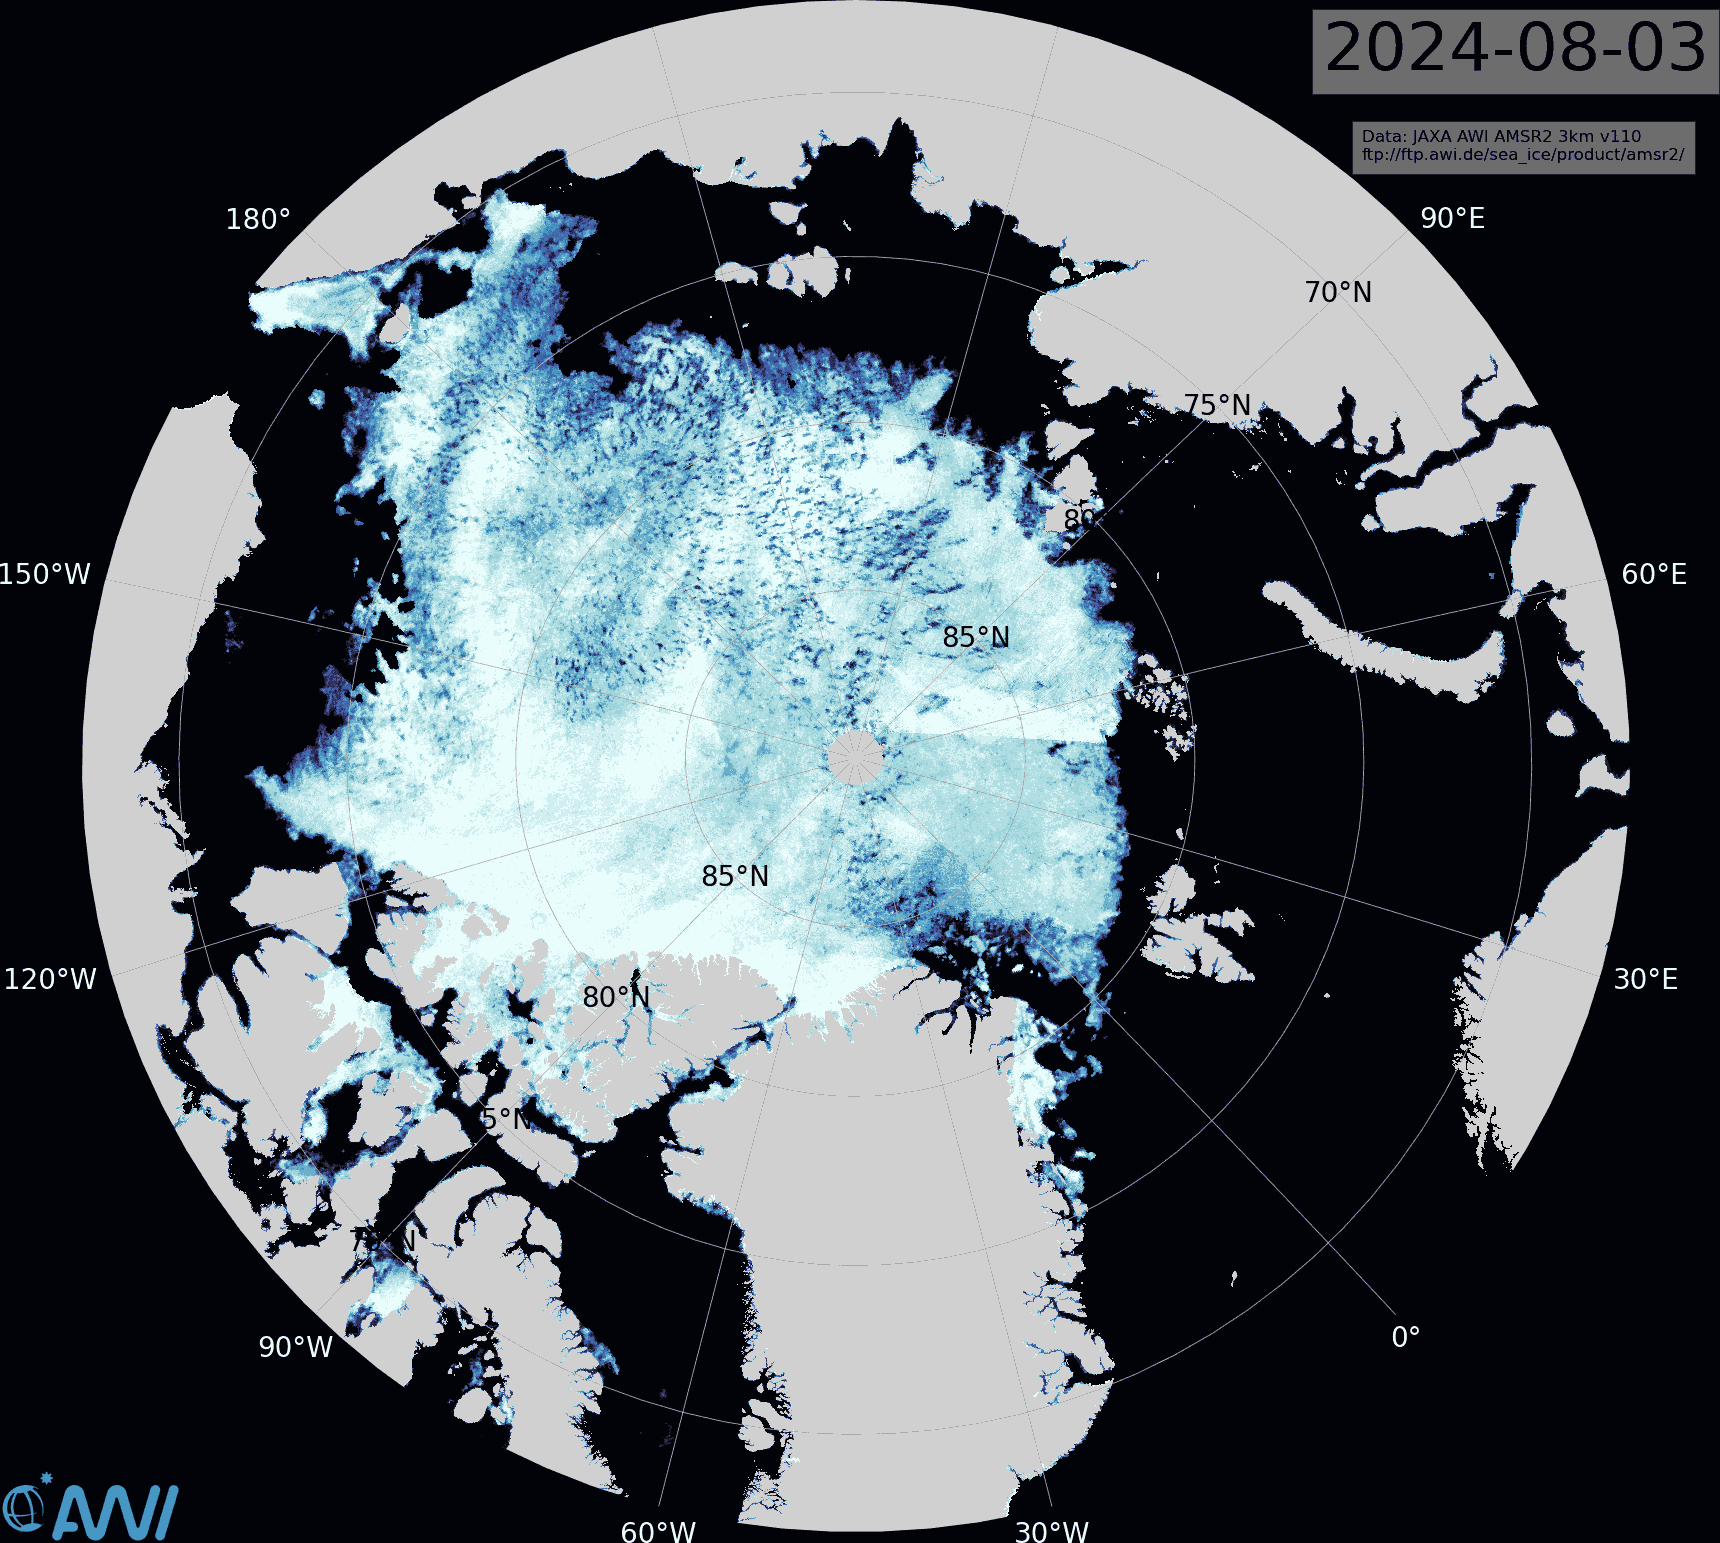
In 2012 extent had just started its unprecedented plunge towards the record September minimum, and 2024 seems certain to cross above the 2012 curve shortly. However, the latest AMSR2 sea ice concentration map from the Alfred Wegener Institute reveals areas of open water across the majority of the Central Arctic Basin:
In particular the sea ice between the North Pole and northern Greenland is remarkably fragmented:
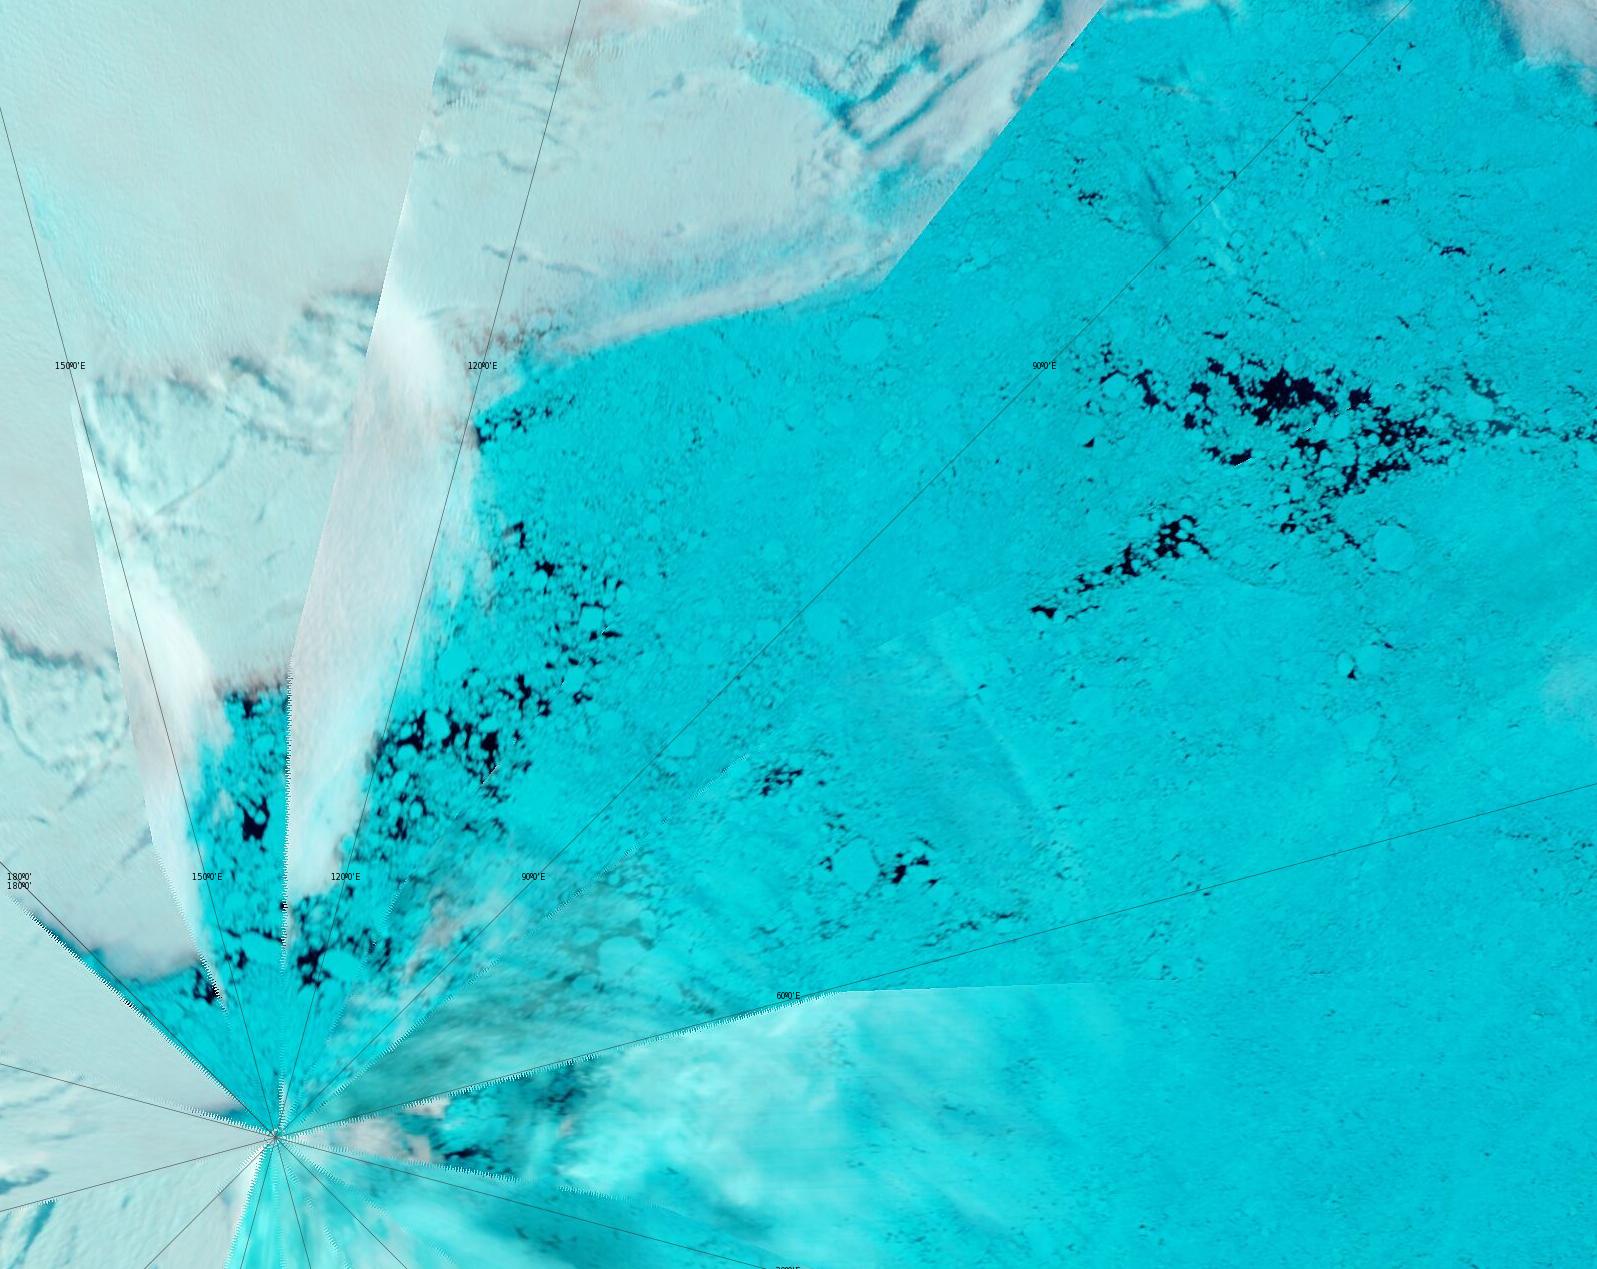
“False colour” image of the North Pole on August 3rd from the MODIS instrument on the Terra satellite
A change is perhaps even better than a rest? Let’s start February with a reminder that following close behind another recent Arctic cyclone, Storm Ingunn caused red weather warnings for high winds and avalanches in Norway two days ago:
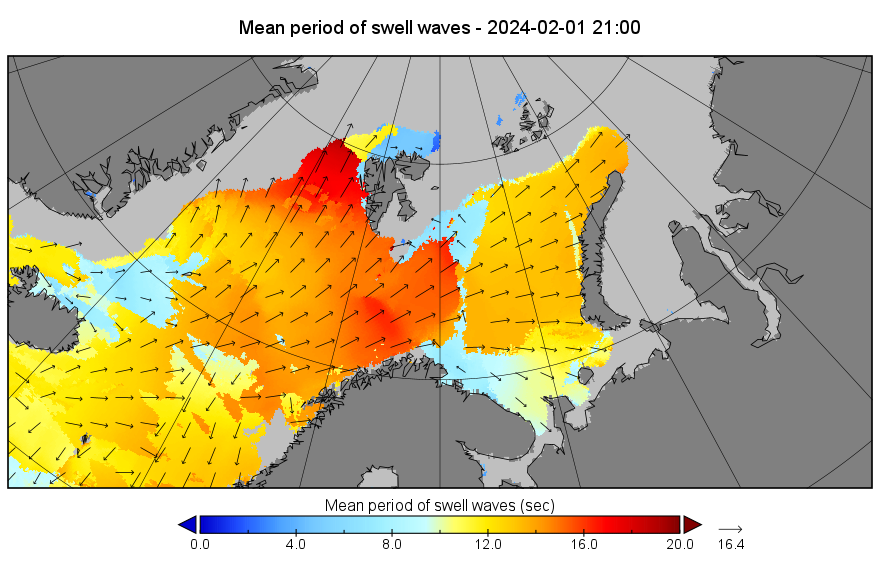
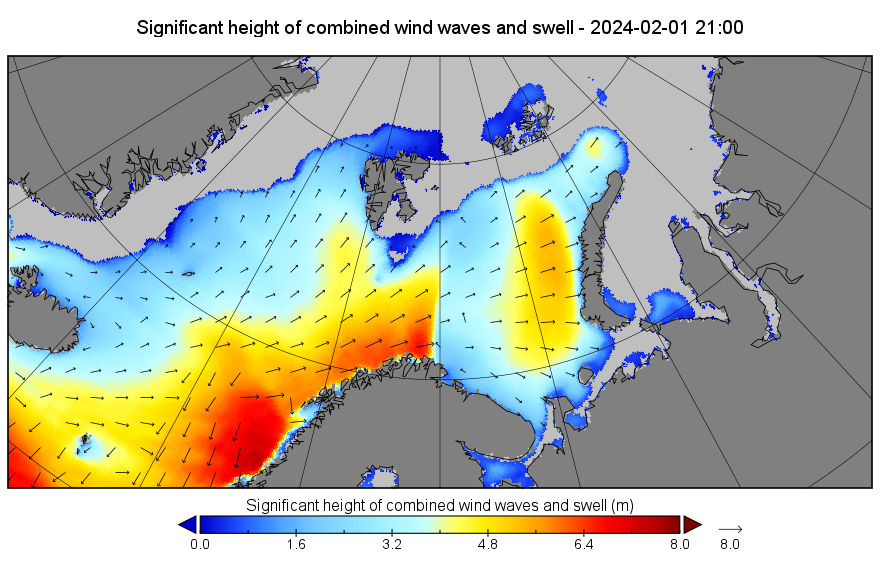
By yesterday evening another long period, storm driven swell was arriving at the sea ice edge in the Fram Strait, and to a lesser extent in the Barents Sea:
By this morning Ingunn had merged with the remnants of the prior cyclone, as revealed in Climate Reanalyzer’s visualisation of the latest GFS model run::
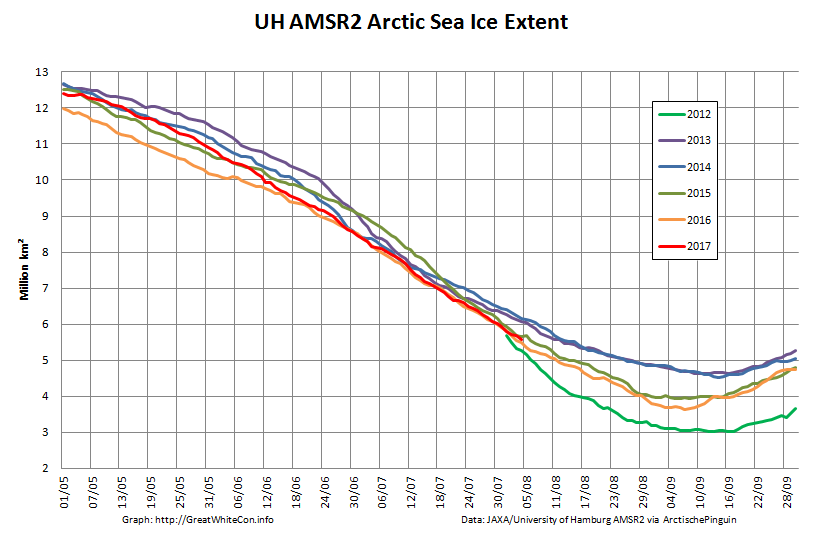
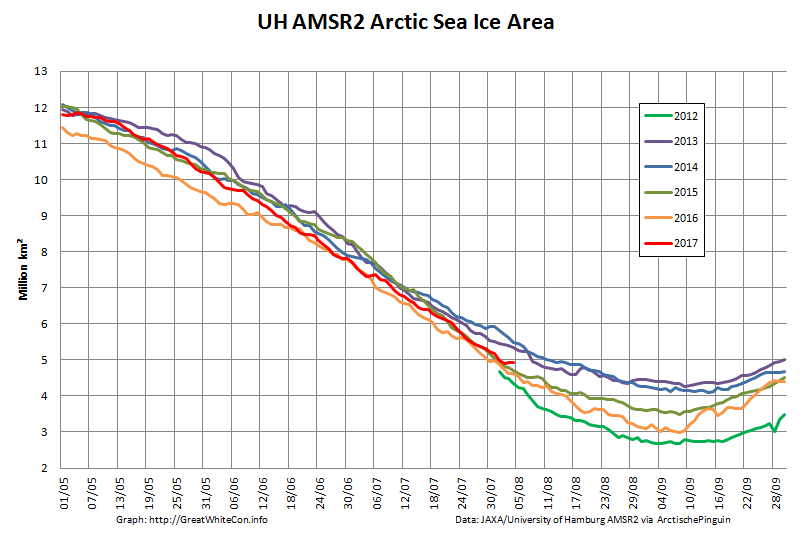
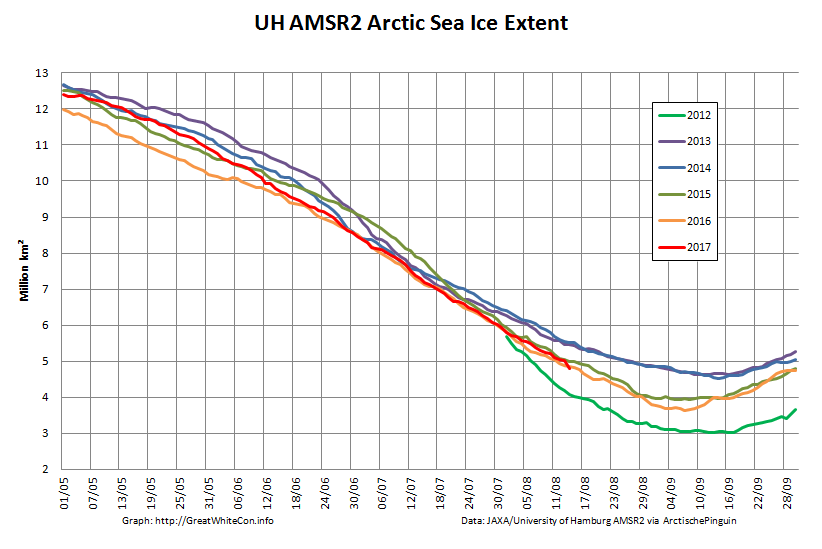
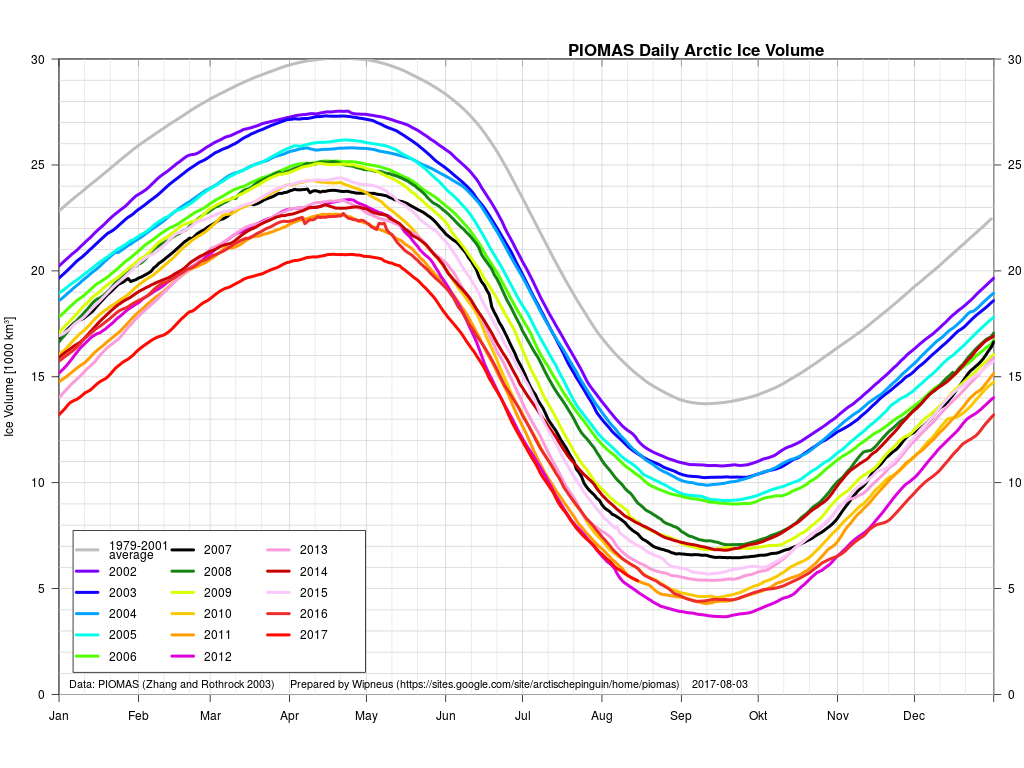
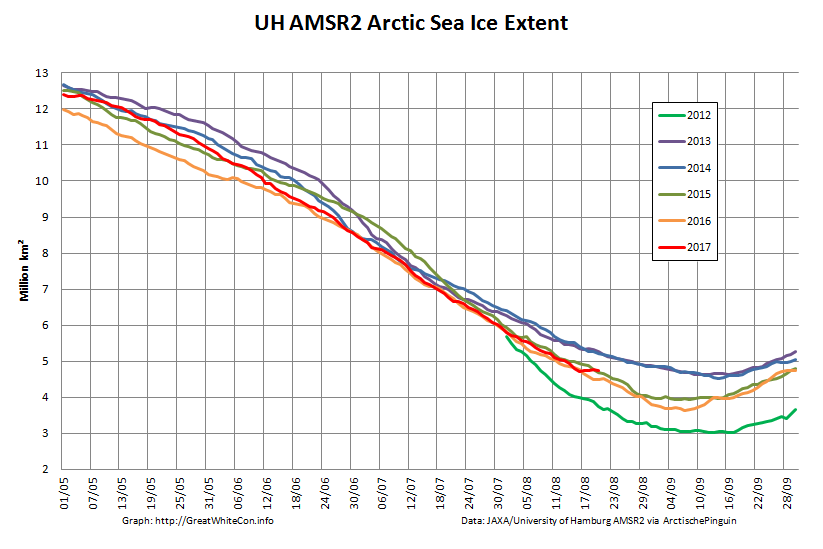
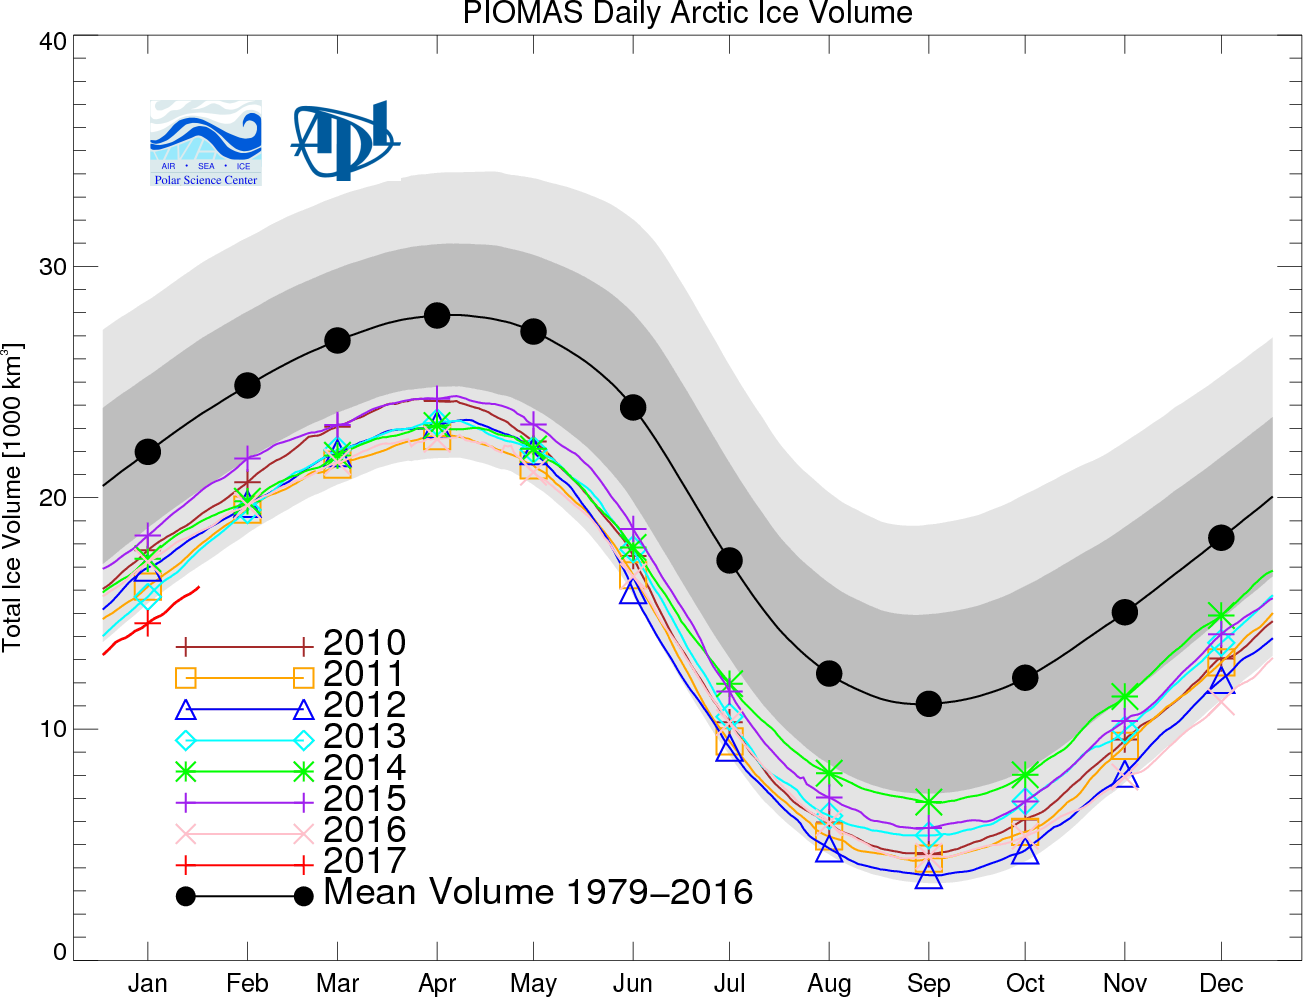
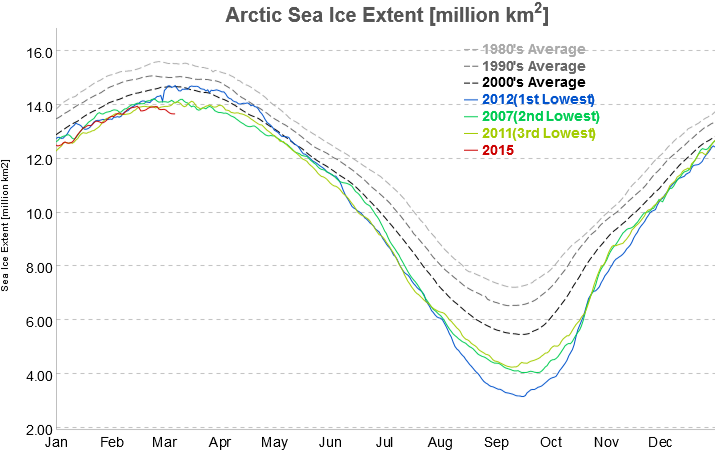
What seems likely to be the most interesting period of the 2017 Arctic sea ice melting season is upon us! The PIOMAS gridded data hasn’t been released yet, but the overall volume numbers reveal that 2017 has now relinquished its “lowest ever” position to 2012. Here’s Wipneus’ graph of the volume data:
plus his anomaly plot:
Our favourite high resolution AMSR2 area and extent graphs now also allow comparison with 2012. Here’s how they look at the moment:
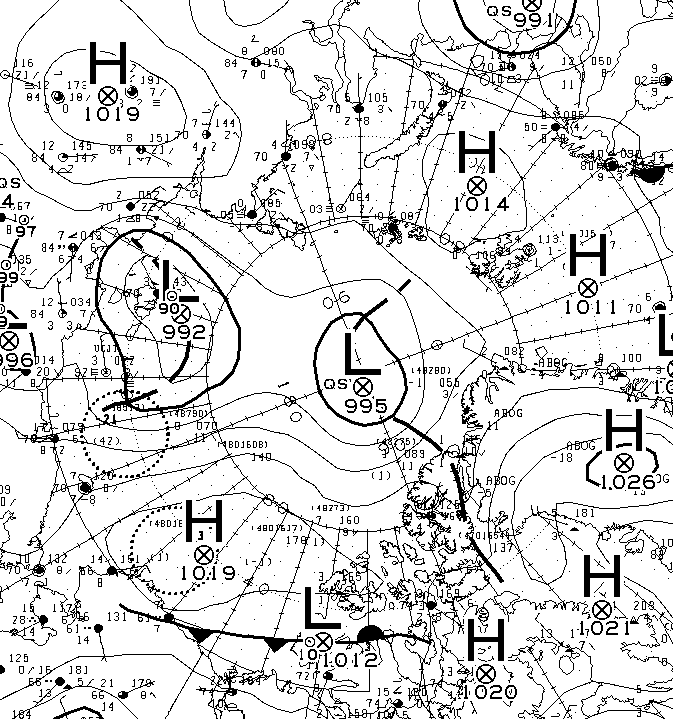
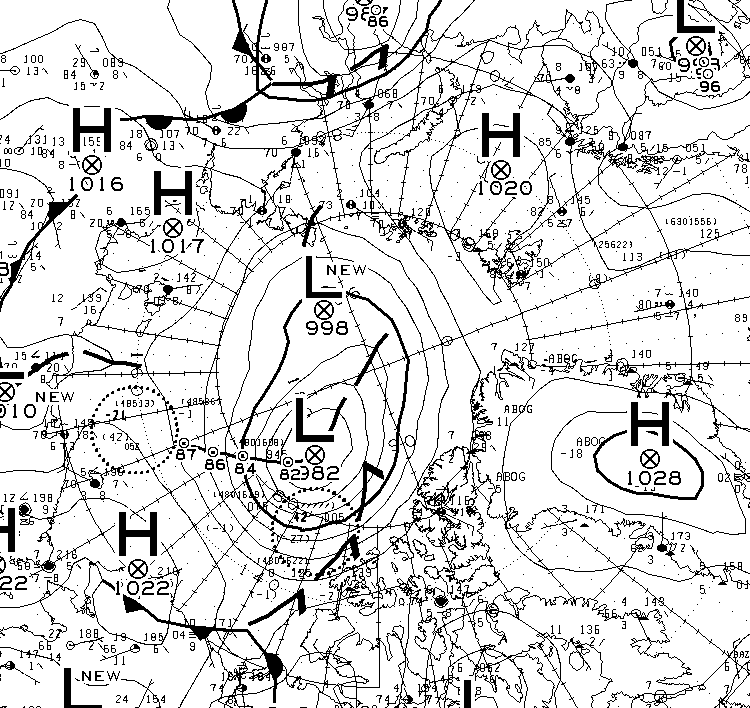
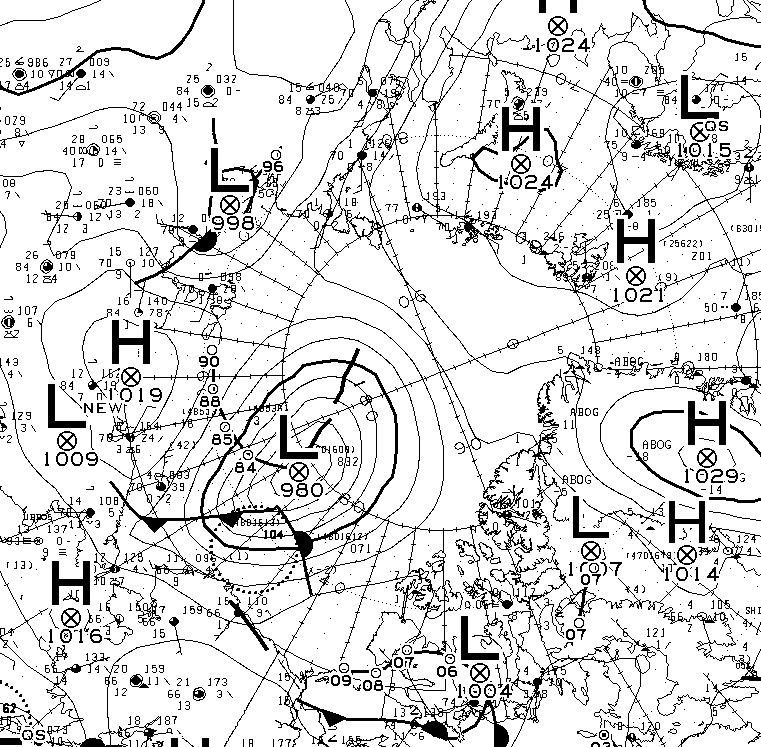
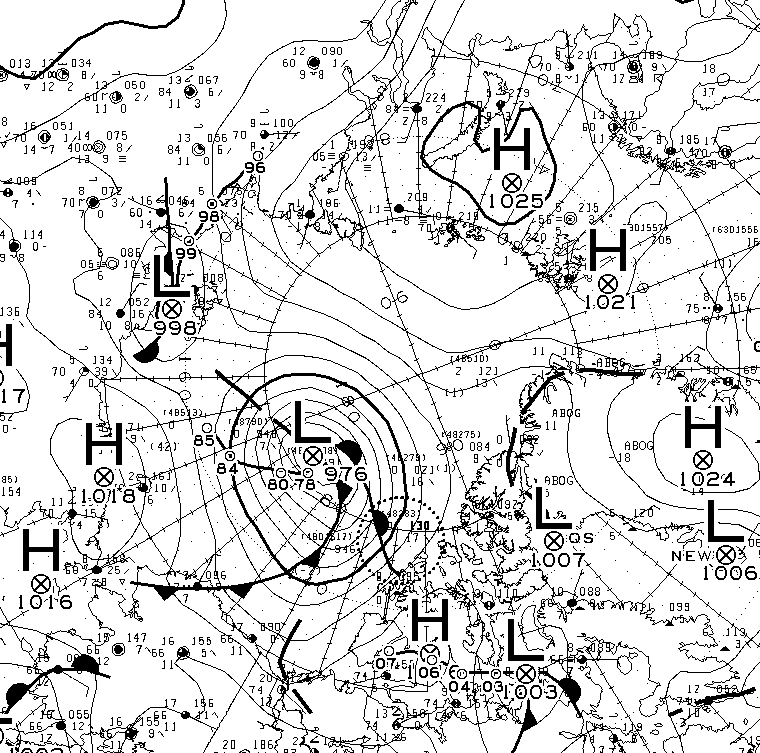
As you can see, round about now is when 2012 Arctic sea ice extent started to noticeably race ahead of the rest of the pack. Will 2017 follow suit? Are there any Arctic cyclones on the horizon for example? Well, the one forecast for August 4th hasn’t materialised. Here’s this morning’s Environment Canada synopsis:
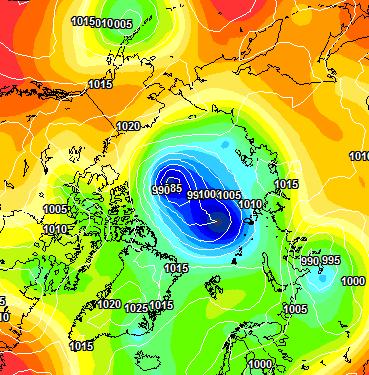
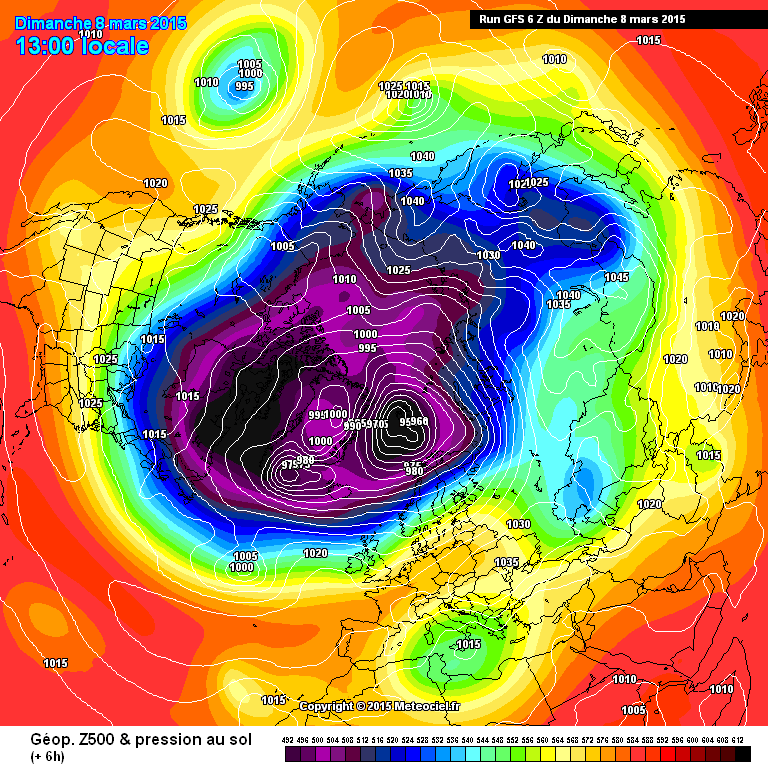
However both ECMWF and GFS agree that a sub 985 hPa storm should have arrived by Sunday morning. Here’s the ECMWF version from MeteoCiel:
There’s stronger storms in the forecast further out, but once again we’ll believe them if and when we see them!
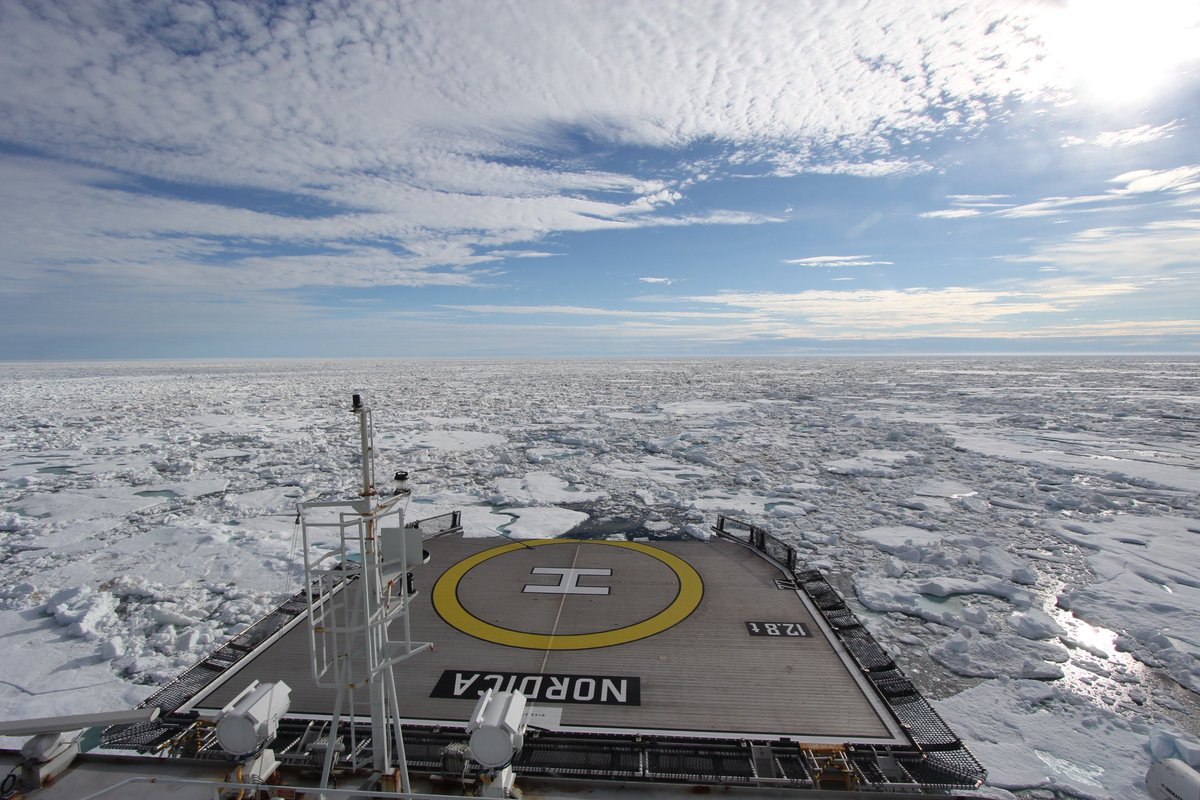
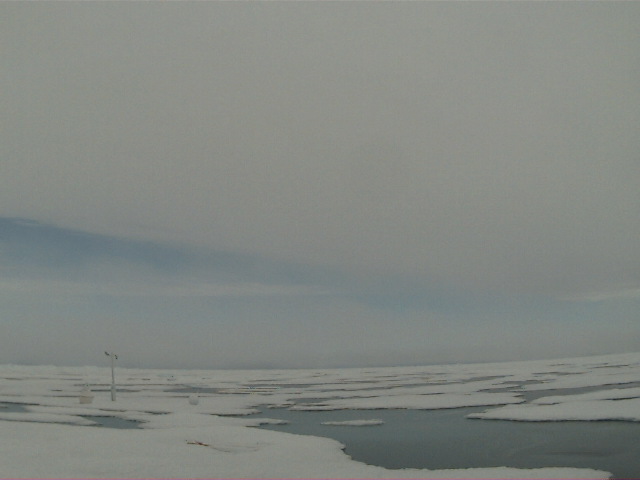
We’re keeping a close eye on the Northwest Passage once again this year. Most of the southern route is open already, but as we predicted the old ice in Larsen Sound has a lot of melting still to do. Here’s how it looked from the icebreaker Nordica a few days ago:
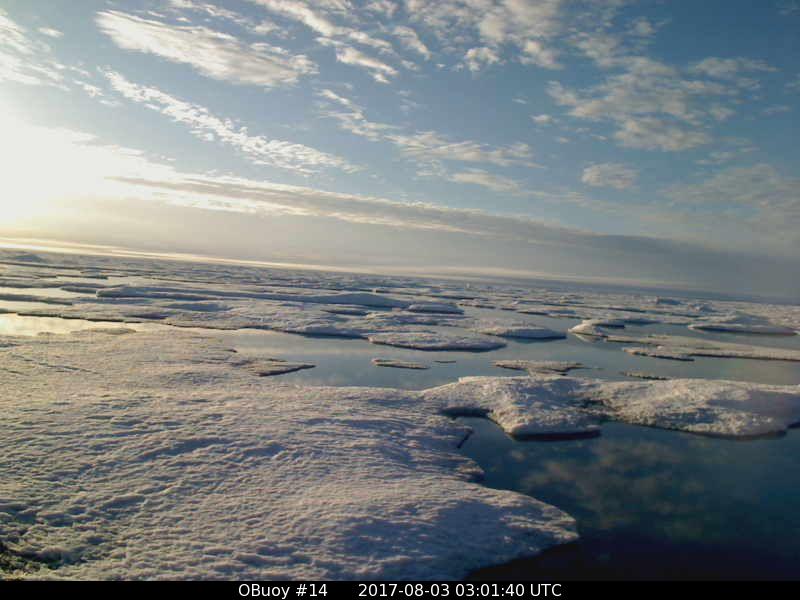
On top of that the old ice around O-Buoy 14 is currently rushing south down the McClintock Channel to replenish it. Here’s how that looks at the moment:
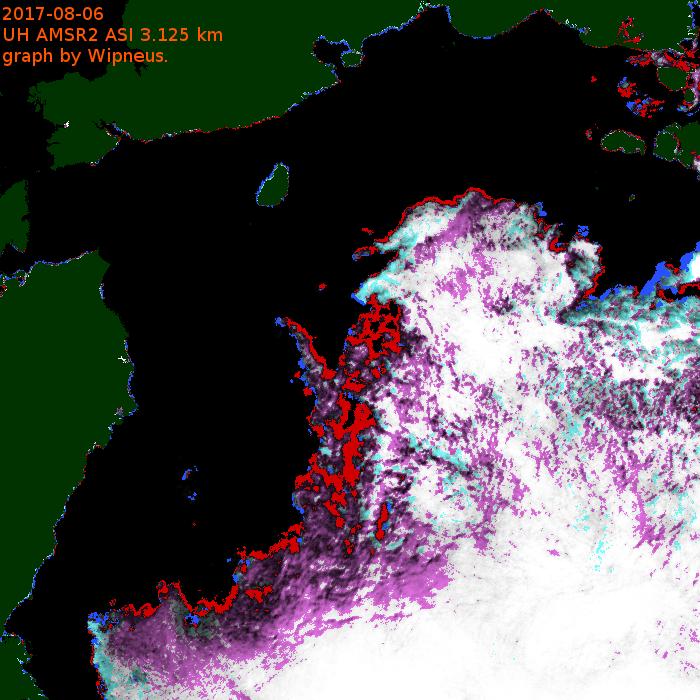
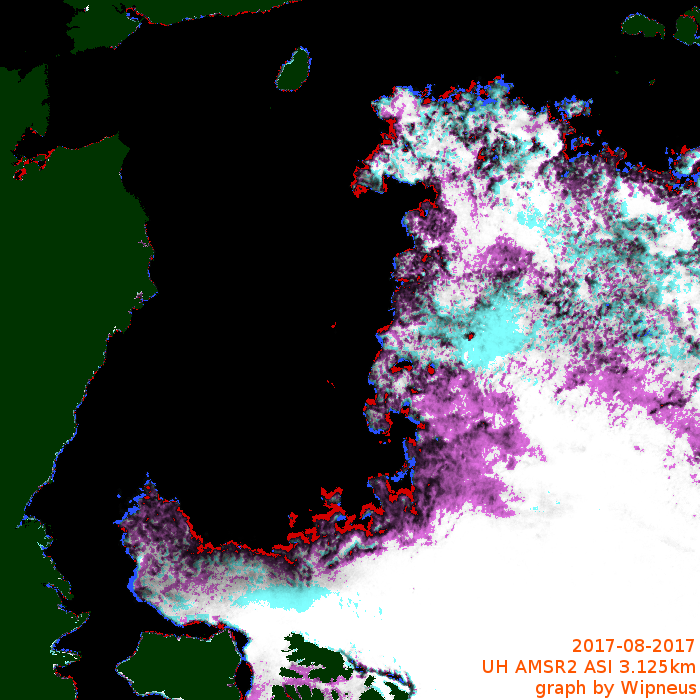
Meanwhile the melt along the Northern Sea Route is well ahead of last year. Here’s the University of Hamburg AMSR2 concentration map of the area:
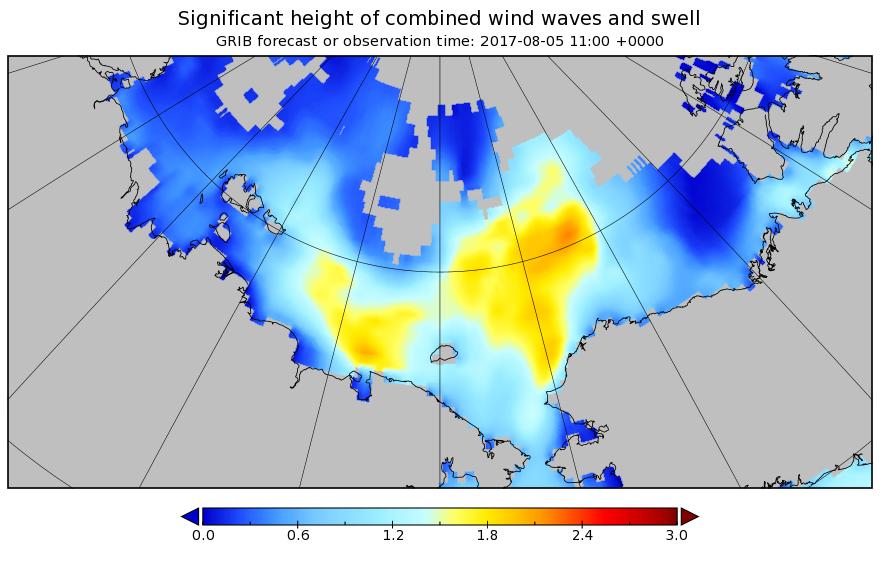
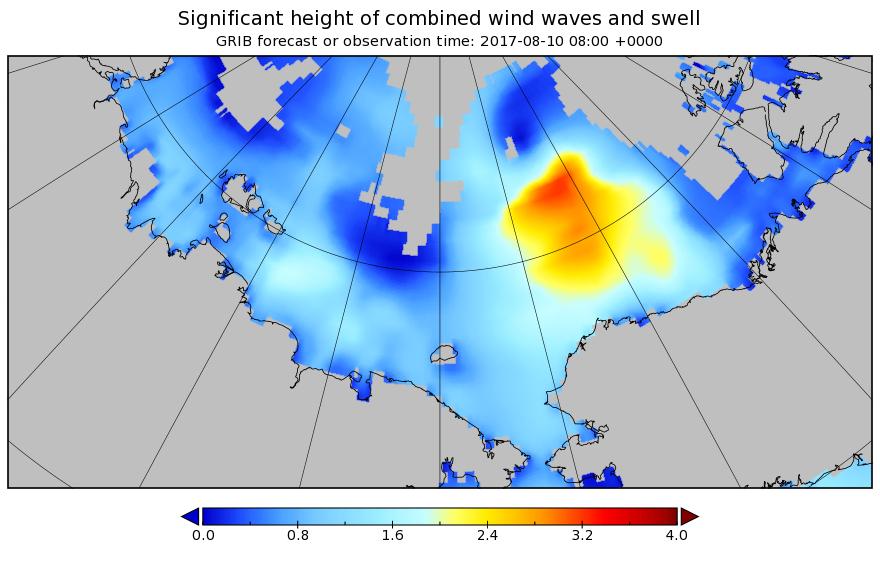
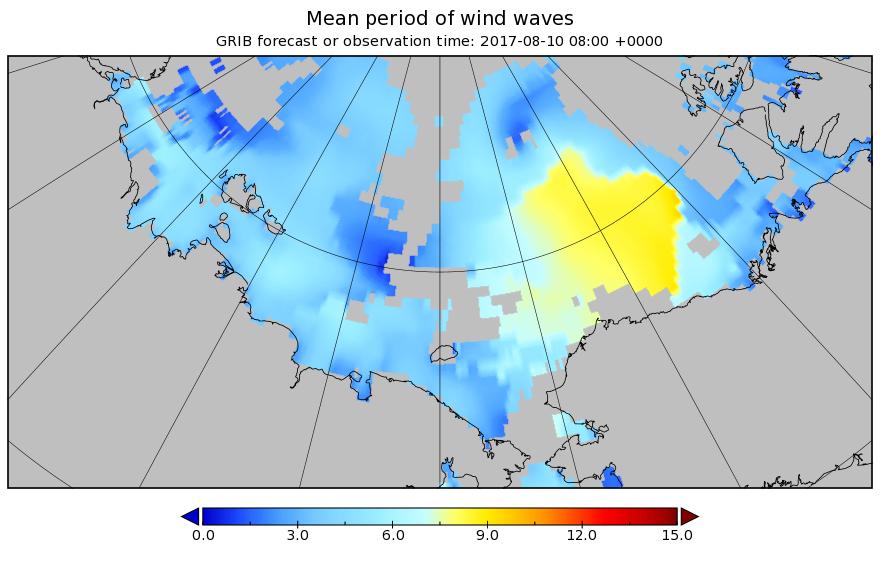
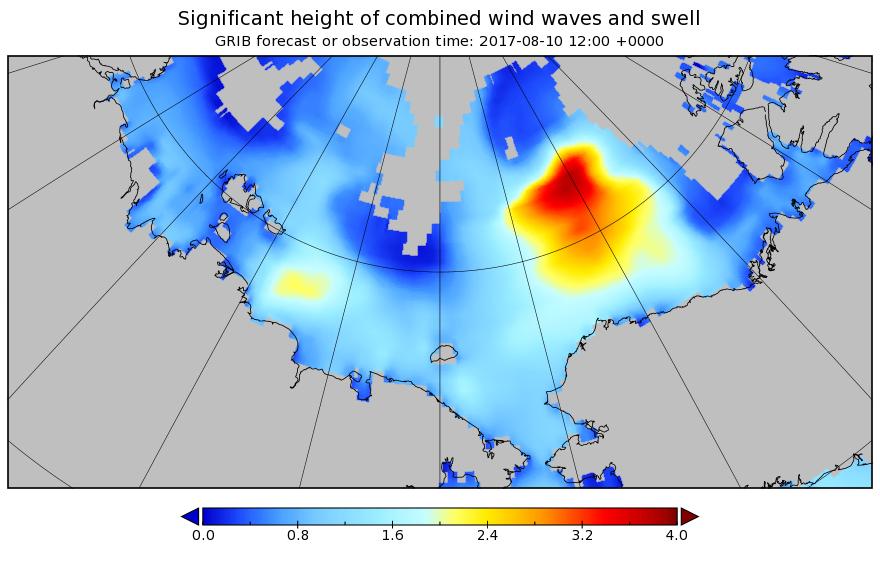
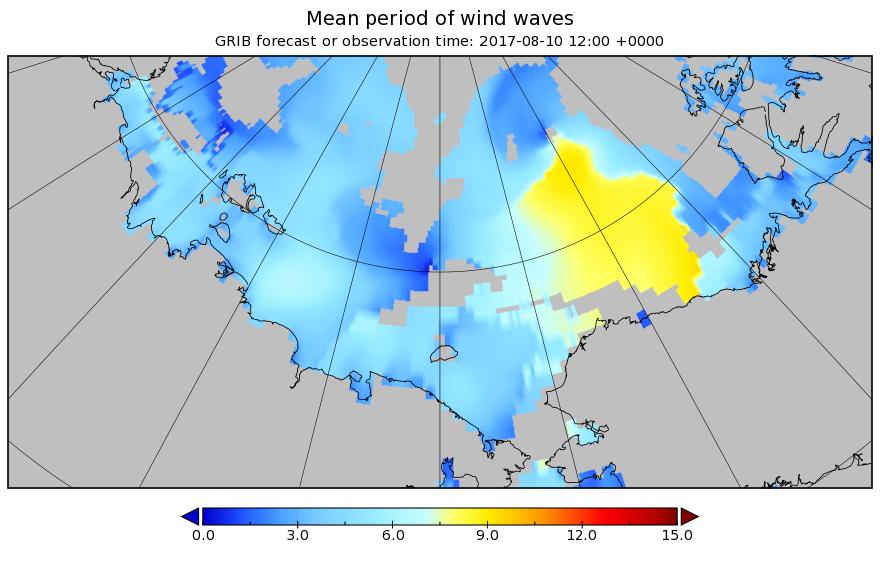
There’s also now a lot of open water on the Pacific side of the Arctic, and Sunday’s cyclone is forecast to create a large area of 2 meter plus waves heading in the direction of the ice edge:
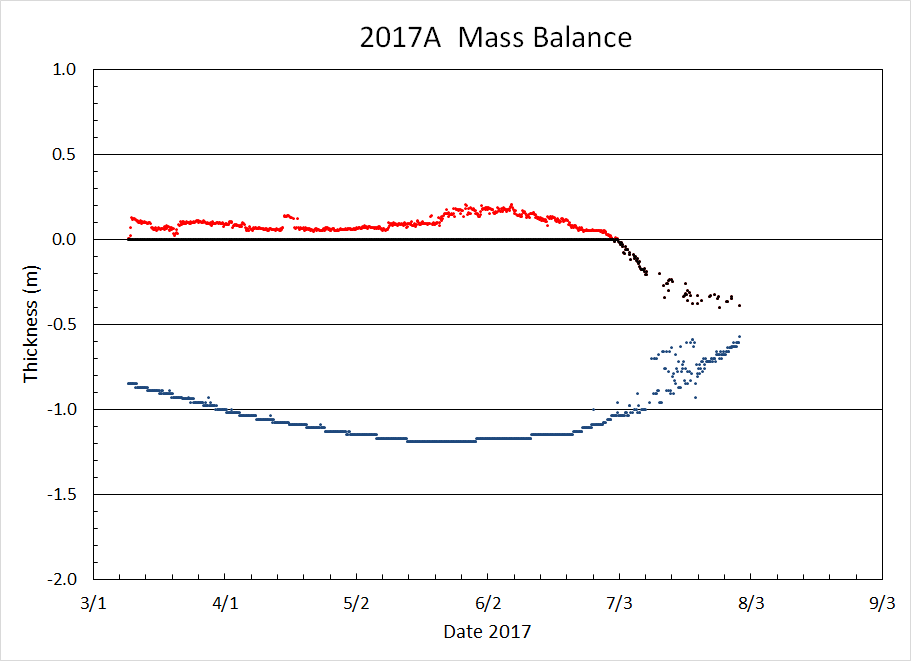
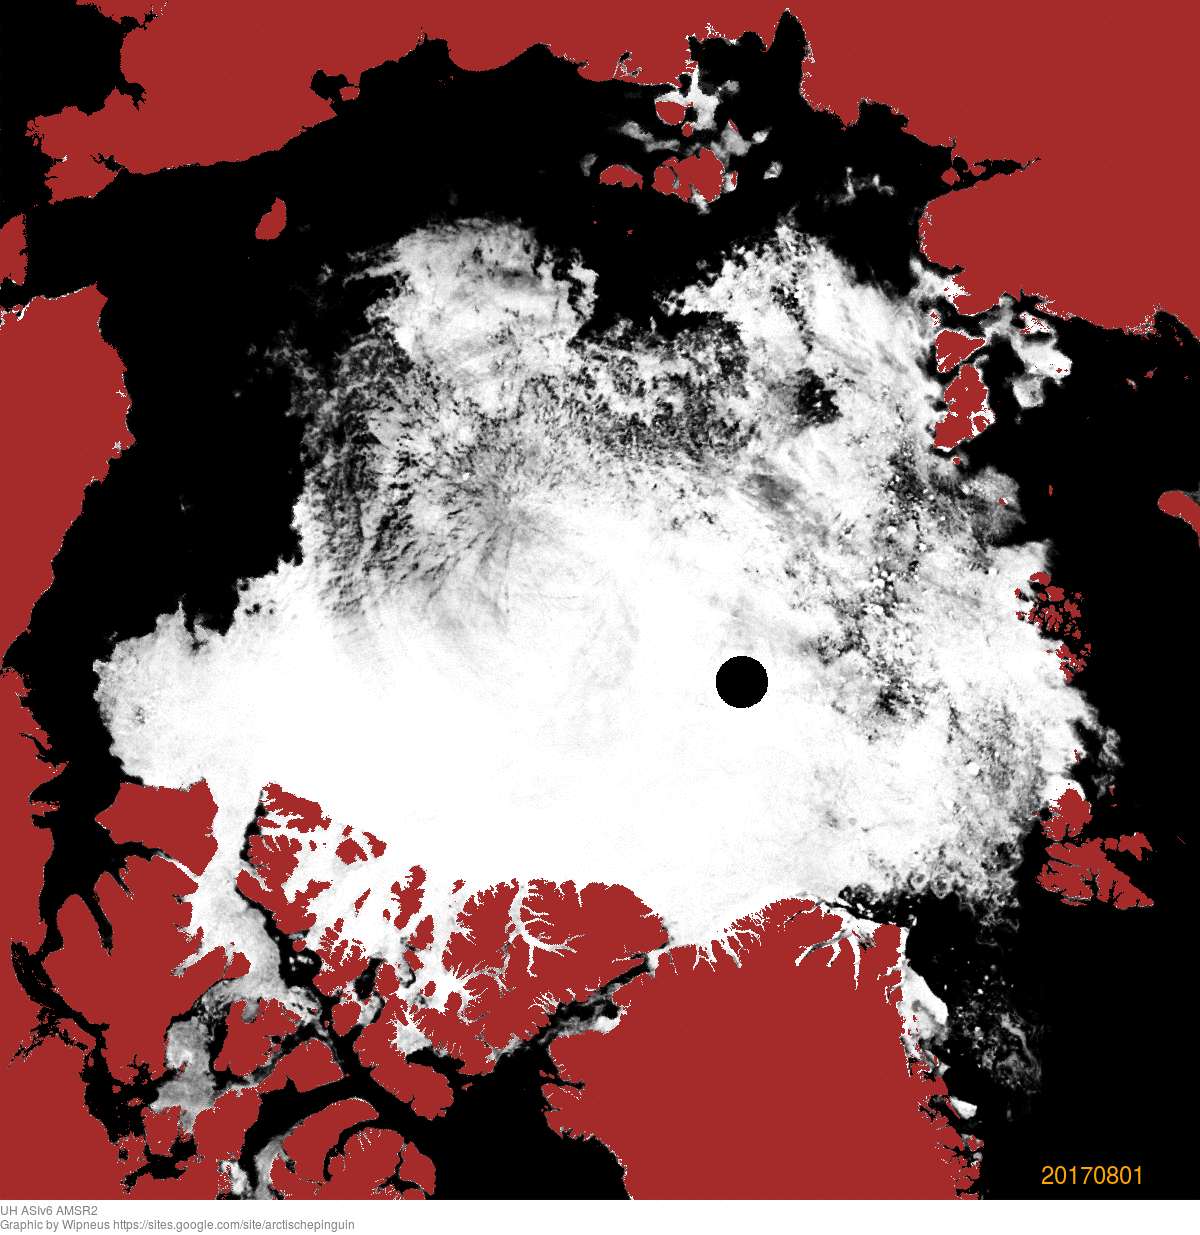
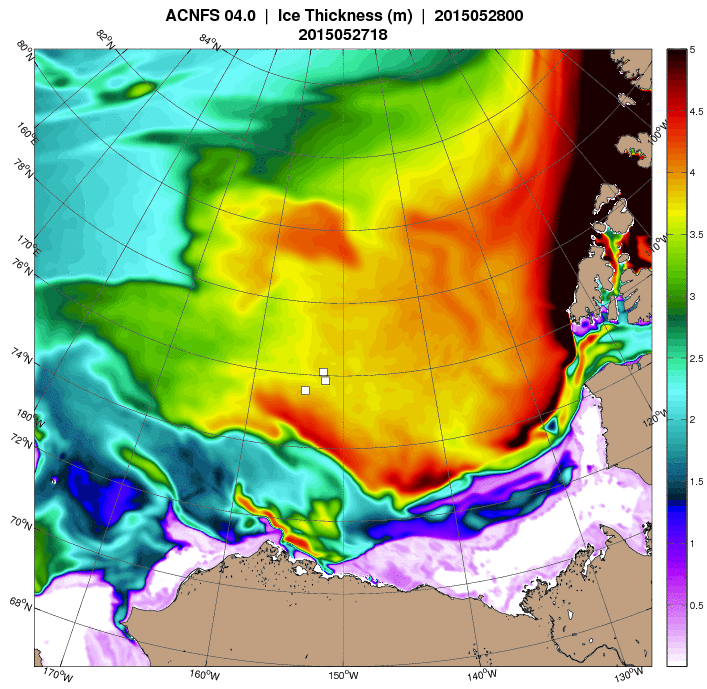
I expect that to have a noticeable effect on the already fragile sea ice by early next week, assuming the storm arrives as forecast! There is an ice mass balance buoy handily placed out on the ice in the path of the storm. Buoy 2017A is currently located near 77 N, 147 W, and its assorted sensors suggest the ice underneath it is now less than 20 cm thick:
Here’s how the area around the buoy looked a couple of weeks ago:
Image of 2017A from WARM 6 on July 18th 2017. NSF project: NSF OPP #1603548
The $64,000 question now is will the 2017 Arctic sea ice metrics stay in amongst the recent pack, or race after 2012 instead?
[Edit – August 6th]
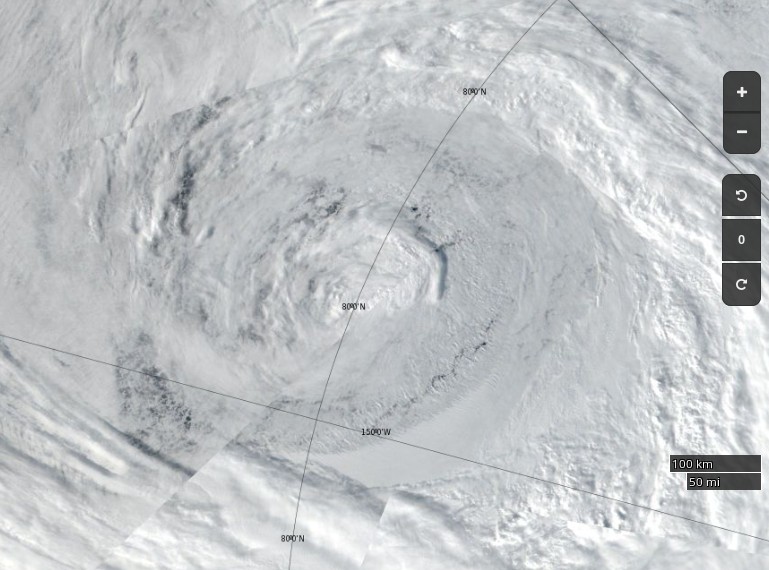
This morning’s synopsis from Environment Canada suggests the cyclone has bottomed out at a MSLP of 982 hPa:
Here’s how the cyclone looked from space yesterday:
NASA Worldview “true-color” image of the sea ice north of the Beaufort Sea on August 5th 2017, derived from the VIIRS sensor on the Suomi satellite
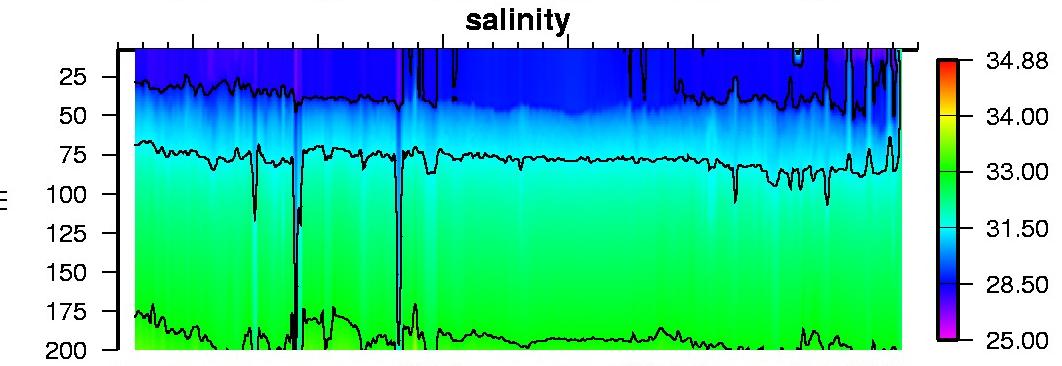
I think that I can convince myself that the salinity profile from ice tethered profiler 97, currently located at 73° N, 134° W, reveals mixing from depth in the wake of the storm:
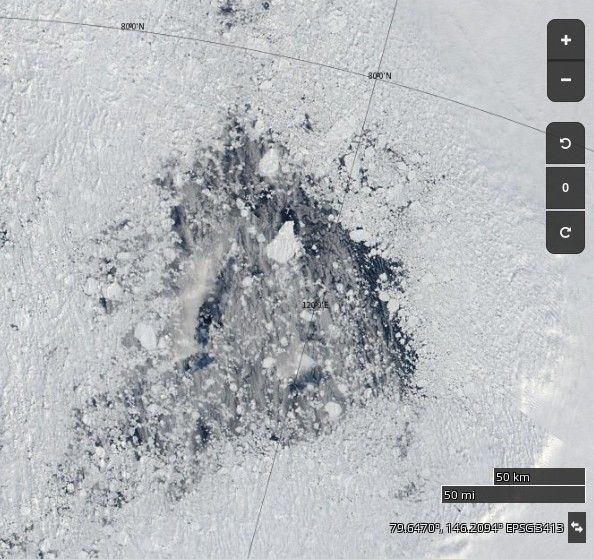
The synthetic aperture radar on the Sentinel 1B satellite can certainly see through the clouds, and reveals open water in the Central Arctic north of the Beaufort Sea yesterday evening (UTC):
Sentinel 1B image of Arctic sea ice at 79° N, 160° W on August 5th 2017
The effects of this weekend’s storm are readily apparent! Just in case you’re wondering Wipneus reports:
Area: -172.0 (+324k vs 2016, +138k vs 2015, -669k vs 2014, -523k vs 2013, +493k vs 2012)
[Edit – August 8th]
The next pulse of swell is currently forecast to be somewhat higher and longer period than the last one. This one is also taking aim at the Beaufort Sea MIZ:
[Edit – August 9th]
According to Environment Canada the latest cyclone is already down to 980 hPa MSLP:
[Edit – August 9th PM]
The MSLP of the current cyclone is now down to 976 hPA:
The latest WaveWatch III forecast has increased the predicted peak height and period of the resulting waves once again:
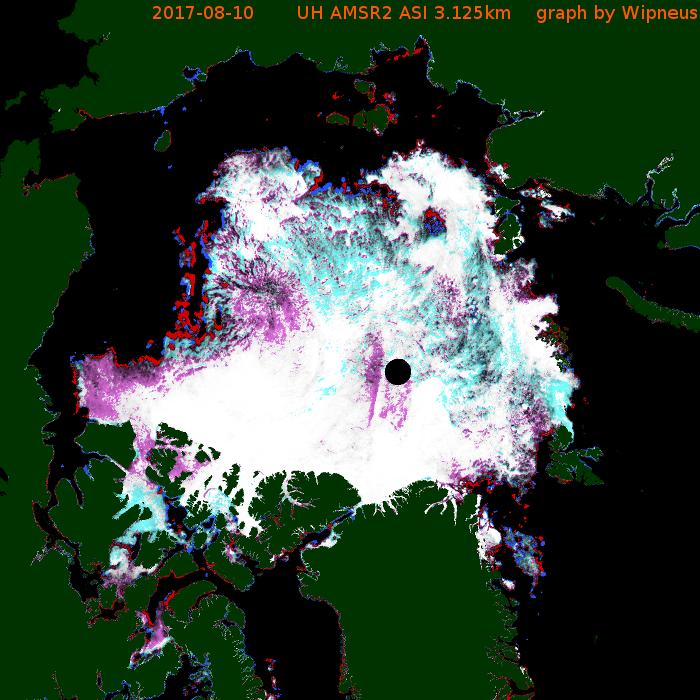
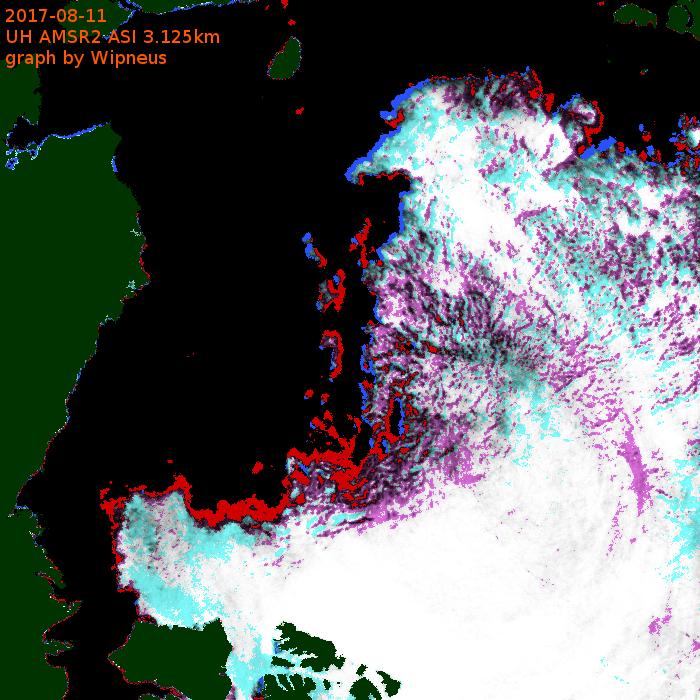
[Edit – August 10th]
Large holes are appearing in the sea ice on the other side of the Arctic too. Take a look north of the Laptev Sea for example:
NASA Worldview “true-color” image of the “Laptev Bite” polynya on August 10th 2017
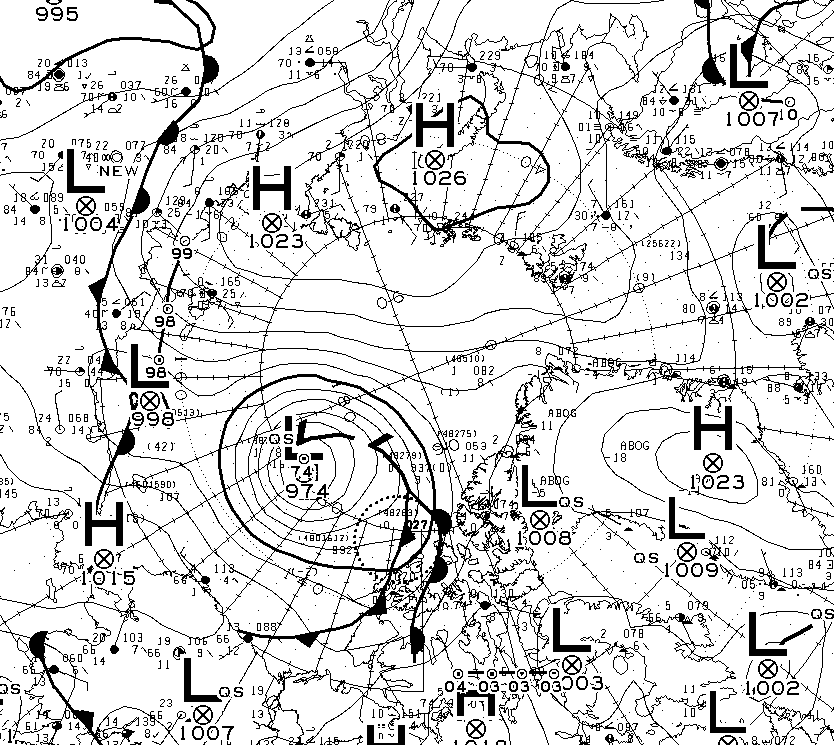
Meanwhile the current cyclone on the Pacific side of the North Pole appears to have bottomed out at 974 hPa:
[Edit – August 11th]
Here’s the latest sea ice concentration one day delta map from Wipneus:
Despite the expected divergence caused by a low pressure area crossing the ice, both are and extent of sea ice on the Pacific side of the Arctic are still falling.
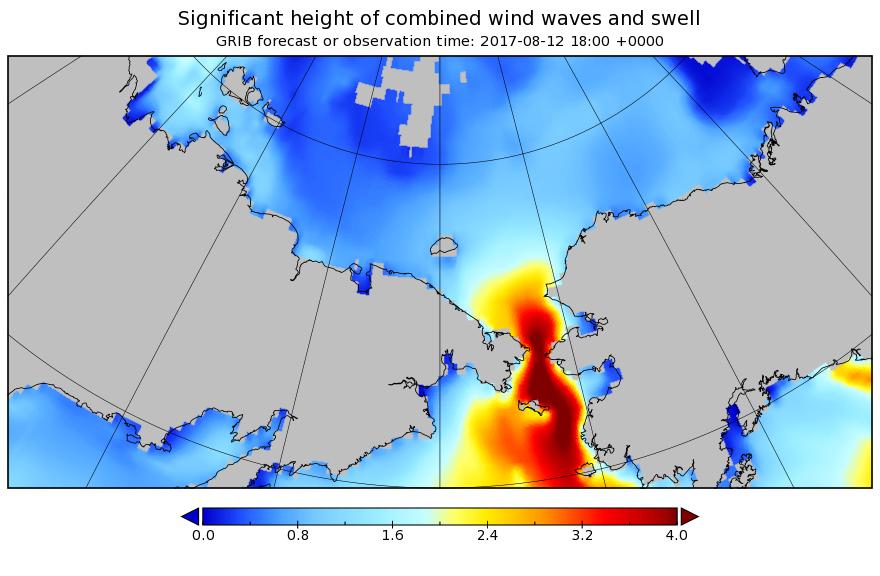
[Edit – August 12th]
The waves are considerably smaller in the Beaufort Sea today, but not in the Bering Strait!
Here’s the latest one day delta map:
and here’s video showing the motion of sea ice in the Beaufort & Chukchi Seas so far this summer:
[Edit – August 13th]
Here’s an animation from Wipneus revealing the effect of the two recent cyclones on the Pacific side, plus everything else that’s been going on in the Arctic:
Click the image to see a much larger (3.3 Mb) version.
[Edit – August 16th]
AMSR2 Arctic sea ice extent has taken another tumble, and has dropped below 2016:
Only 2012 left to beat!
[Edit – August 18th]
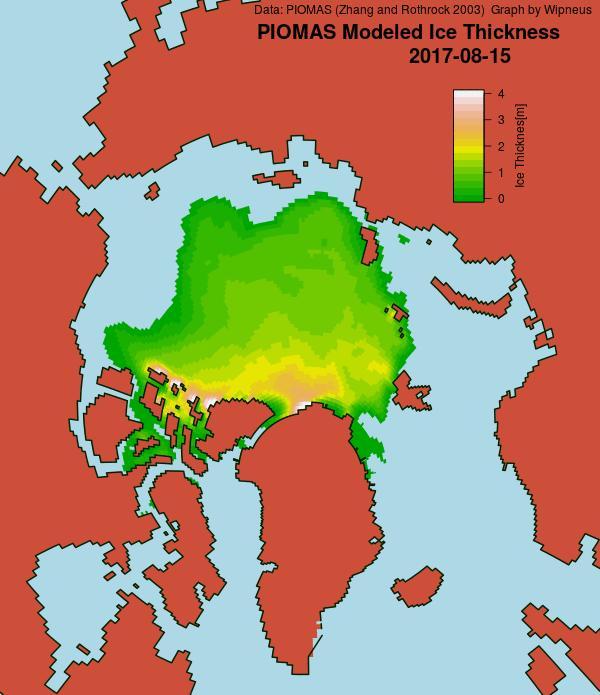
A PIOMAS mid month update has been released, including gridded thickness data. 2017 modelled volume has failed to follow 2012’s trajectory towards the September minimum, and is now on a par with 2011:
[Edit – August 21st]
After a “brief hiatus” in the wake of the recent cyclones Arctic sea ice area has posted a new low for the year:
Extent has yet to follow suit:
The main loss of area has been in the “Beaufort Bite” once again:
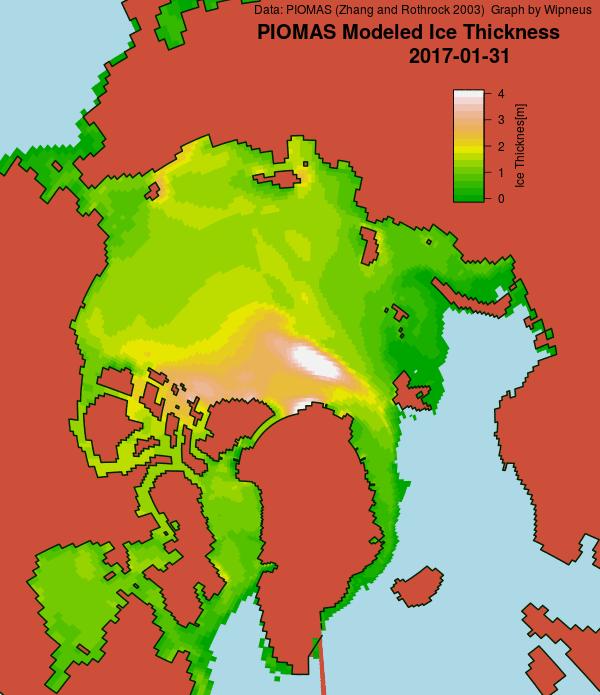
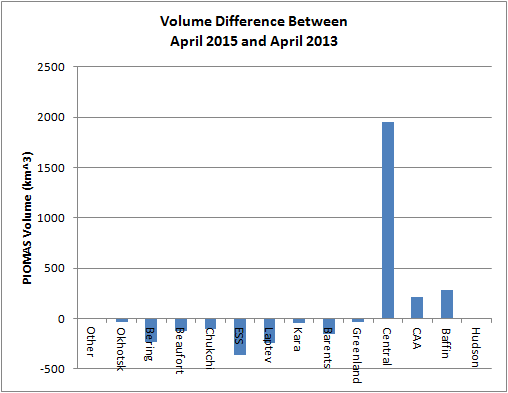
Here’s the PIOMAS gridded thickness for January 31st, courtesy of Wipneus at the Arctic Sea Ice Forum:
Somewhat anomalously it shows the thickest ice some distance away from the coast of Greenland and/or Ellesmere Island. Here too is Andy Lee Robinson‘s updated PIOMAS “Arctic death spiral”:
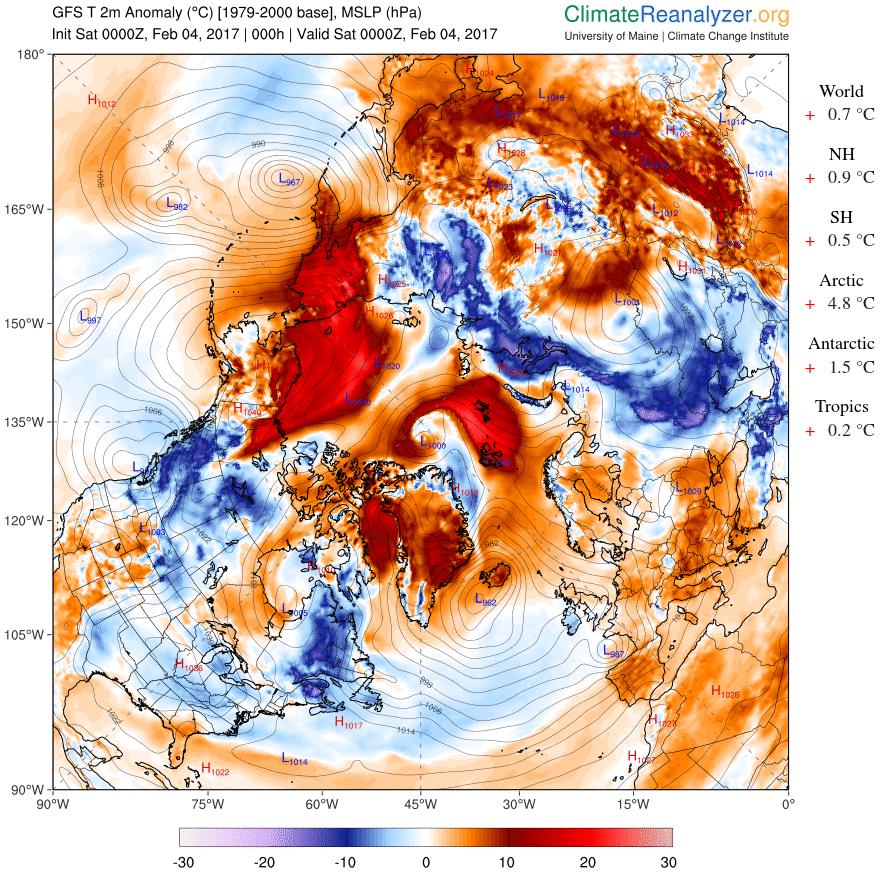
Meanwhile yet more anomalously warm air is entering the Arctic Basin from both the Pacific and Atlantic sides:
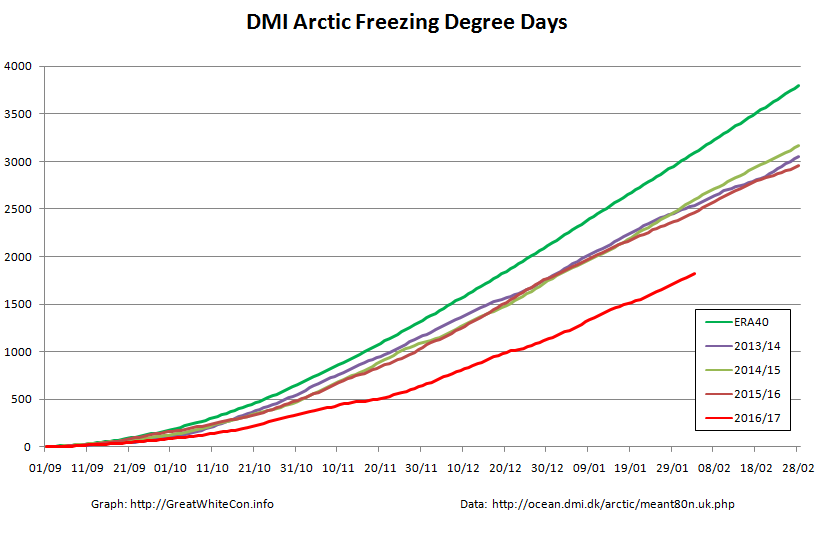
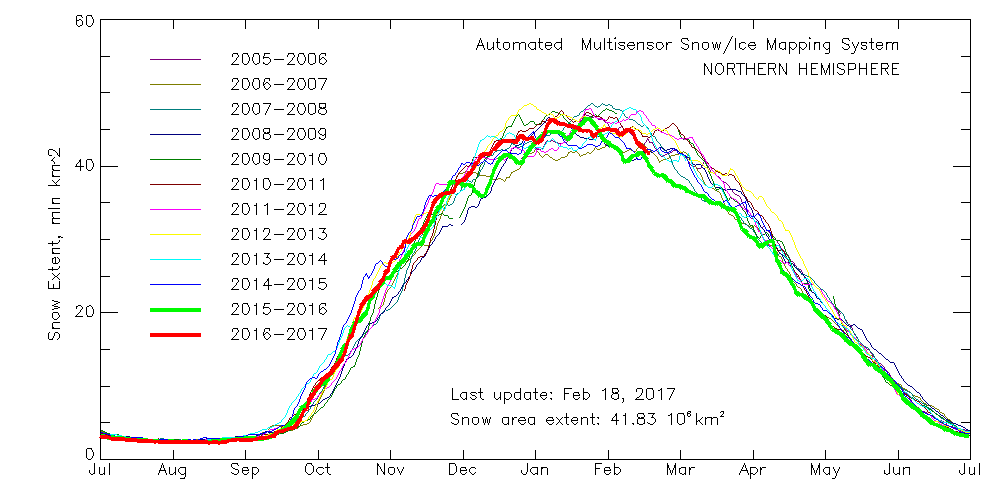
That sort of thing has happened quite a few times over the 2016/17 freezing season, as you can see from this graph of cumulative Freezing Degree Days (FDD for short):
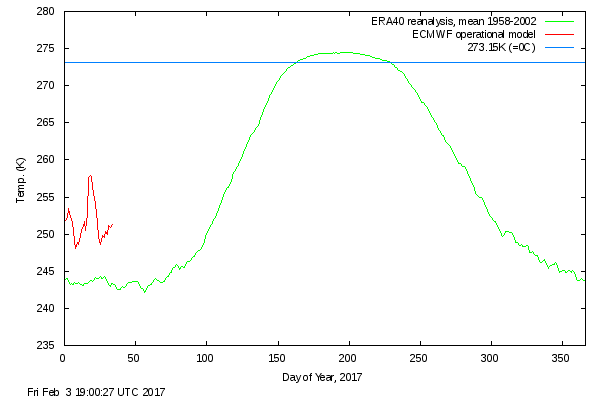
The FDD graph is based on the same data as the probably much more familiar DMI “Daily mean temperatures for the Arctic area north of the 80th northern parallel” graph:
Things are warming up in the Arctic once again.
[Edit – February 5th]
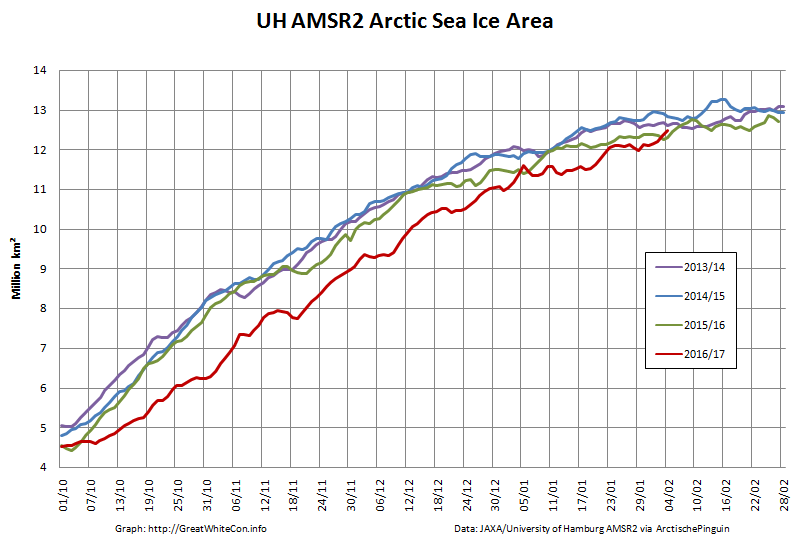
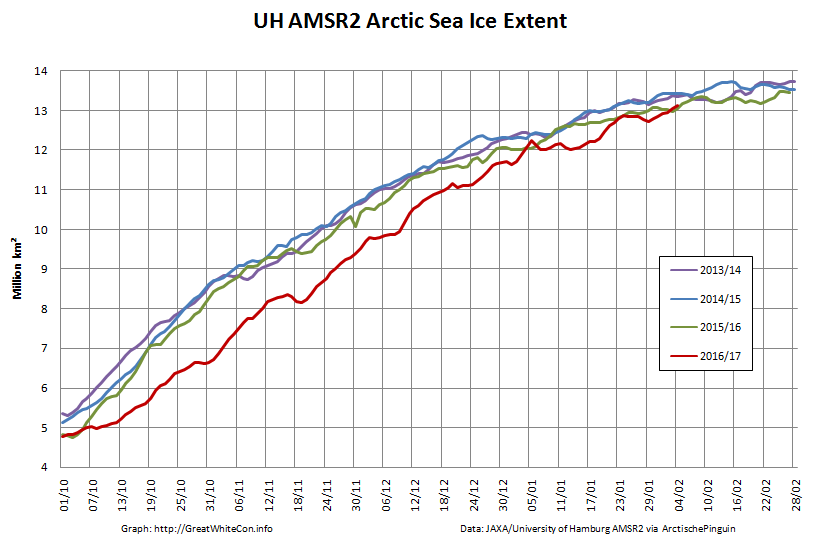
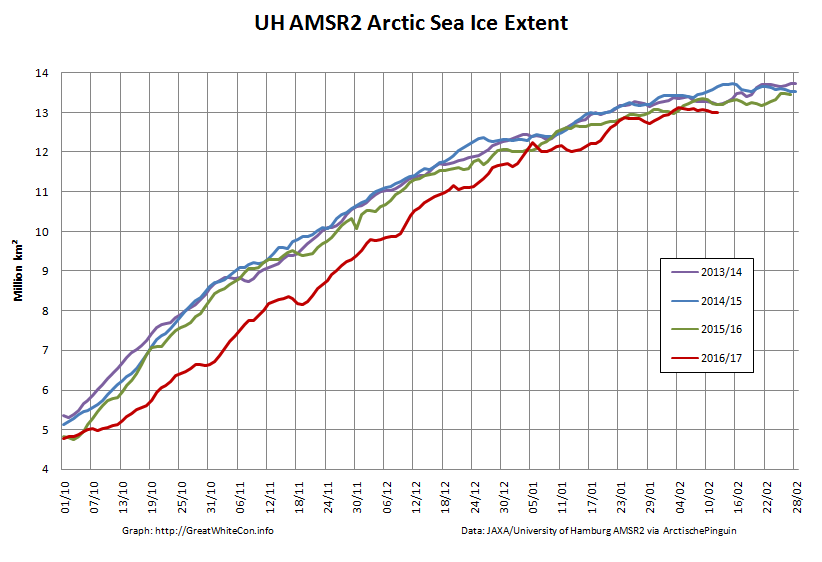
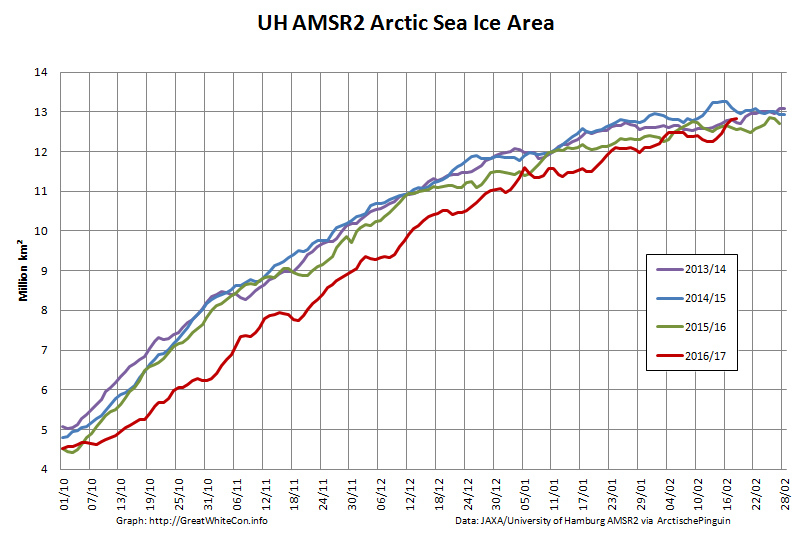
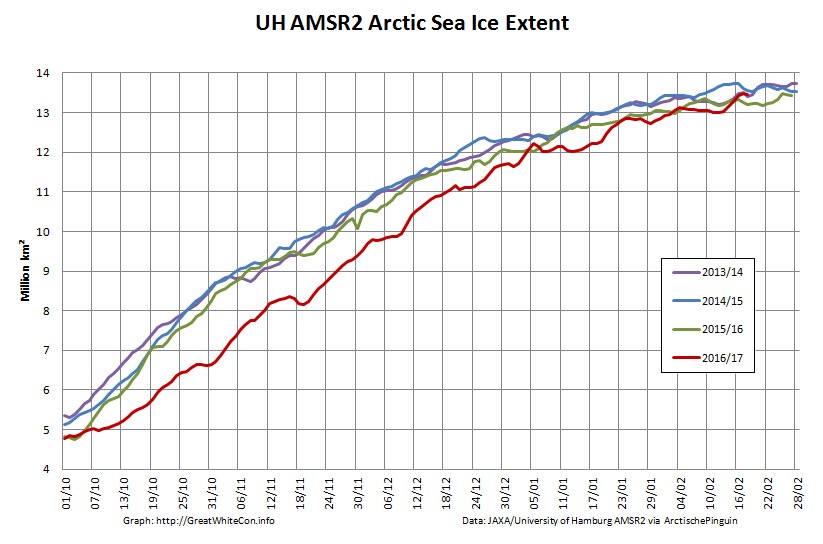
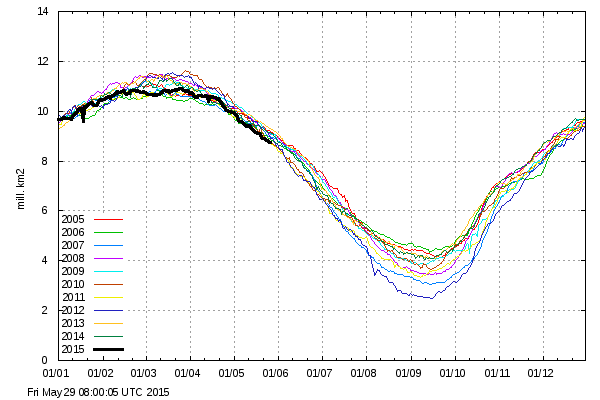
Whilst we await the arrival of the forecast anomalous warmth, how are some other metrics coming along? Here’s the high resolution AMSR2 area and extent:
It looks like they’re back in the “normal” range for now, does it not?
[Edit – February 6th]
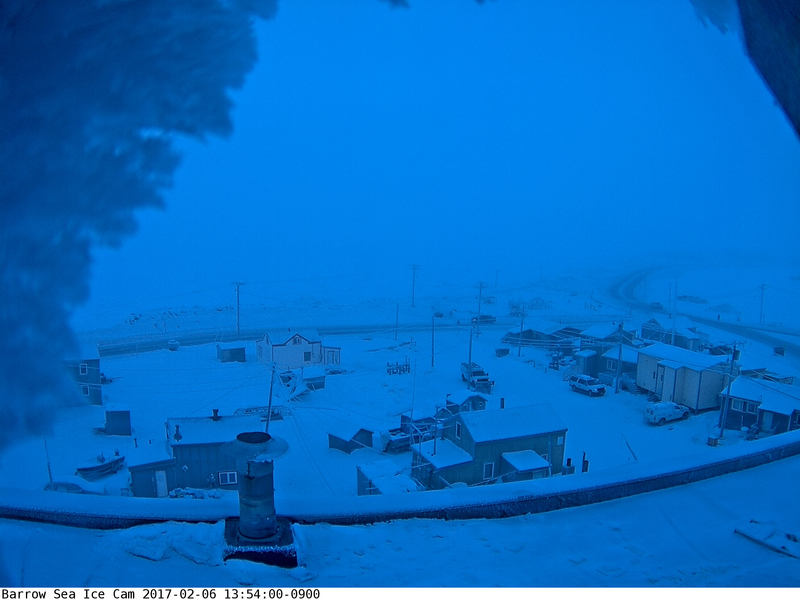
Things currently still look fairly frosty over on the Pacific side of the Arctic, as you can see from the webcam at Utqiagvik (Barrow as was):
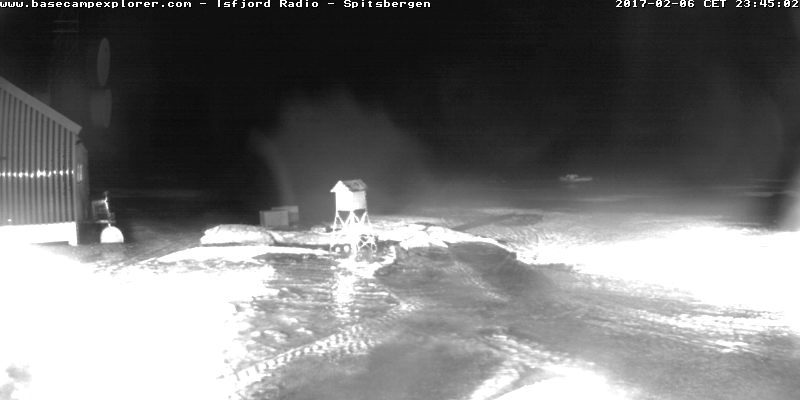
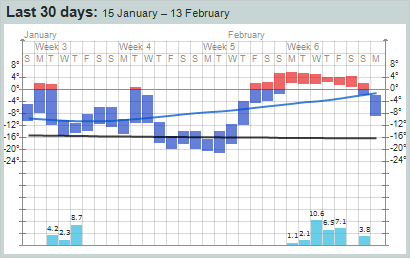
However over on the Atlantic side (and especially for “Richard”!) melting can now be observed on Svalbard:
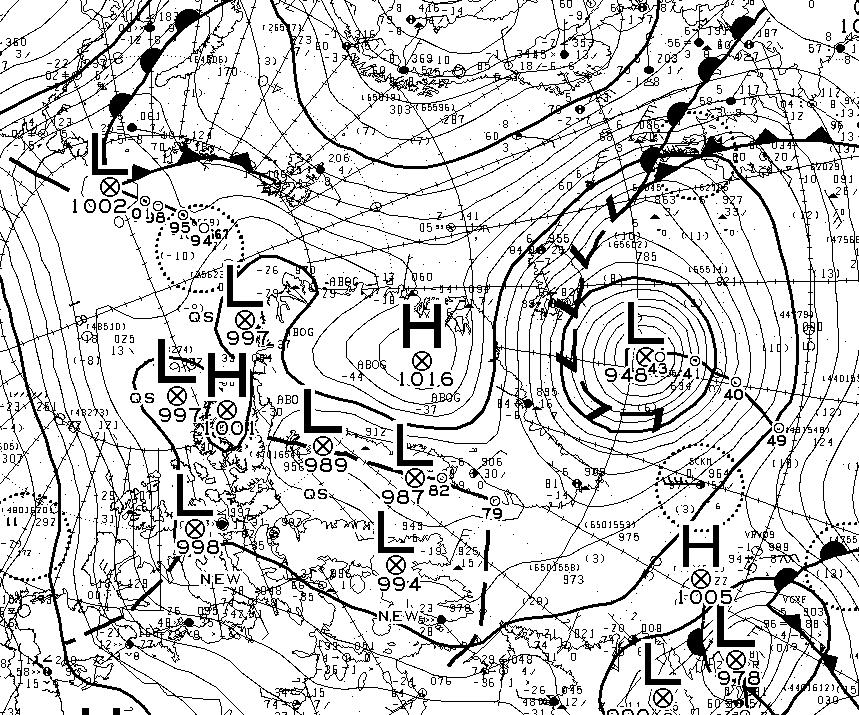
An extremely powerful cyclone off Greenland is pumping heat and moisture northwards:
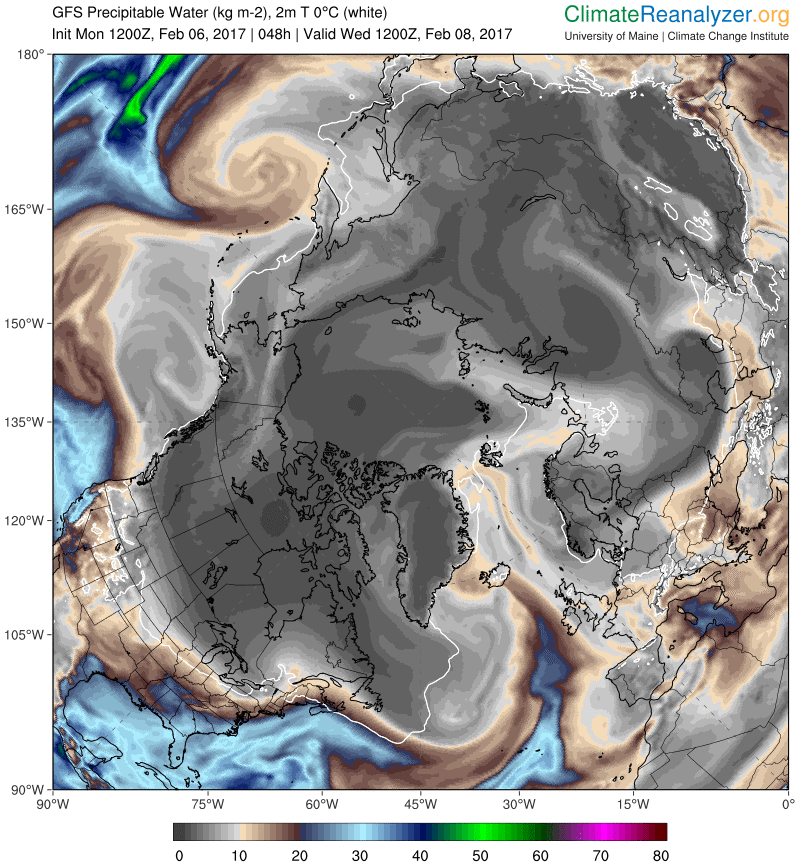
Note that the cyclone’s MSLP fell to 940 hPa earlier today. This is the GFS precipitable water forecast for Wednesday lunchtime:
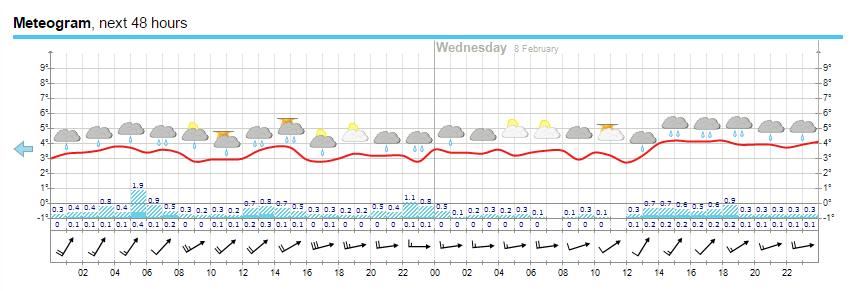
Finally, for the moment at least, here’s the current weather forecast for Longyearbyen in Svalbard:
All in all there’s plenty more heat and moisture on the way.
Once again our title for today is inspired by the indefatigable “Steven Goddard”. His latest Arctic themed article on his so called “Real Science” blog is entitled “Trouble Looming For Arctic Alarmists“, and he’s following his usual formula of showing an image or two interspersed with unrelated text. Here’s Tony’s textual take on things, interspersed with our graphic retorts:
Arctic sea ice coverage is nearly identical to 20 years ago:
Arctic sea ice is the thickest it has been in a decade.
According to PIOMAS it’s thin in the Beaufort, and most other areas too!
As we summarised matters for “Steve”/Tony’s loyal readership:
The Gish Gallop continues! Just for the record:
Arctic sea ice coverage is currently NOT nearly identical to 20 years ago
Arctic sea ice is currently NOT following almost the exact trajectory of 2006
Arctic sea ice is currently NOT the thickest it has been in a decade in Ron’s beloved Beaufort/Chukchi/East Siberian Seas (BCE for short)
Renowned Arctic sea ice expert “Steve Goddard” predicted last year that.”The minimum this summer will likely be close to the 2006 minimum, which was the highest minimum of the past decade”. That’s not how things eventually turned out!
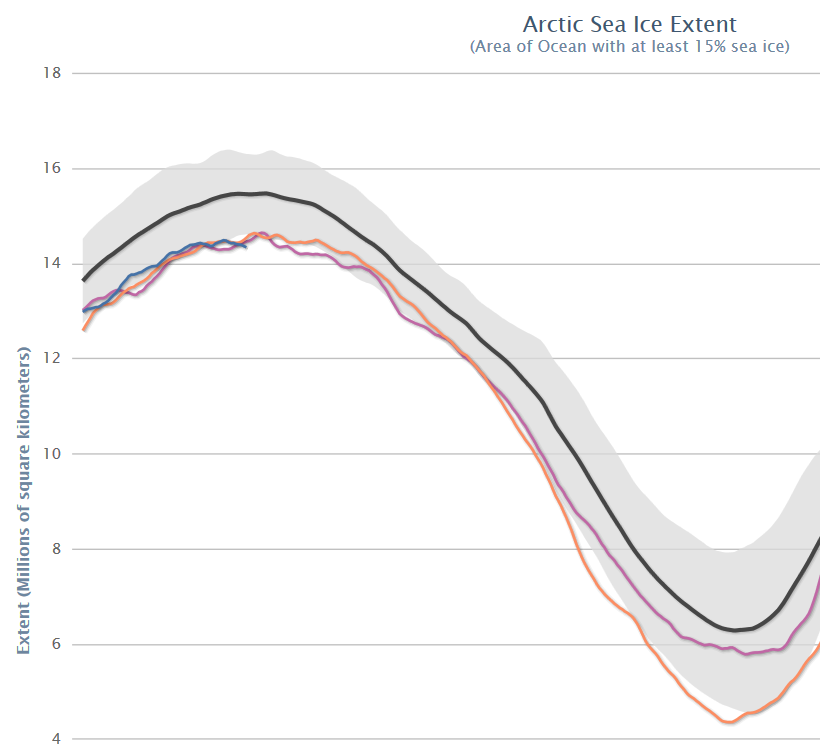
As we reported on February 18th, some of the Arctic sea ice extent metrics reached the lowest levels for the date in their respective histories quite some time ago. Today though, we’re looking at a full house. The daily NSIDC and IJIS extent numbers have both been at all time lows for the date for quite some time now. Here’s how the NSIDC 5 day average extent looks at the moment:
Meanwhile a series of storms in the North Atlantic have been bringing large surf to the shores of the Western United Kingdom, and battering the edge of the sea ice in the Greenland and Barents Seas. Here’s how GFS looks currently, as visualised by MeteoCiel:
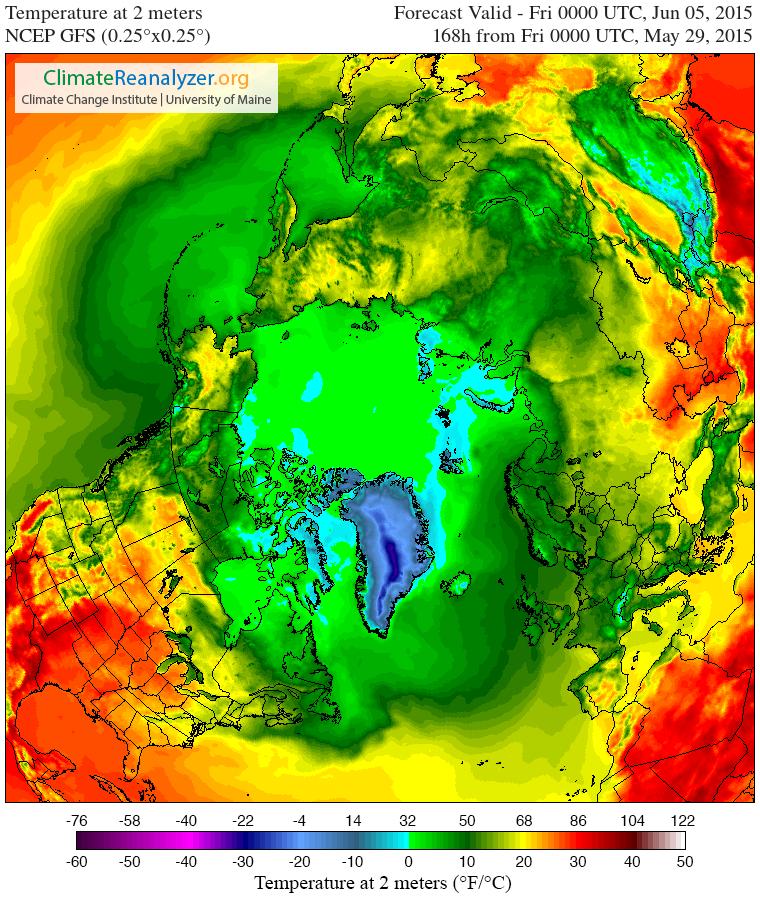
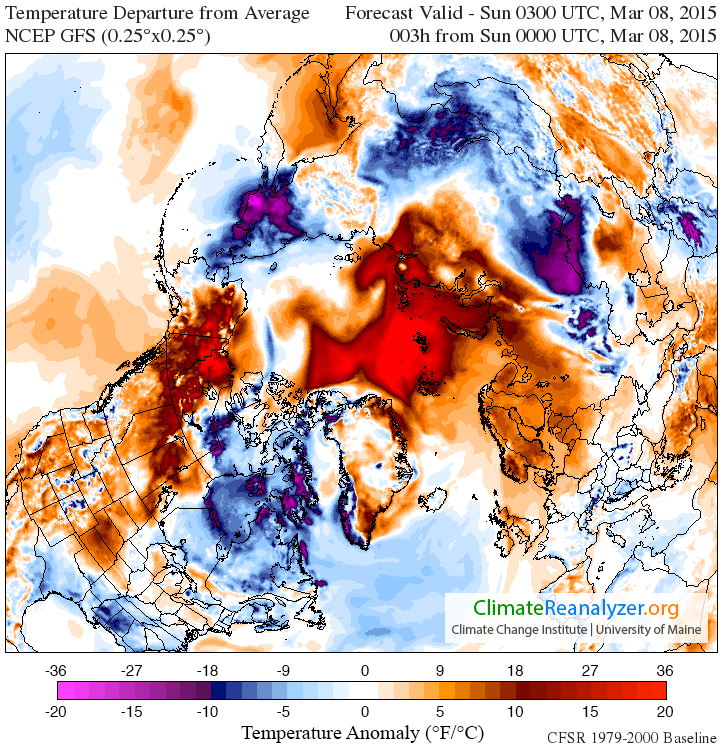
In addition this has resulted in warm air from further south being funnelled into the high Arctic, so much so that the surface temperature anomalies currently look like this:
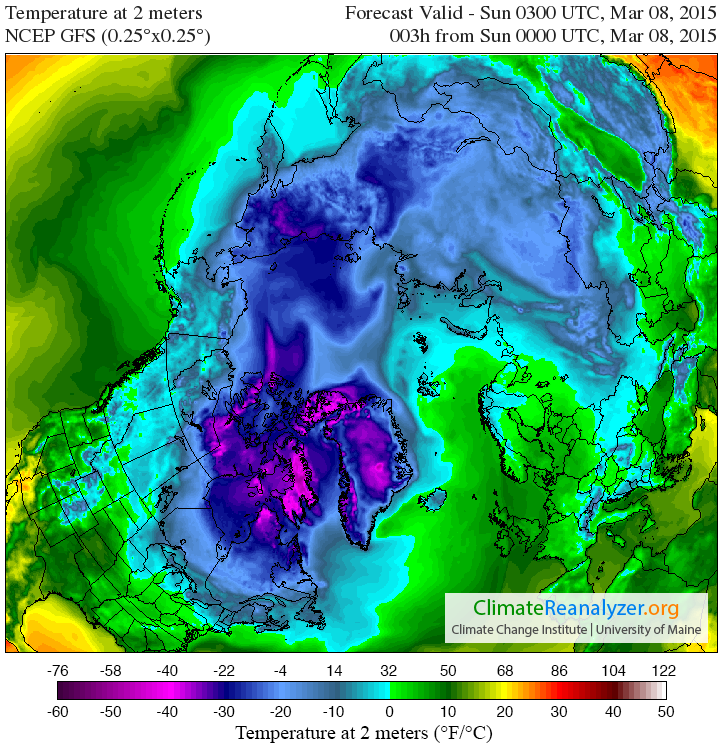
whilst the temperatures 2 metres above the surface of the Arctic look like this:
If you look closely you’ll see that air temperatures 2 metres above the North Pole are currently similar to those around the shores of the Great Lakes of North America. As a result of all this atmospheric activity today we bring you news that both the Danish Meteorological Institute “new” 15% extent:
and “old” 30% metrics:
have now joined the club.
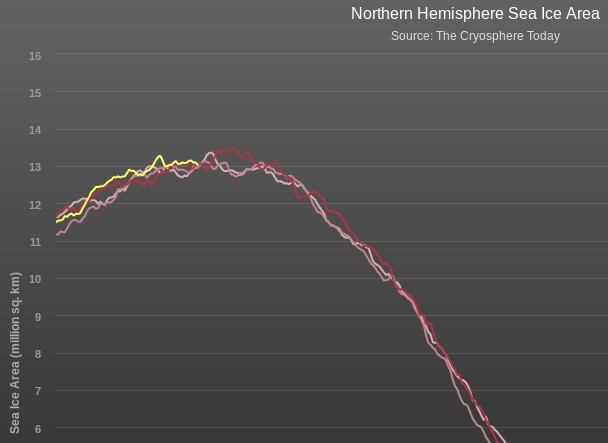
The Cryosphere Today area metric has been holding out against the trend in sea ice extent for weeks, but we can confidently predict that when their next update is released it too will also reveal the lowest ever Arctic sea ice area for the 65th day of the year, in records going back to 1979. Here’s how their graph looks currently:
This website uses cookies to improve your experience. We'll assume you're ok with this, but you can opt-out if you wish. Cookie settingsACCEPT
Privacy & Cookies Policy
Privacy Overview
This website uses cookies to improve your experience while you navigate through the website. Out of these, the cookies that are categorized as necessary are stored on your browser as they are essential for the working of basic functionalities of the website. We also use third-party cookies that help us analyze and understand how you use this website. These cookies will be stored in your browser only with your consent. You also have the option to opt-out of these cookies. But opting out of some of these cookies may affect your browsing experience.
Necessary cookies are absolutely essential for the website to function properly. This category only includes cookies that ensures basic functionalities and security features of the website. These cookies do not store any personal information.
Any cookies that may not be particularly necessary for the website to function and is used specifically to collect user personal data via analytics, ads, other embedded contents are termed as non-necessary cookies. It is mandatory to procure user consent prior to running these cookies on your website.