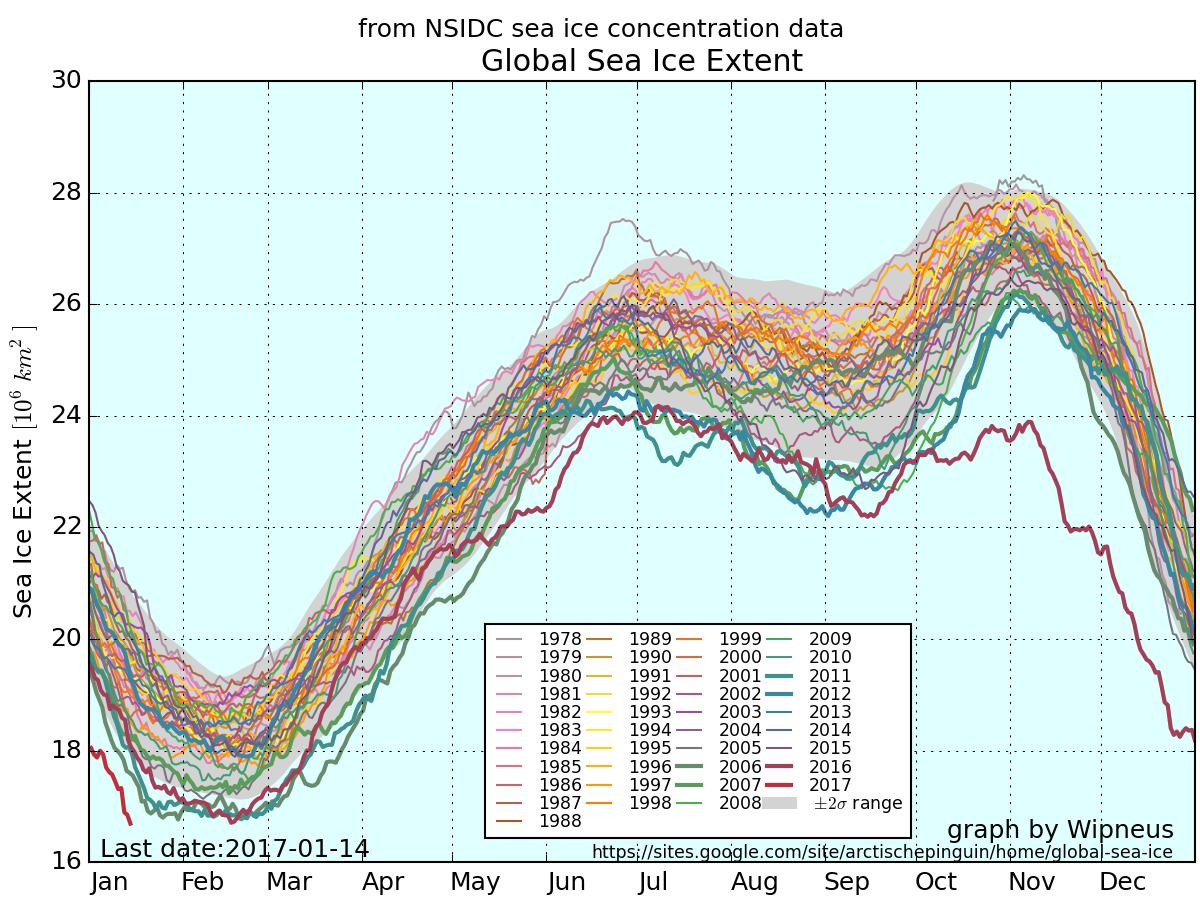
Here once again is the up to date version of Wipneus’ graphic graphic, this time of global sea ice extent:
As you can see, global sea ice extent has just reached the lowest ever level in the National Snow and Ice Data Center’s satellite records going back to 1979. It was over a month later when the previous record was broken in February 2016, so there is plenty of time for the metric to fall further.
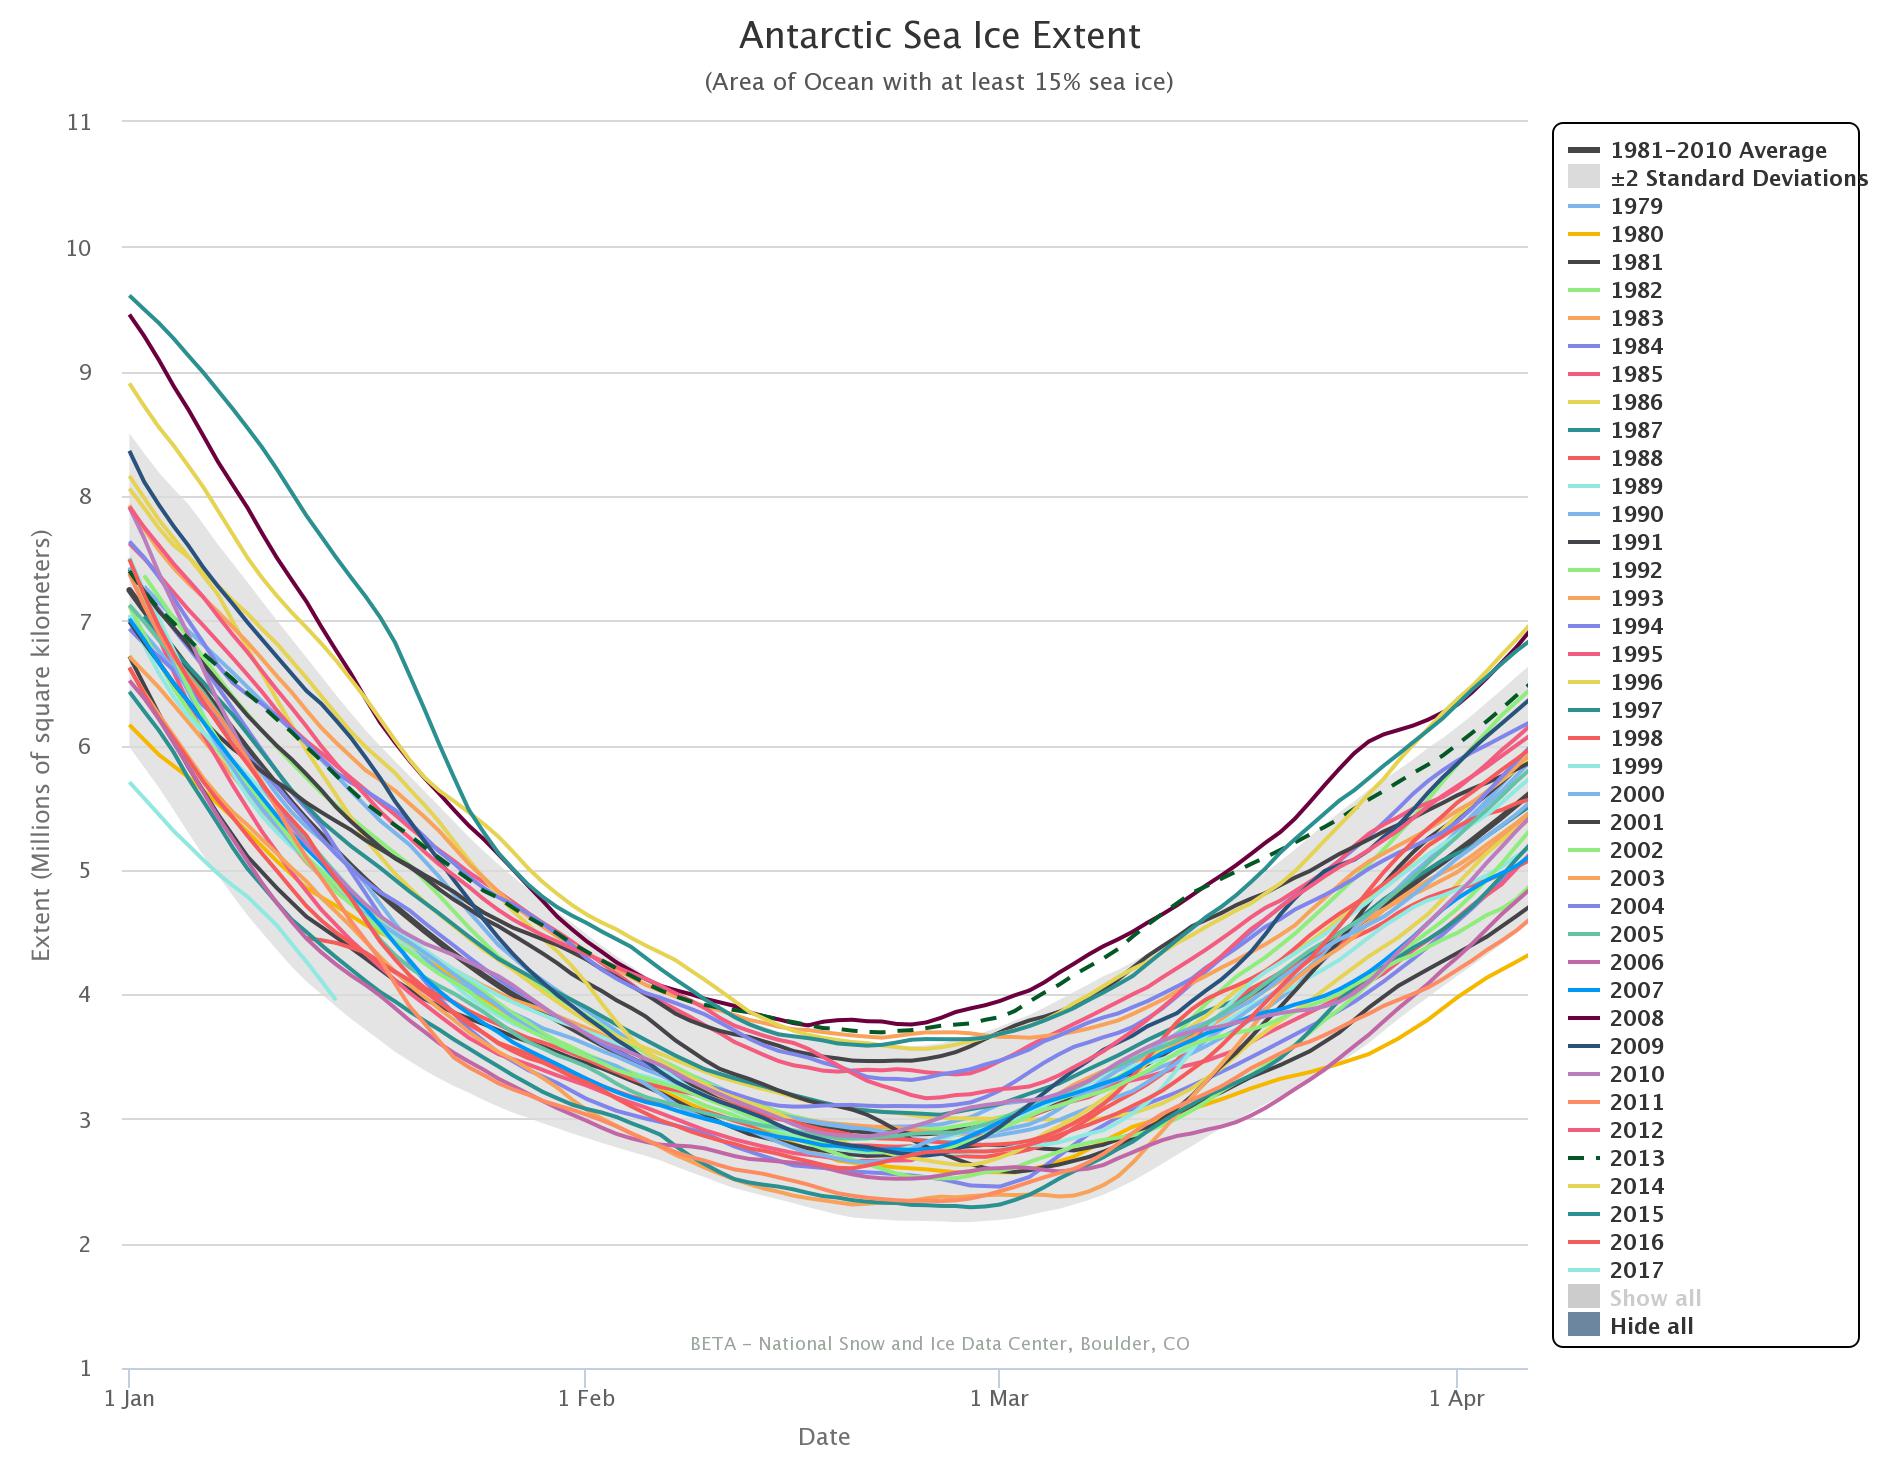
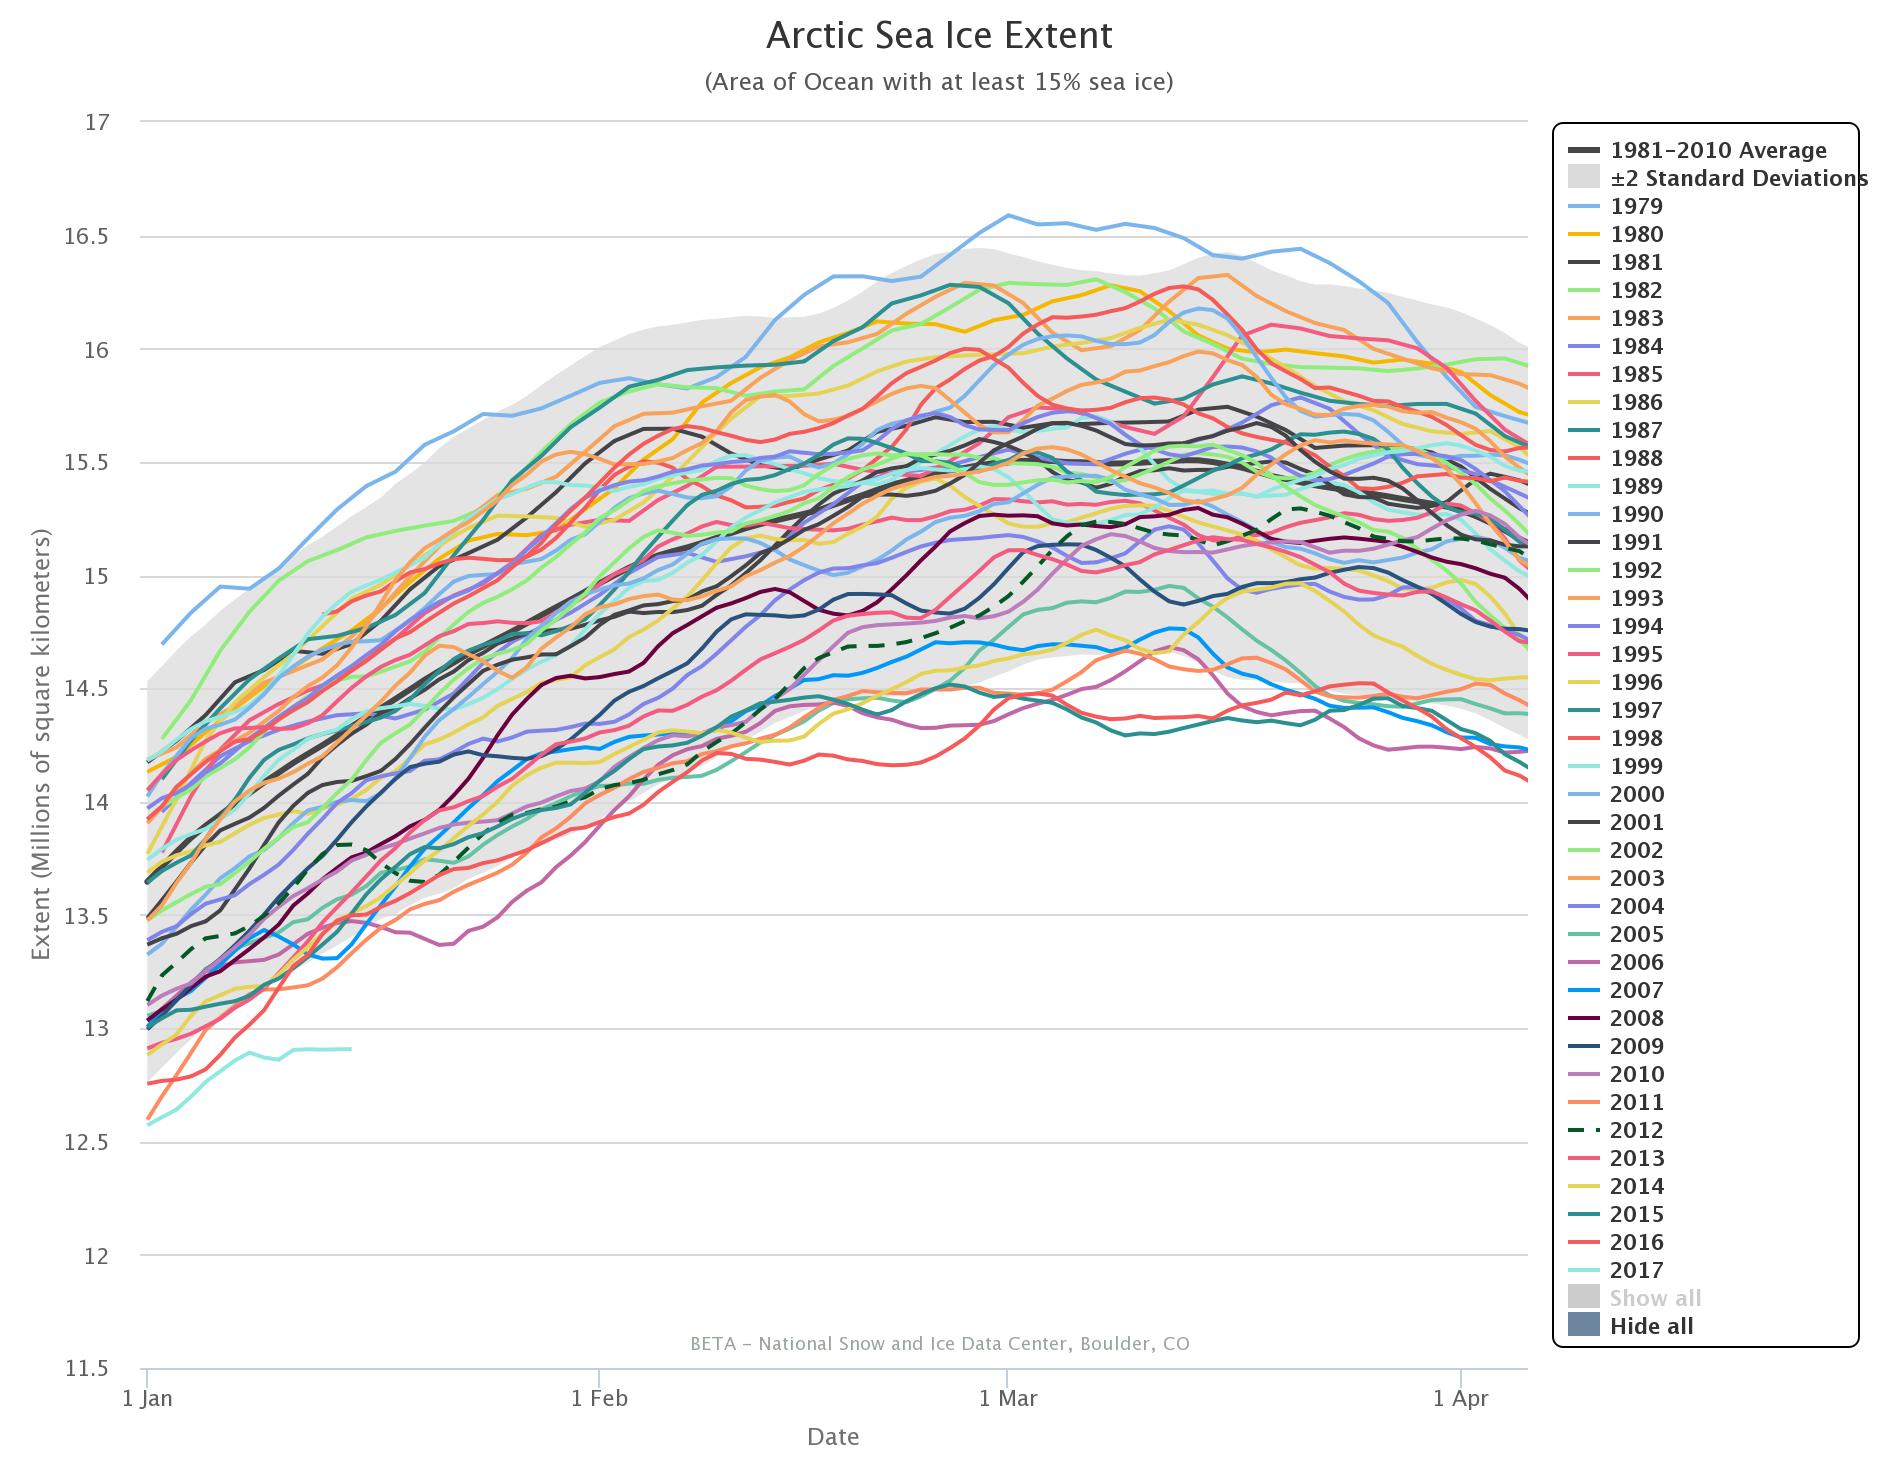
The 2017 curves in the NSIDC’s own extent graphs are coloured in a pale shade of blue. Even so they’re easy to pick out since both Antarctic and Arctic extent are at the lowest level for the date in NSIDC’s records by a considerable margin:
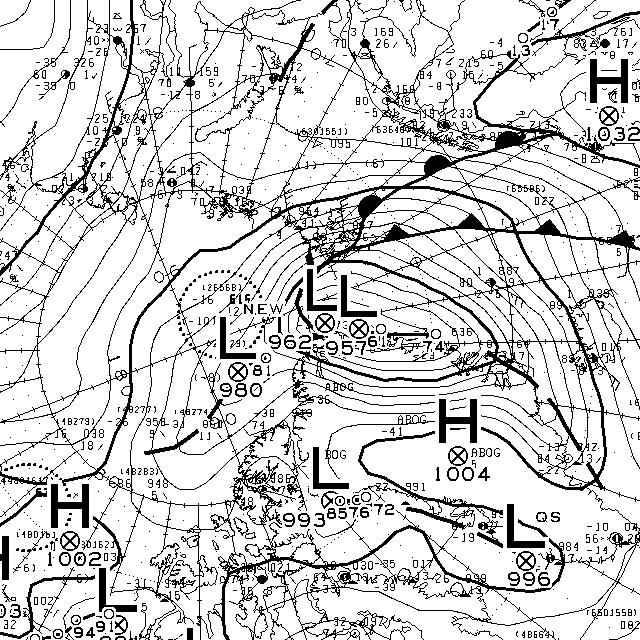
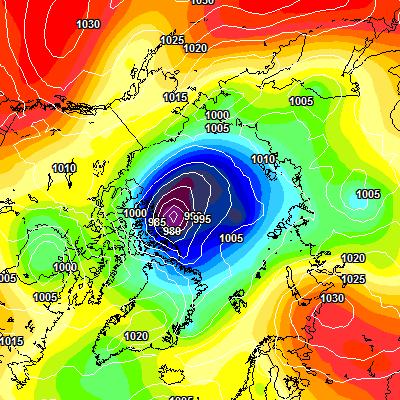
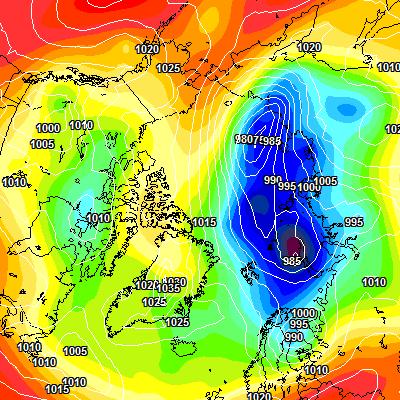
Antarctic sea ice extent is still falling, and the Arctic has been flatlining for several days now and more trouble is heading its way. Another Fram Strait cyclone is brewing, and this time around the storm’s minimum central pressure is already down to 957 hPa according to Environment Canada:
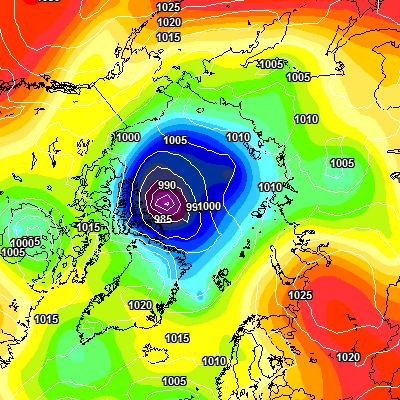
According to the current forecasts it will continue to spin over the central Arctic for several more days, driving export of sea ice via the Fram Strait:
A storm is brewing in the Arctic. A big one! The crew of the yacht Northabout are currently sailing along the western shore of the Laptev Sea and reported earlier today that:
The sea is calm. Tomorrow a gale 8. But this moment is perfect.
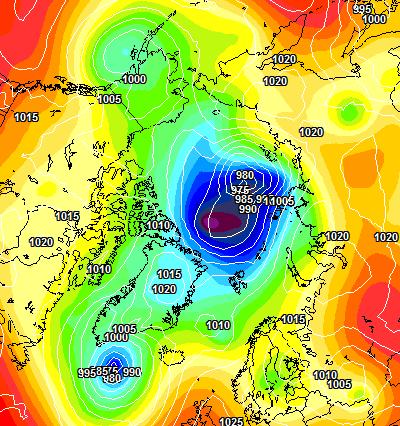
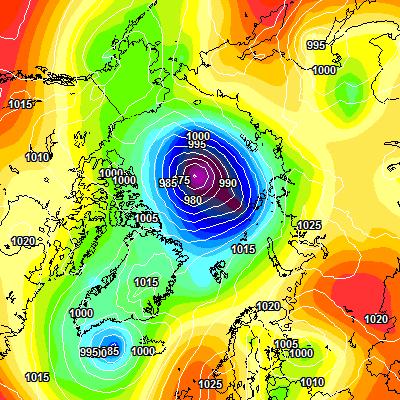
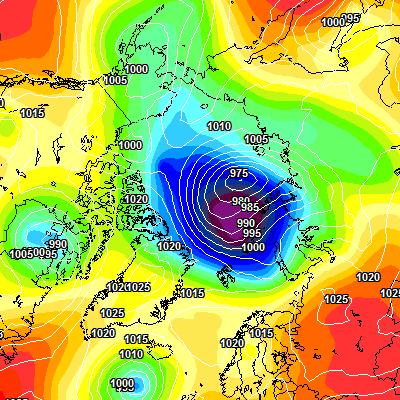
That perfect moment will not last long. Here is the current ECMWF forecast for midnight tomorrow:
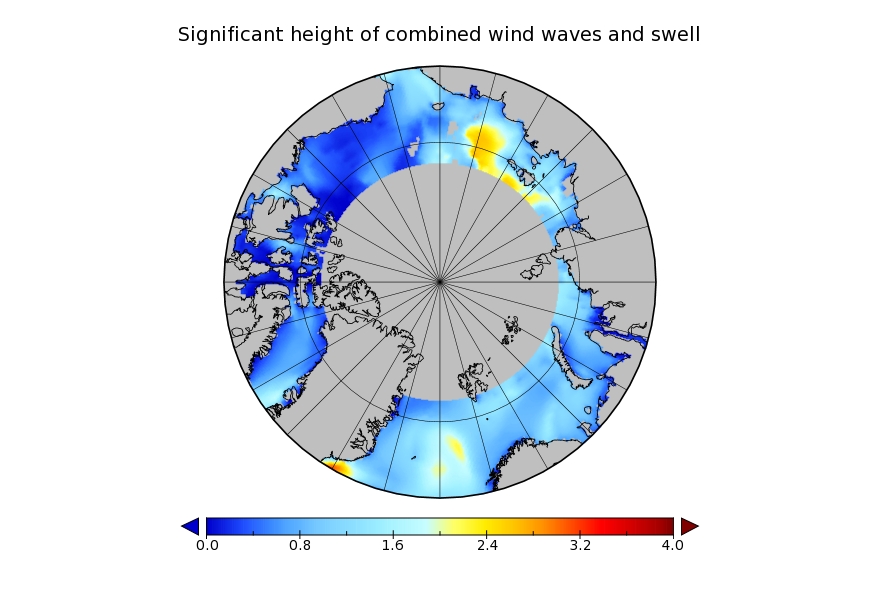
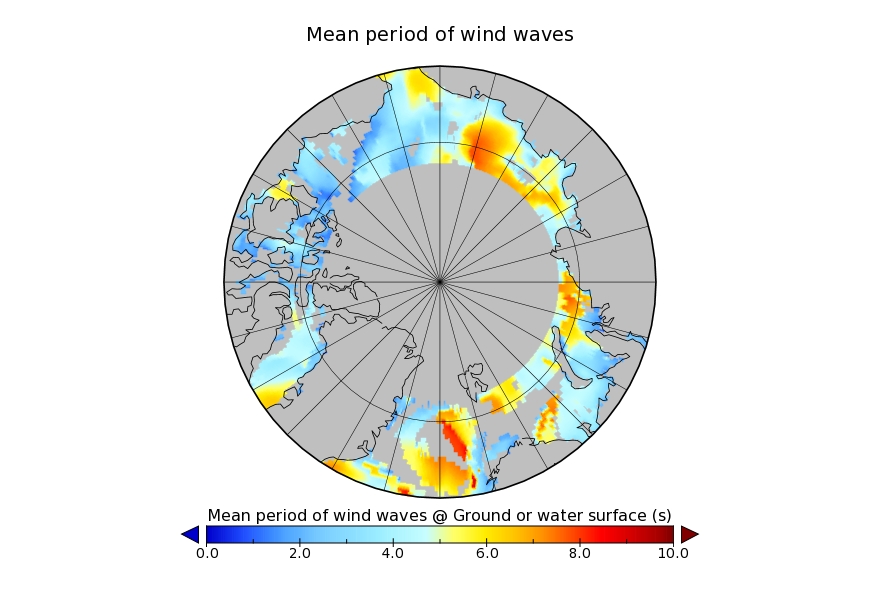
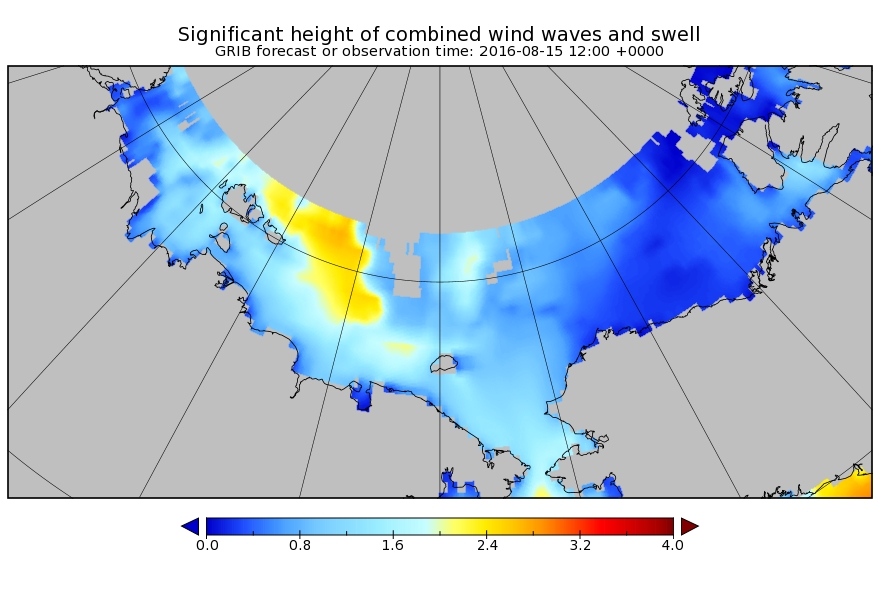
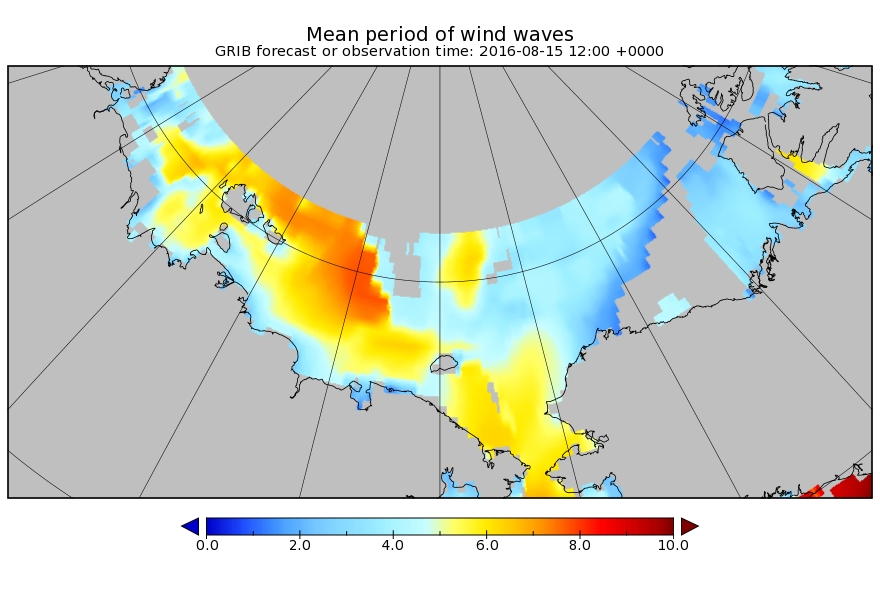
and here is the current Arctic surf forecast for 06:00 UTC on Monday:
A 975 hPa low pressure system will be creating 3 meter waves with a period of around 8 seconds heading across the East Siberian Sea in the direction of the ice edge. By midnight on Monday the cyclone is forecast to have deepened to a central pressure below 970 hPa:
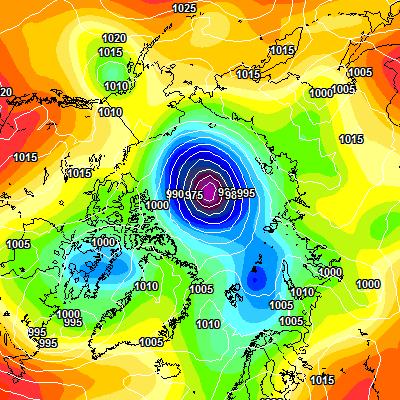
All of this is rather reminiscent of the “Great Arctic Cyclone” in the summer of 2012, which looked like this on August 7th:
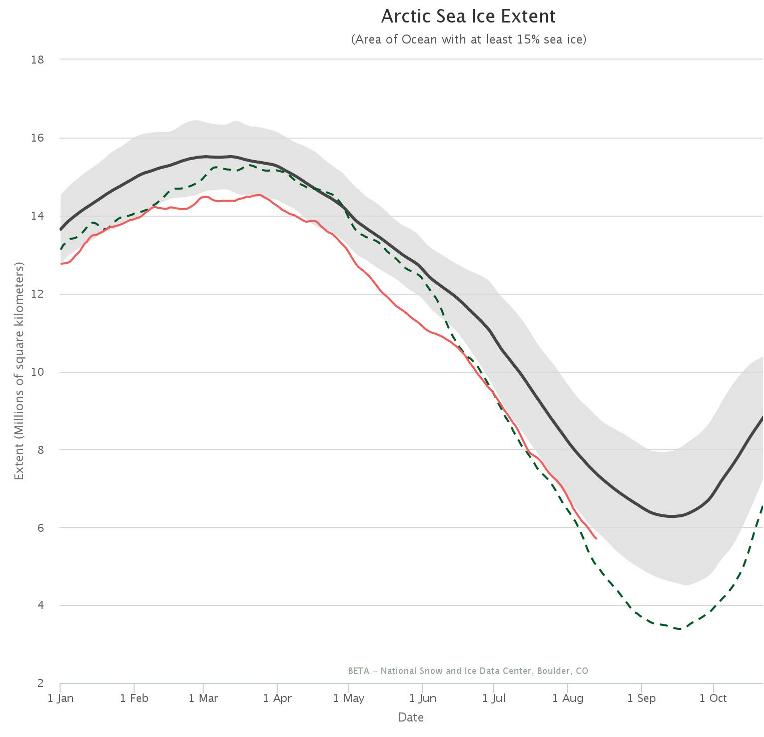
and which ultimately led to the lowest Arctic sea ice extent in the satellite record. Using the National Snow and Ice Data Center’s numbers that was 3.41 million square kilometers on September 16th 2012. Here’s the NSIDC’s current graph comparing 2012 with this year:
I wonder what the minimum for 2016 will be, and on what date?
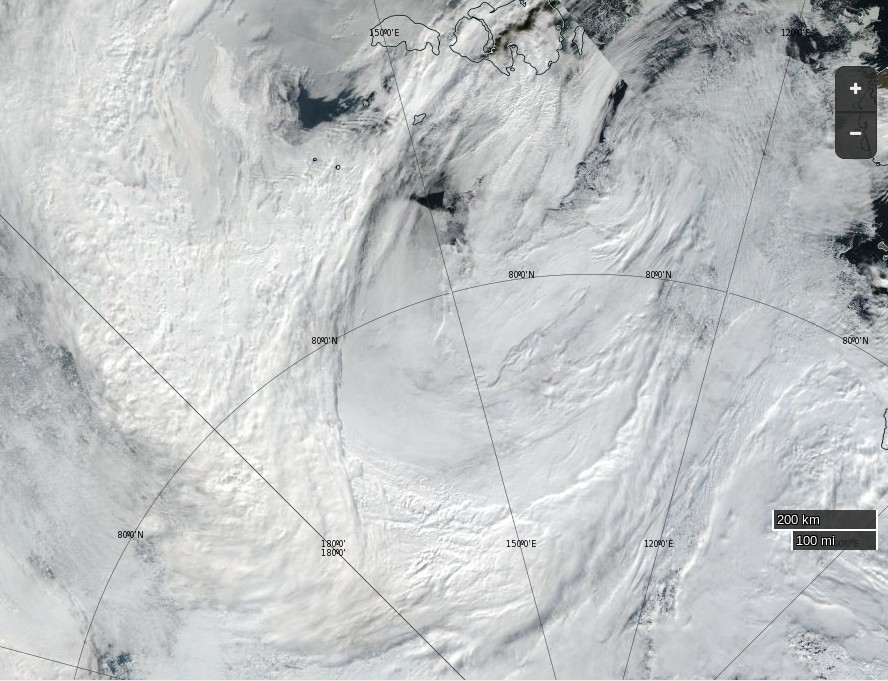
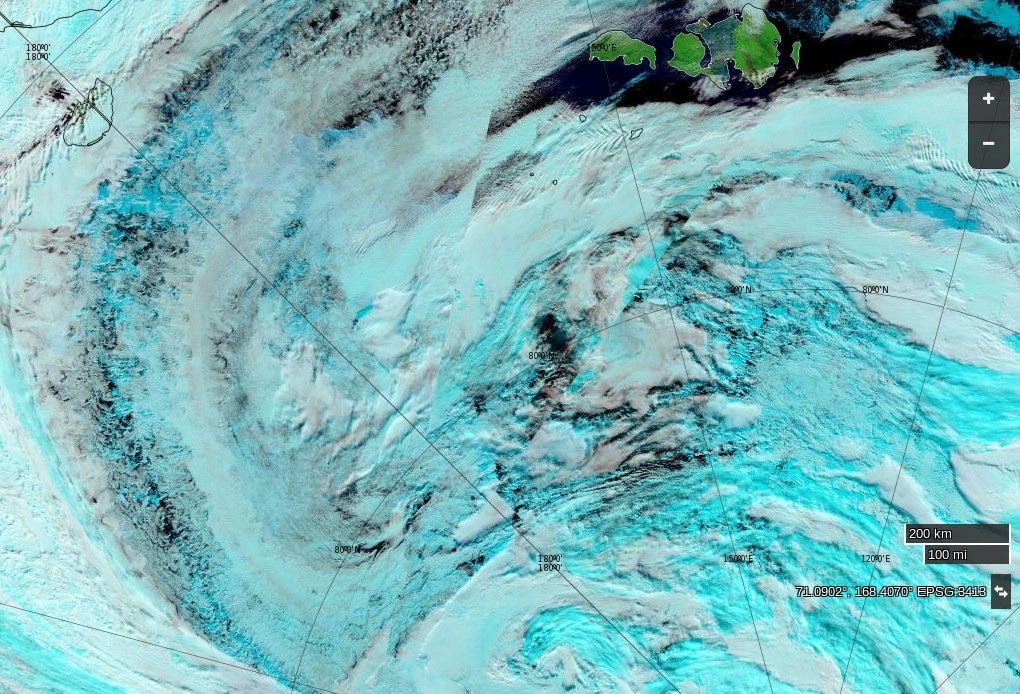
Here’s how the Great Arctic Cyclone of 2016 looks from on high this morning:
NASA Worldview “true-color” image of the ‘Great Arctic Cyclone’ on August 15th 2016, derived from the VIIRS sensor on the Suomi satellite
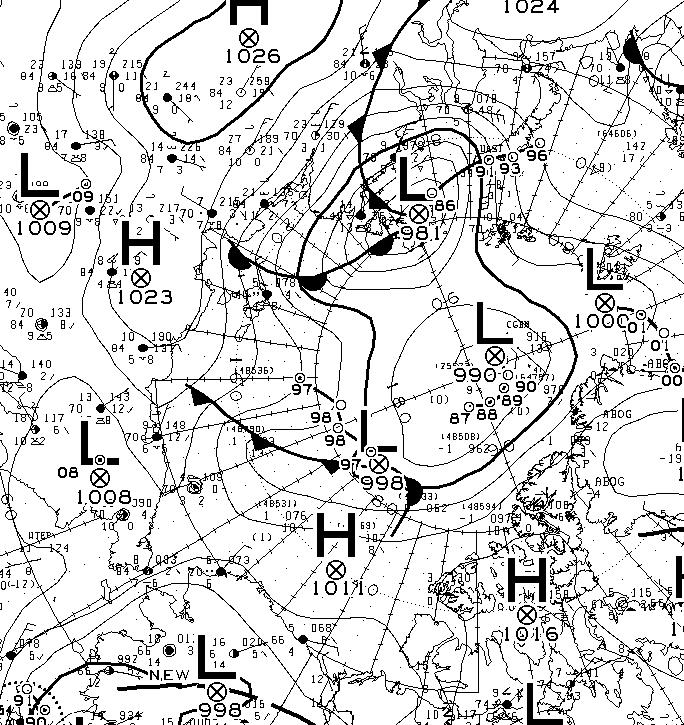
The latest synopsis from Environment Canada shows that the central pressure of the cyclone is now down to 974 hPa:
The WaveWatch III forecast for noon today UTC confirms the forecast of two days ago:
P.S. The Canadian 0600Z synopsis has the cyclone’s SLP down to 971 hPa:
[Edit – August 16th]
This morning the cyclone’s SLP is down to 969 hPa:
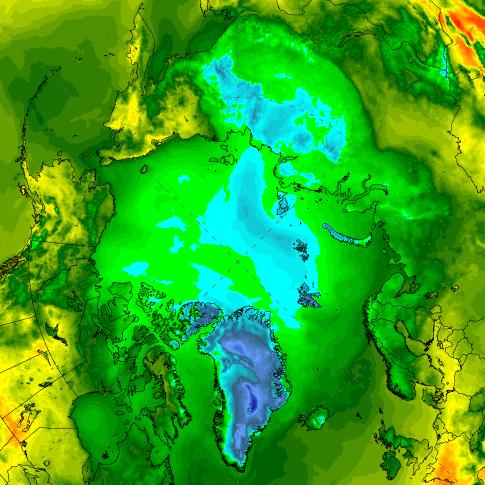
and the clouds over the Central Arctic are parting:
NASA Worldview “false-color” image of the Arctic Basin on August 16th 2016, derived from the MODIS sensor on the Terra satellite
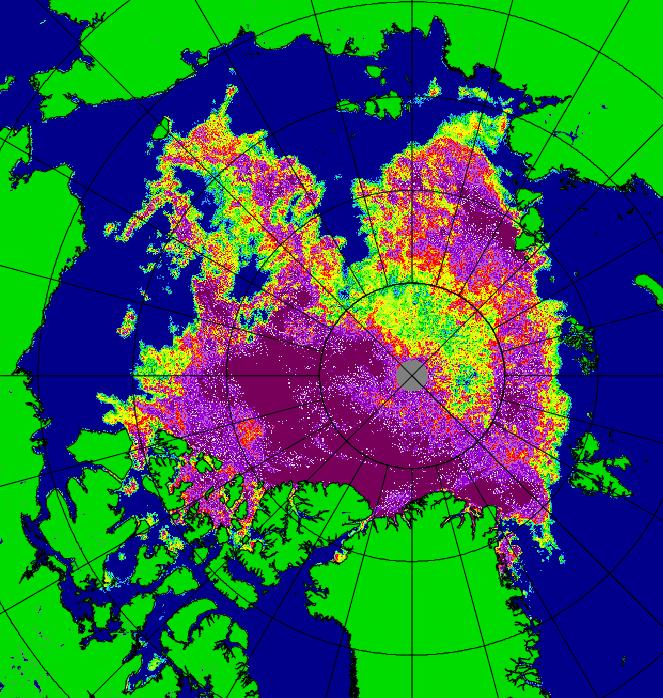
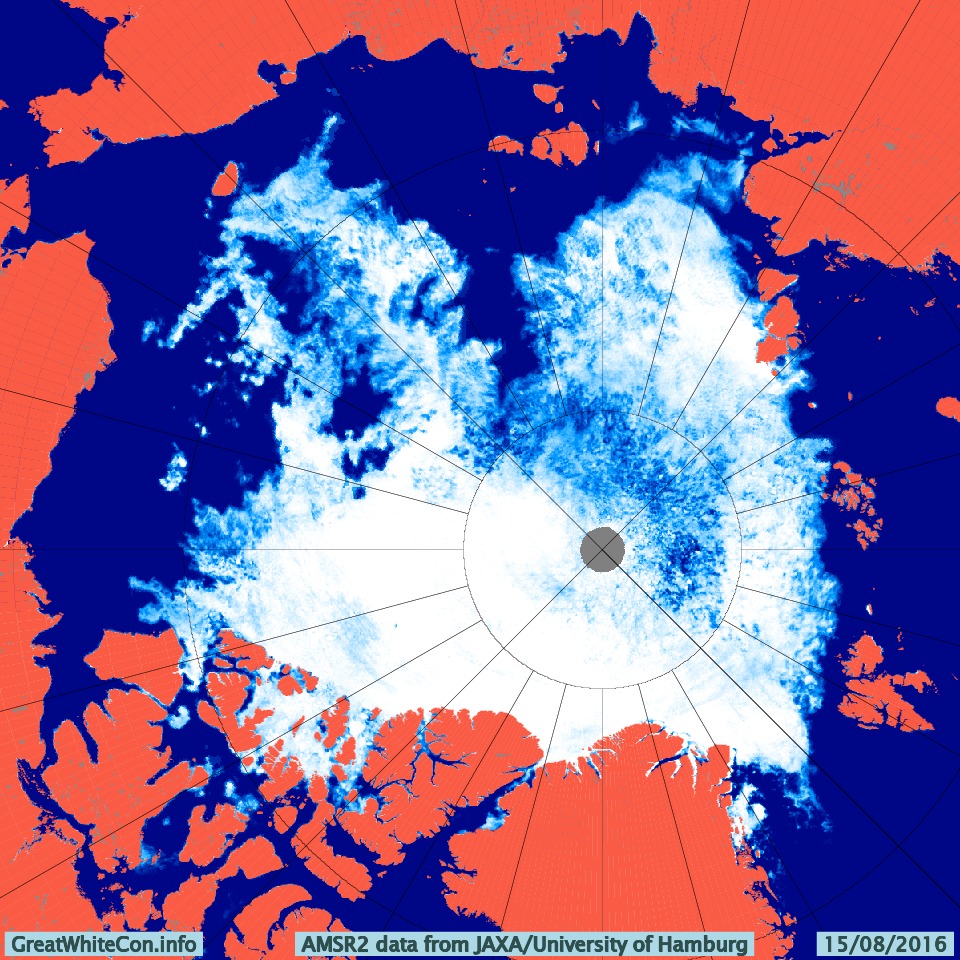
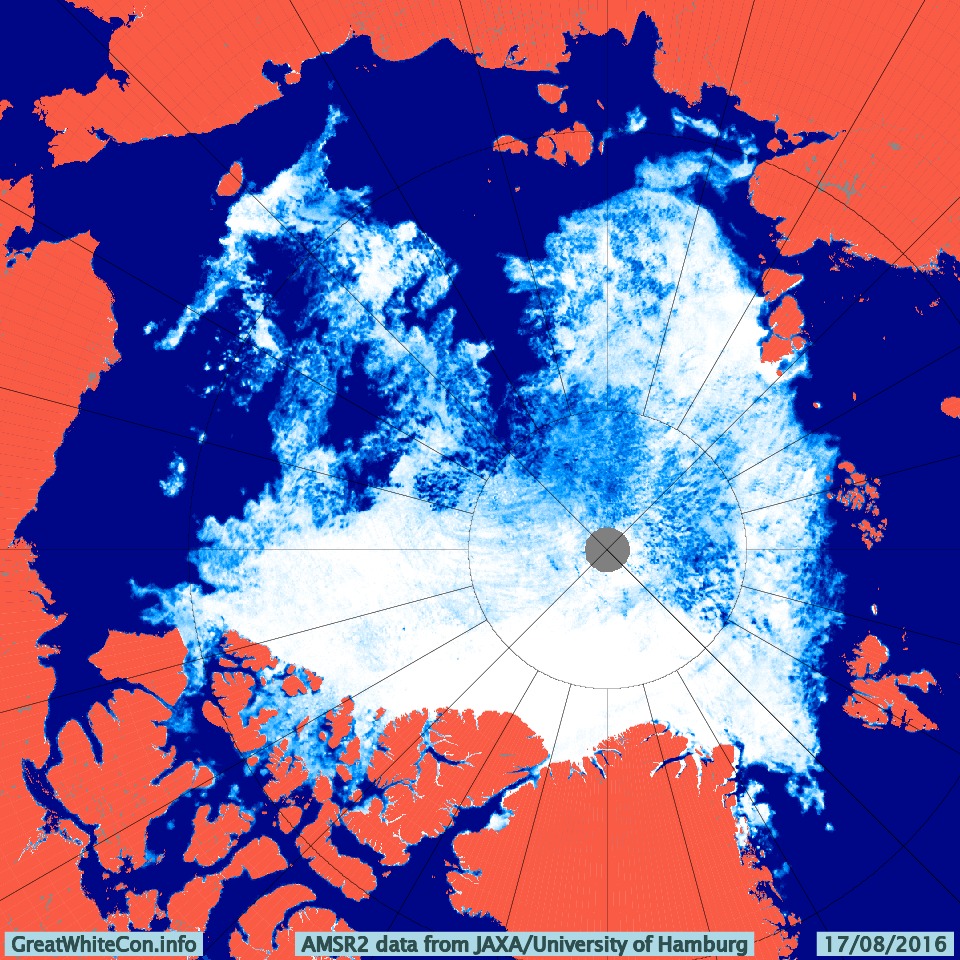
Our favourite method of seeing through the clouds using the AMSR2 maps from the University of Hamburg doesn’t seem to working at the moment, so here’s one from the University of Bremen instead:
The cyclone central pressure is now up to 983 hPa, and some indications of the effect it has had on the sea ice in the Arctic are being revealed:
[Edit – August 19th]
According to Environment Canada the cyclone’s central pressure rose to 985 hPa earlier today:
However the 987 hPa low near the Canadian Arctic Archipelago is currently forecast to deepen below 980 hPa over the next 24 hours. Here’s the ECMWF forecast for first thing tomorrow morning:
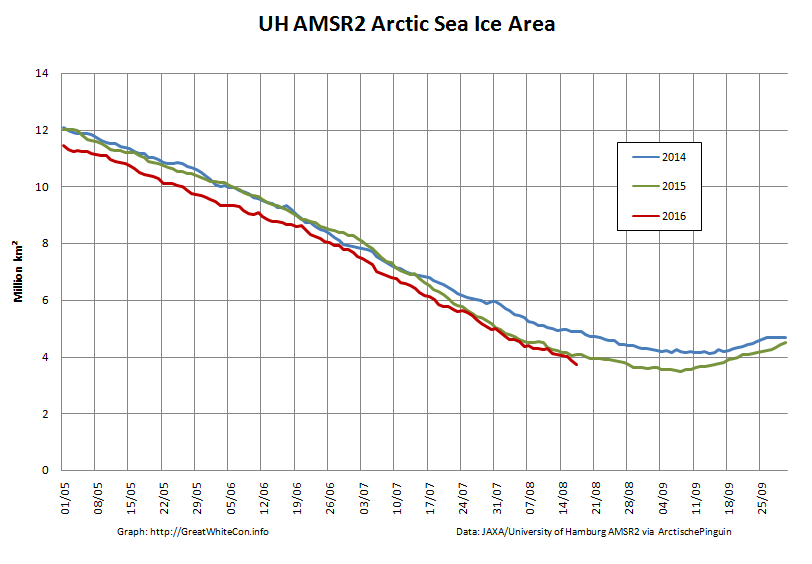
The high resolution AMSR2 Arctic sea ice area has reduced by another 133.5 thousand square kilometers since yesterday. A similar drop tomorrow will take us below the 2015 minimum.
[Edit – August 19th PM]
The MSLP of the rejuvenated cyclone had dropped to 976 hPa by 12:00 UTC today:
The ECMWF forecast for lunchtime tomorrow is for something similar:
[Edit – August 20th]
The current incarnation of the cyclone bottomed out at 971 hPa near the Canadian Arctic Archipelago:
The 72 hour forecast from ECMWF for the next phase of GAC 2016 is beginning to enter the realms of plausibility. Here’s what it reveals:
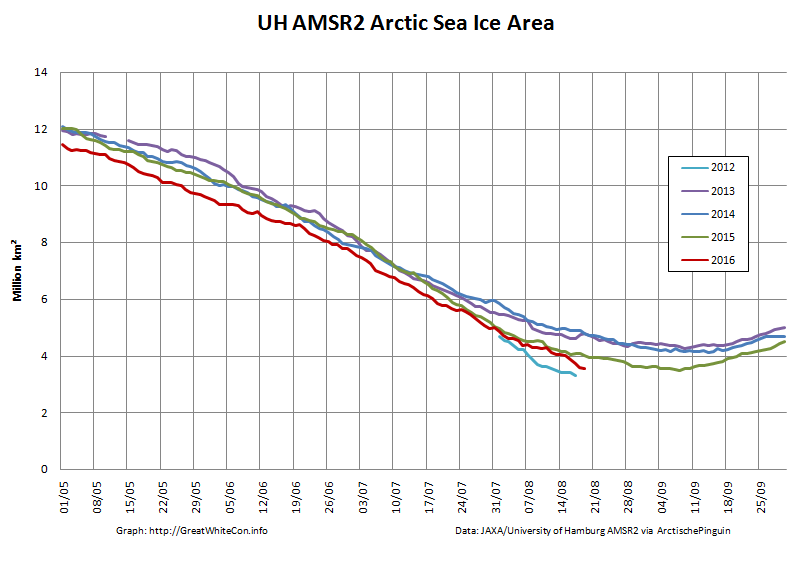
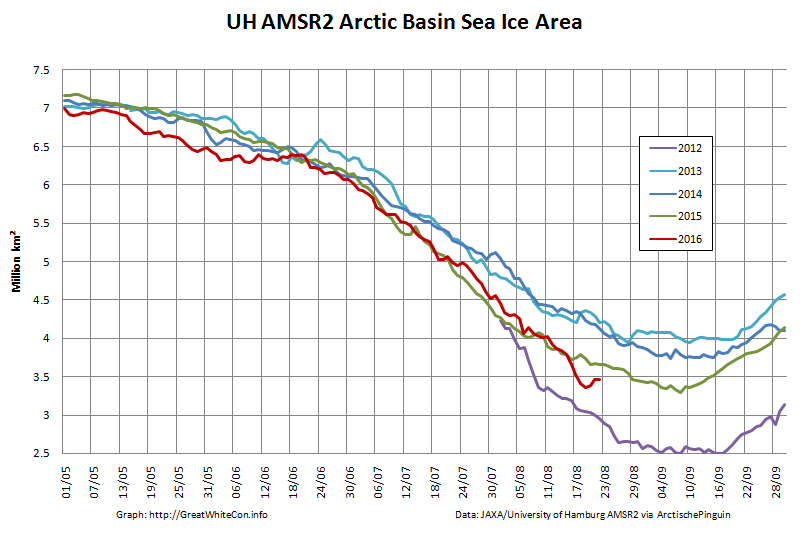
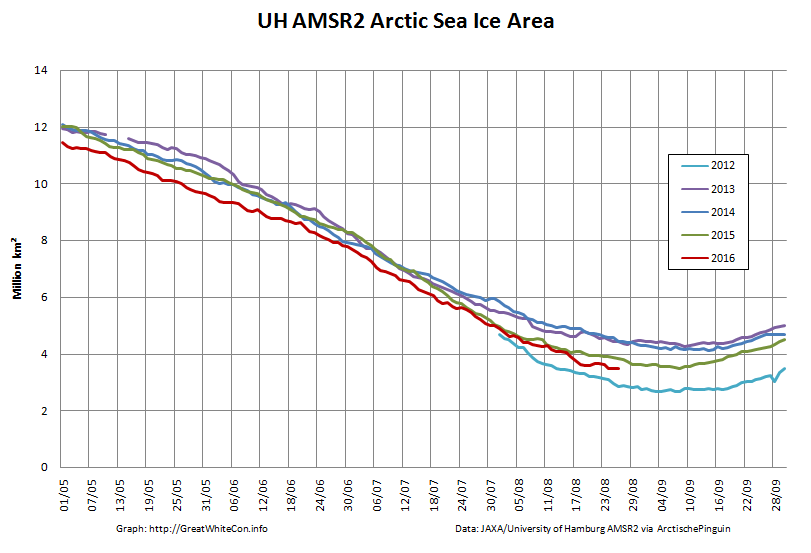
The University of Hamburg have been processing more AMSR2 data from 2012. You can argue until the cows come home about which is the best metric to peruse at this time of year, but try this one for size:
That’s the high resolution AMSR2 sea ice area for the Arctic Basin, comprising the CAB plus Beaufort, Chukchi, East Siberian and Laptev Seas.
[Edit – August 25th]
There’s a bit of a gap in the clouds over the Central Arctic today:
NASA Worldview “true-color” image of the Central Arctic Basin on August 25th 2016, derived from the MODIS sensor on the Terra satellite
This is merely the calm before the next storm. Here is the current ECMWF forecast for Saturday lunchtime (UTC):
Low pressure on the Siberian side of the Arctic and high pressure on the Canadian side producing an impressive dipole with lots of sea ice “drift” towards the Atlantic:
[Edit – August 27th]
Saturday morning has arrived, and so has the predicted storm. As the centre of the cyclone crossed the coast of the East Siberian Sea its central pressure had fallen to 967 hPa, whilst the high pressure over Alaska had risen to 1028 hPa:
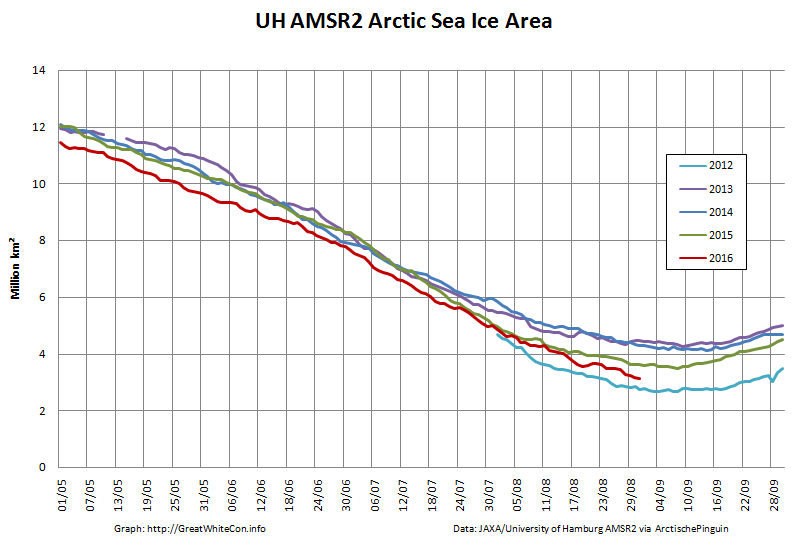
The effect of the earlier bursts of high wind is apparent in the high resolution AMSR2 sea ice area graph:
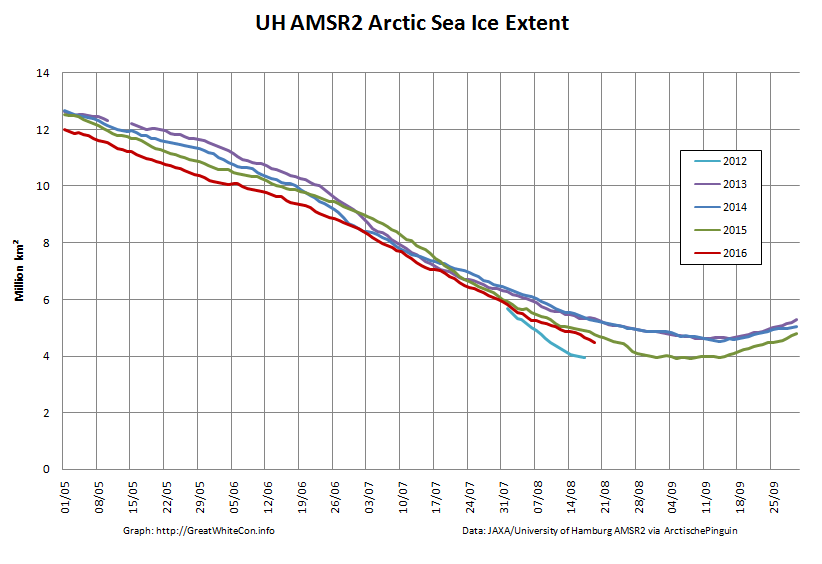
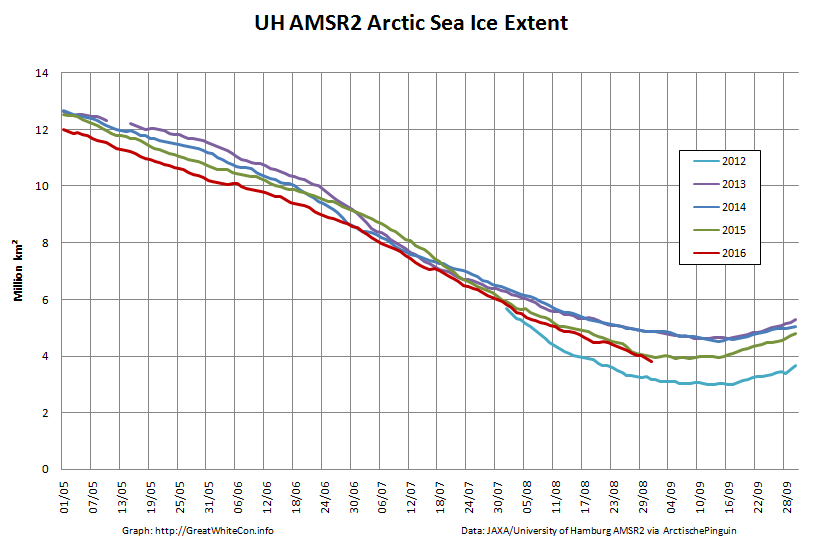
However they are not as apparent in the corresponding extent graph:
[Edit – August 28th]
As the centre of the cyclone heads for the North Pole the isobars are tightening across the last refuge of multi-year sea ice north of the Canadian Arctic Archipelago and Greenland:
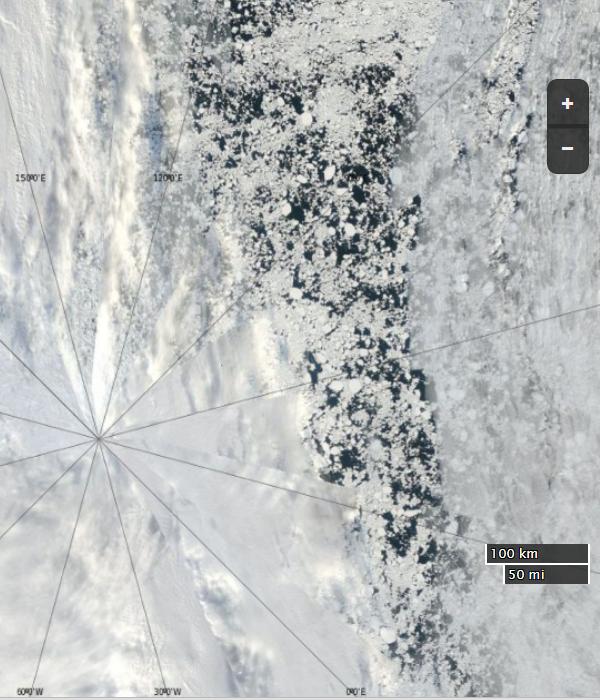
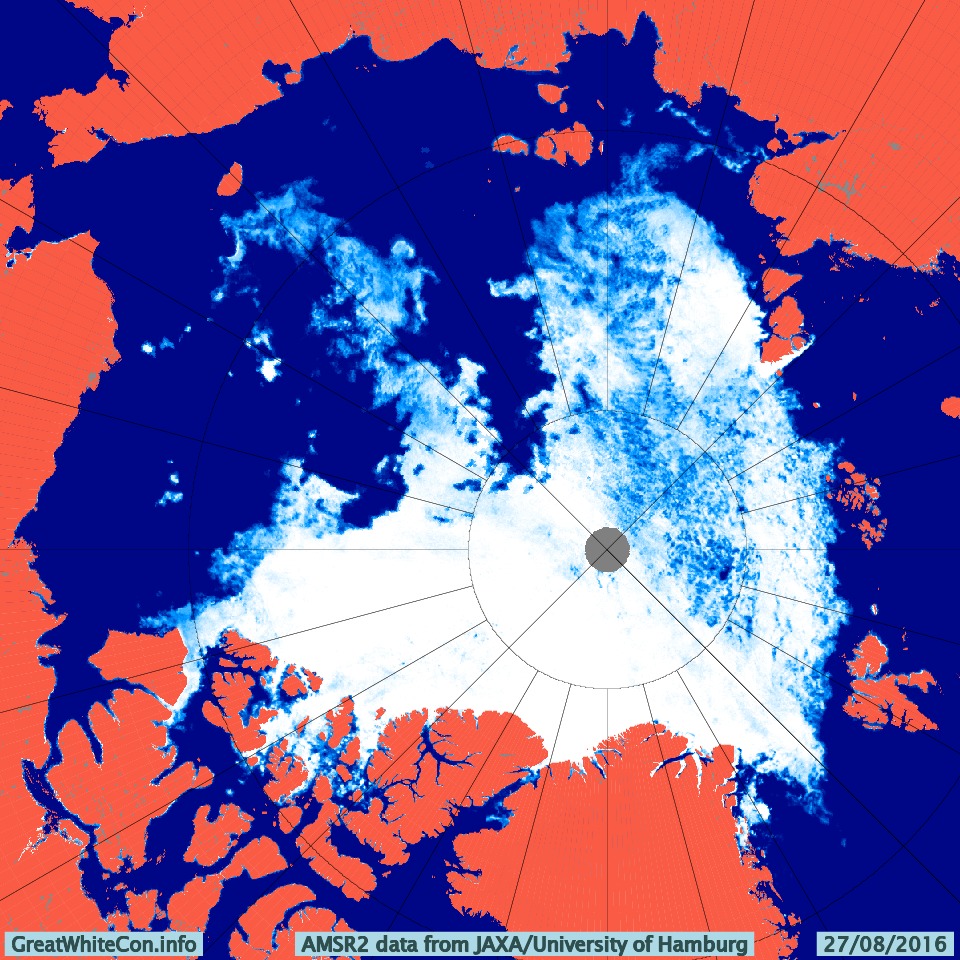
The area north of the East Siberian Sea that was predicted to bear the brunt of the wind and waves overnight is still covered in cloud. However the latest AMSR2 update from the University of Hamburg suggests that open water now stretches as far as 86 degrees north:
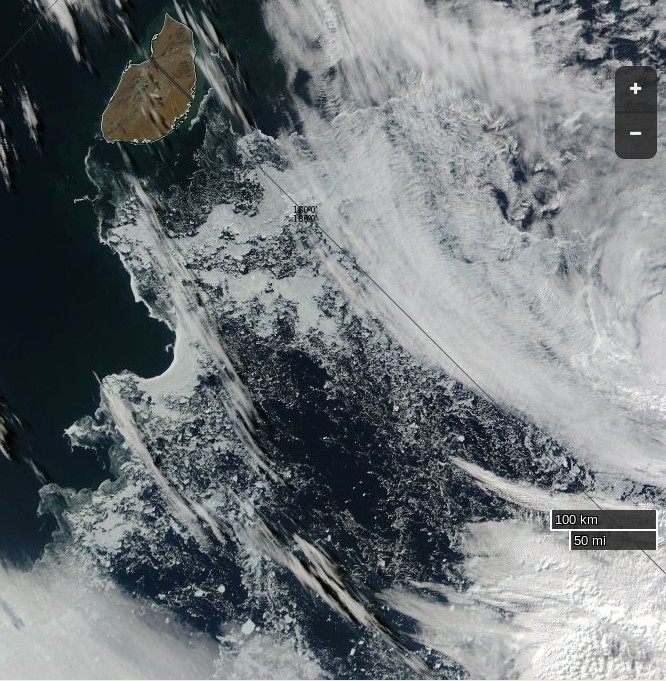
The skies over the northern Chukchi Sea have cleared to reveal this:
NASA Worldview “true-color” image of the northern Chukchi Sea on August 28th 2016, derived from the MODIS sensor on the Aqua satellite
[Edit – August 29th]
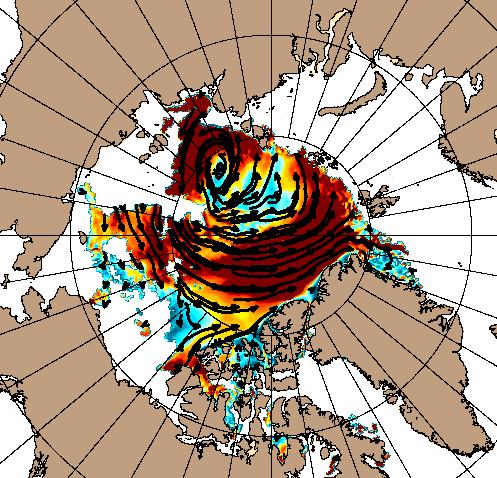
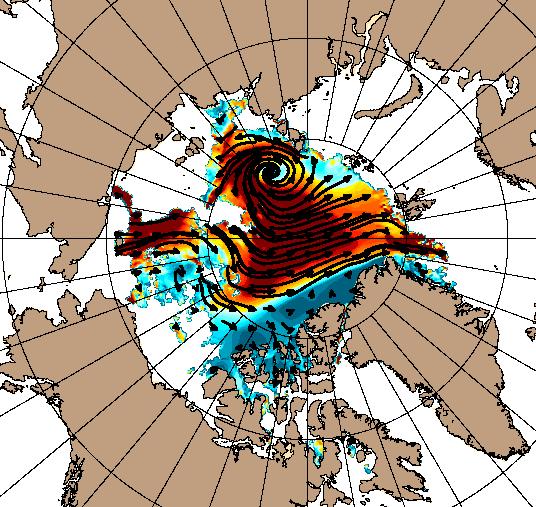
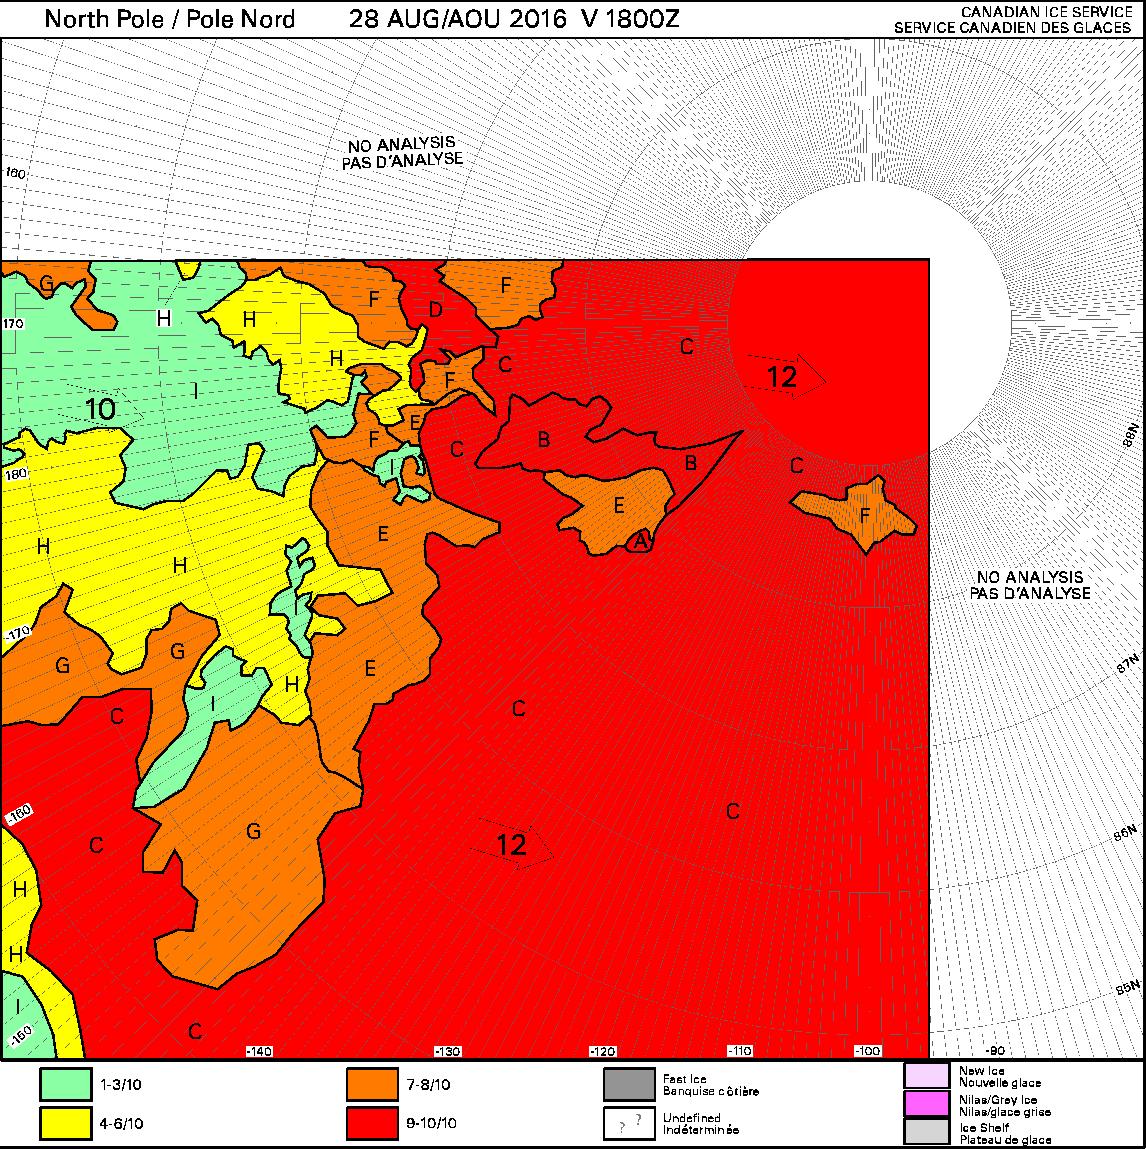
Some of the effects of the recent high winds can be judged by this Canadian Ice Service chart of ice concentration near the North Pole:
[Edit – September 1st]
Arctic sea ice area continues to fall quickly for the time of year:
The recent dipole has finally caused some compaction of the scattered sea ice. Hence the high resolution AMSR2 extent is following suit and is now below last year’s minimum:
This website uses cookies to improve your experience. We'll assume you're ok with this, but you can opt-out if you wish. Cookie settingsACCEPT
Privacy & Cookies Policy
Privacy Overview
This website uses cookies to improve your experience while you navigate through the website. Out of these, the cookies that are categorized as necessary are stored on your browser as they are essential for the working of basic functionalities of the website. We also use third-party cookies that help us analyze and understand how you use this website. These cookies will be stored in your browser only with your consent. You also have the option to opt-out of these cookies. But opting out of some of these cookies may affect your browsing experience.
Necessary cookies are absolutely essential for the website to function properly. This category only includes cookies that ensures basic functionalities and security features of the website. These cookies do not store any personal information.
Any cookies that may not be particularly necessary for the website to function and is used specifically to collect user personal data via analytics, ads, other embedded contents are termed as non-necessary cookies. It is mandatory to procure user consent prior to running these cookies on your website.