Tag Archives: Andrew Slater

Facts About the Arctic in August 2020

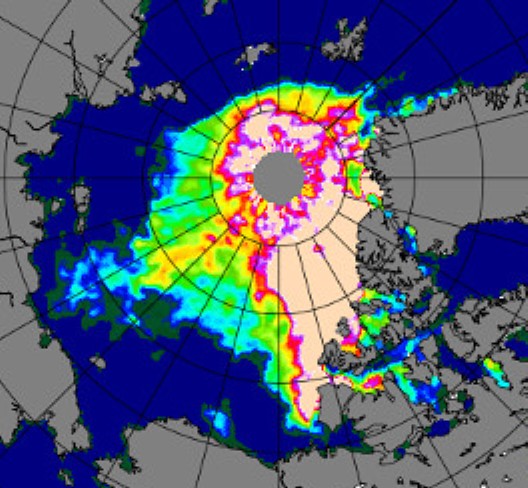
A new month begins today, and at the moment it looks as though it’s going to be the most interesting one since August 2012. Here once again is the satellite image of the enormous cyclone that was spinning over the Beaufort/Chukchi Seas just a few days ago:

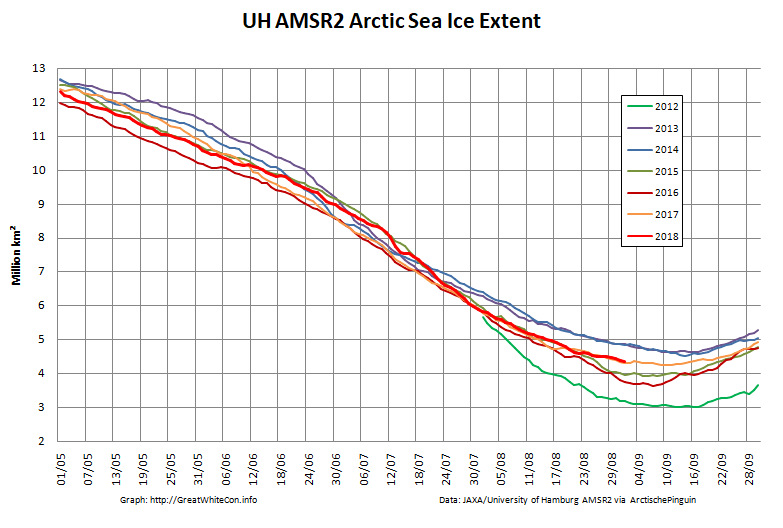
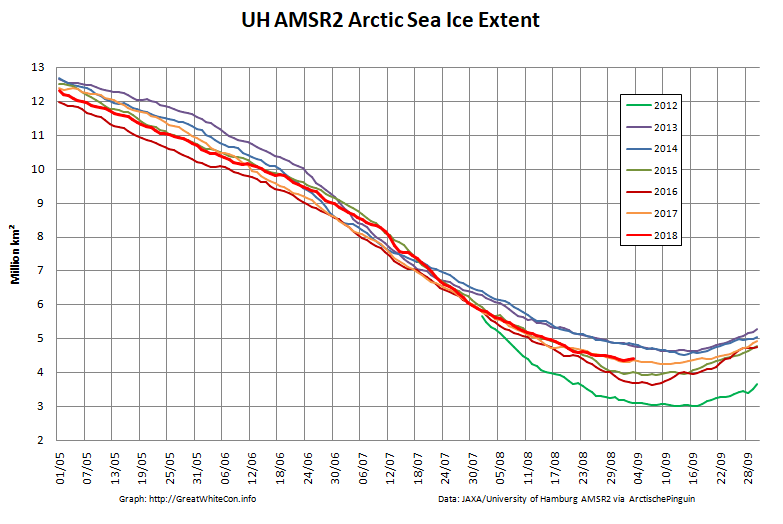
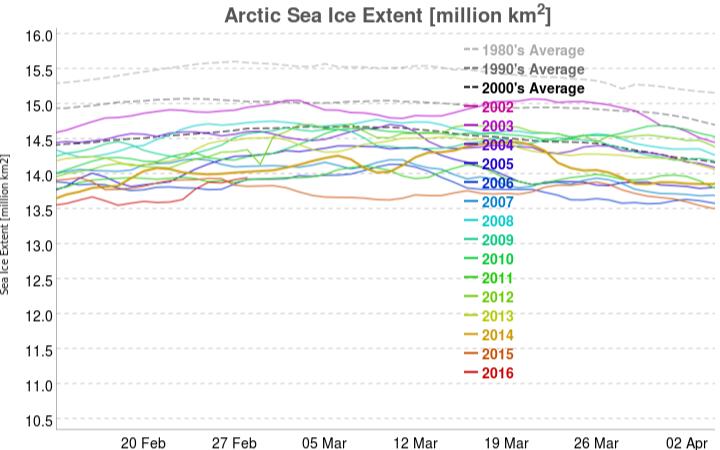
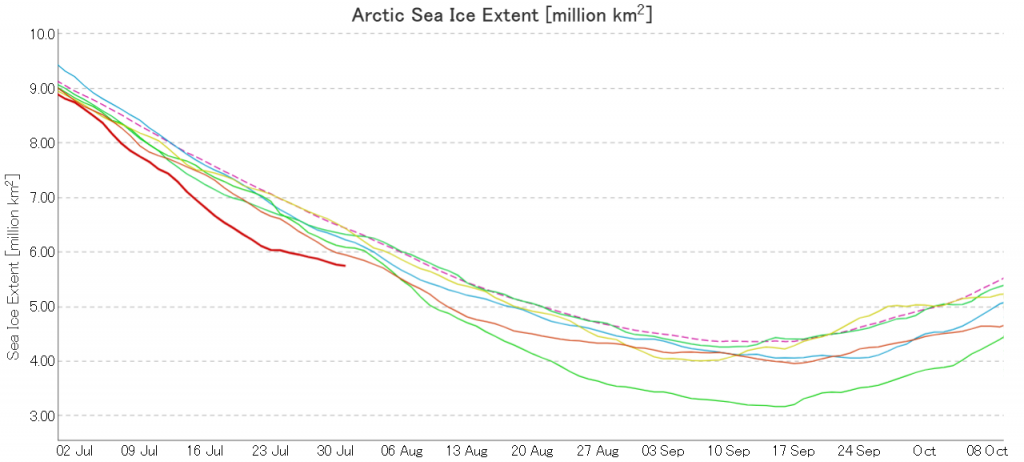
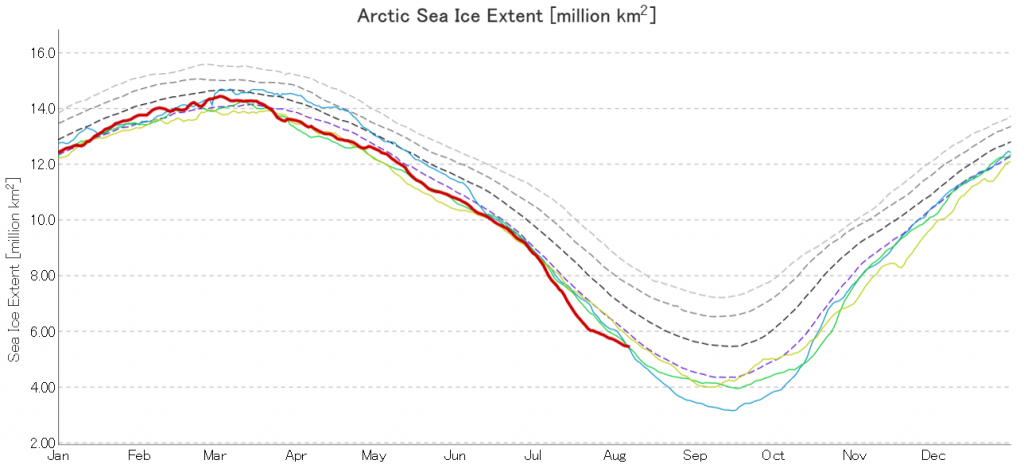
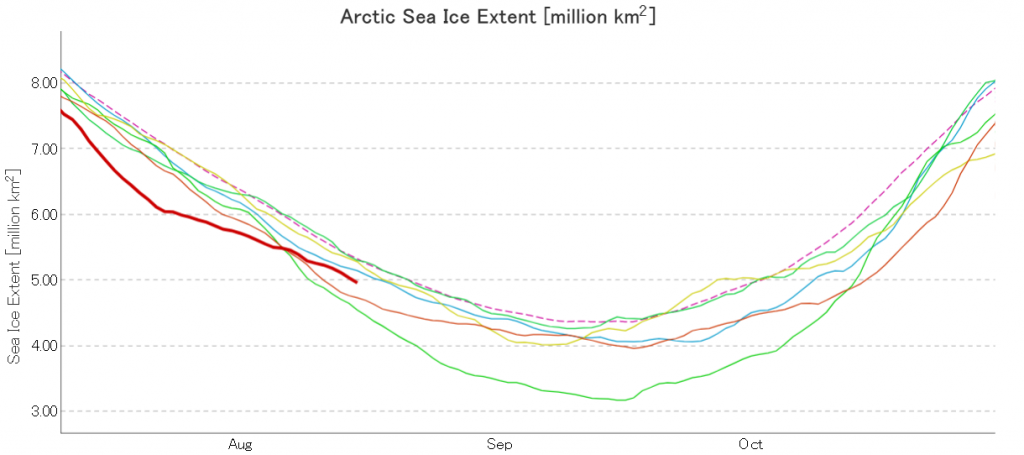
Here too is the effect of the cyclone on the trajectory of the JAXA Arctic sea ice extent graph:

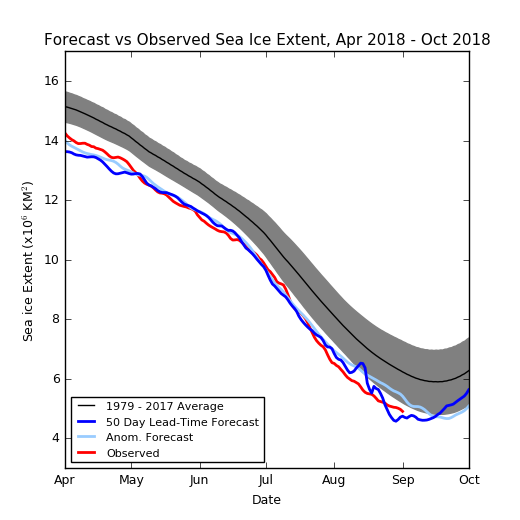
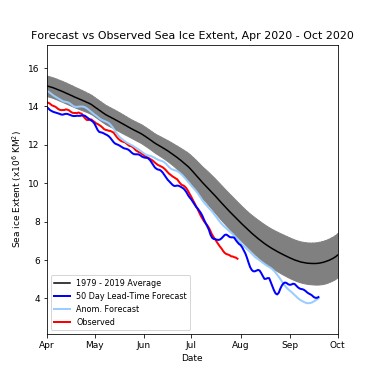
Here too is the current prognosis of the late Andrew Slater’s “Slater Probabilistic Ice Extent” 50 day forecast:

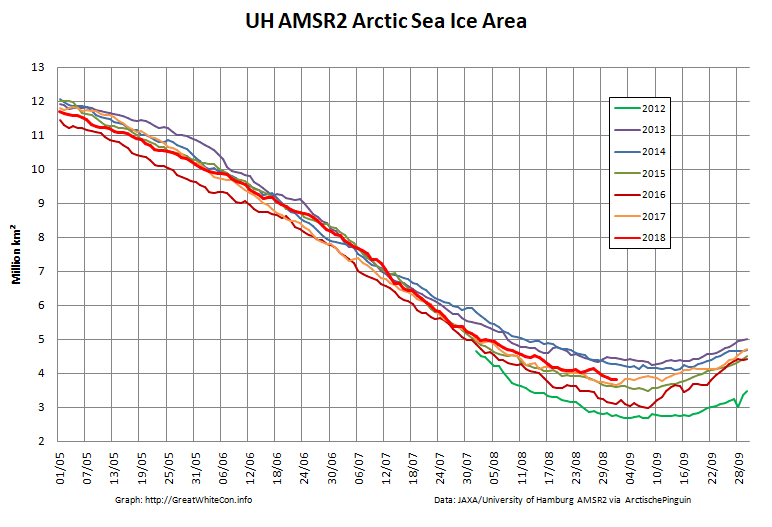
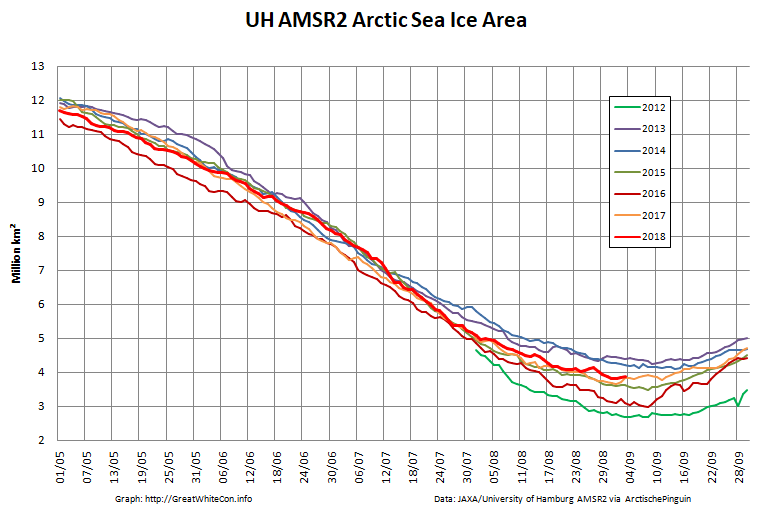
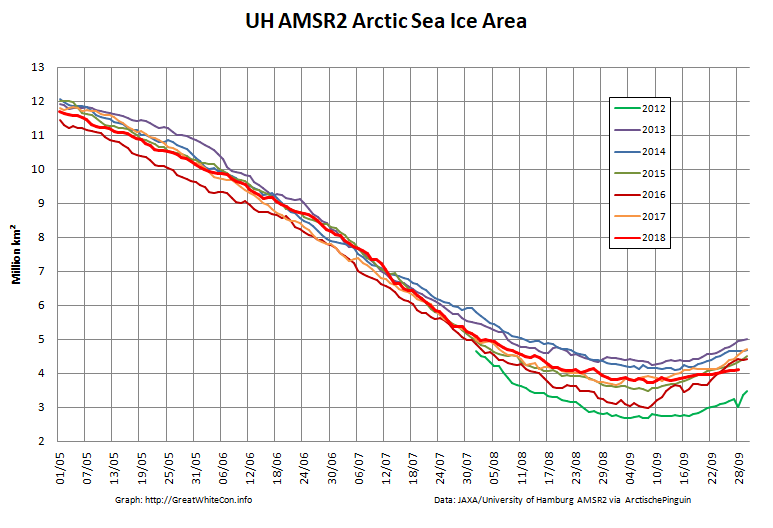
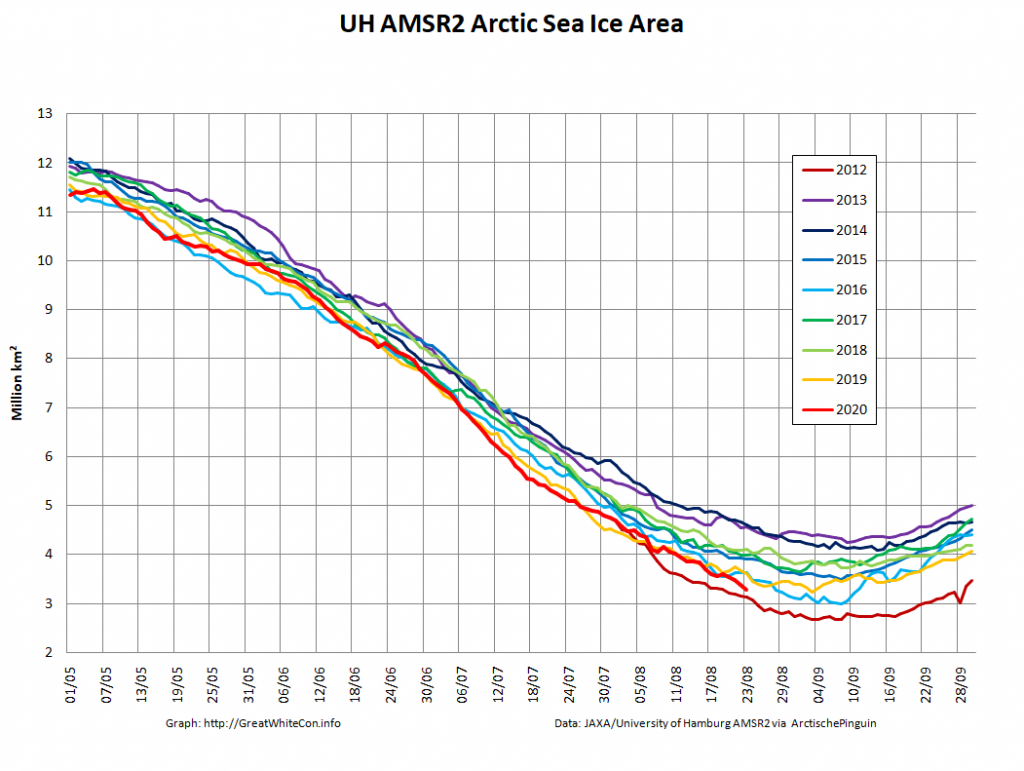
The cyclone has obviously resulted in a reduction in the rate of extent decline, but take a look at the high resolution AMSR2 “compaction” graph:

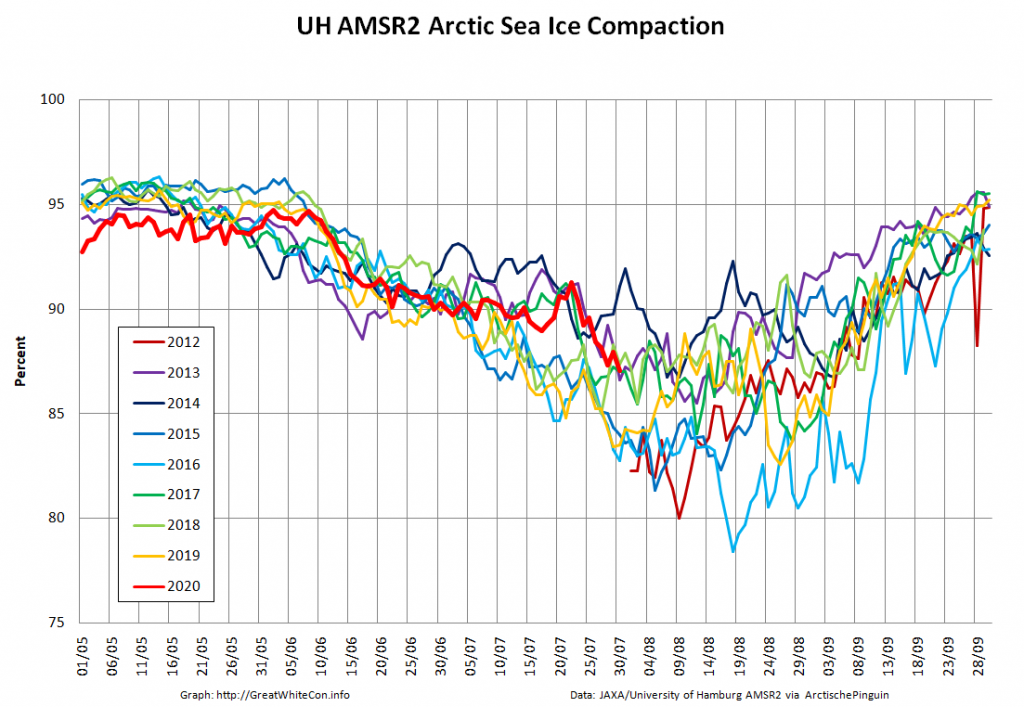
The gaps between the remaining sea ice floes have evidently increased, and hence the ice area is declining more rapidly than its extent.

[Edit – August 2nd]

Here’s an animation, based on the University of Hamburg’s AMSR2 concentration maps, which reveals the motion of the sea ice across the Beaufort and Chukchi Seas for the last two months:

Note in particular the side effects of the recent cyclone, visible at the end of the video.

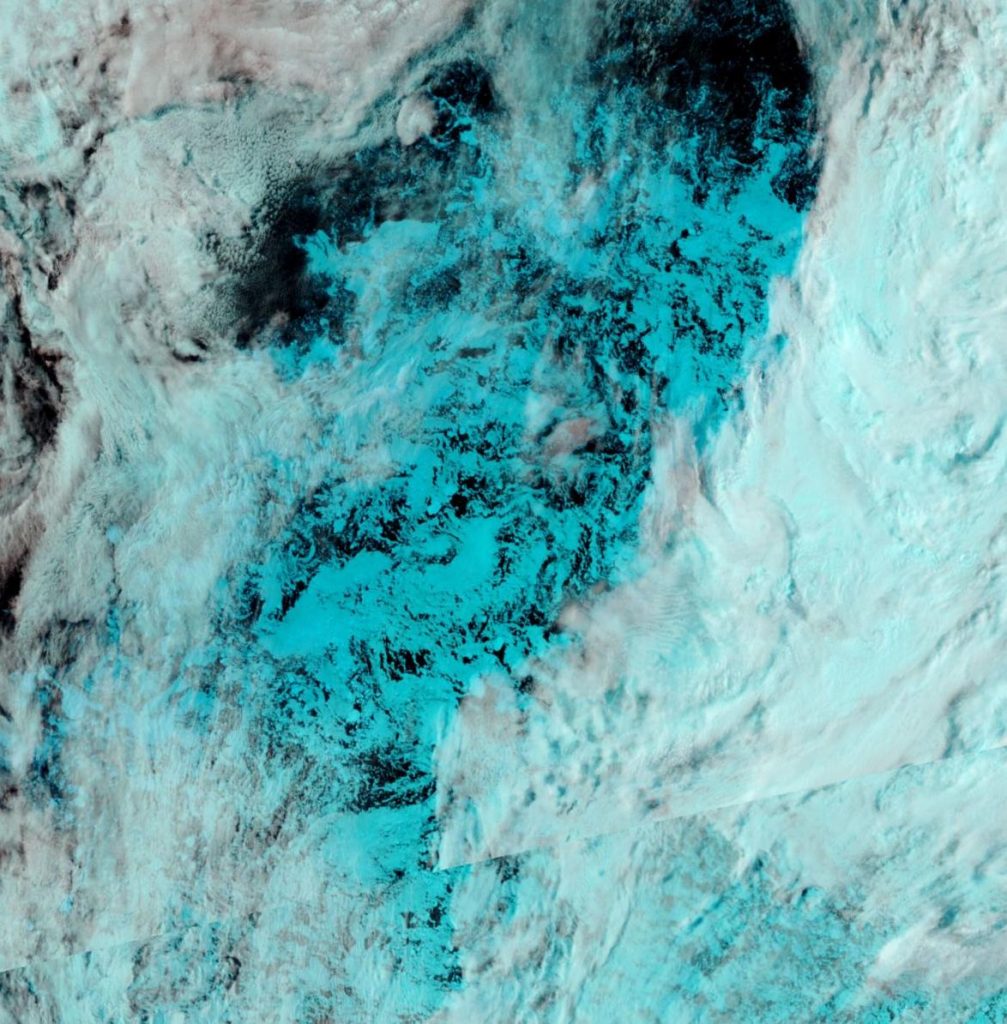
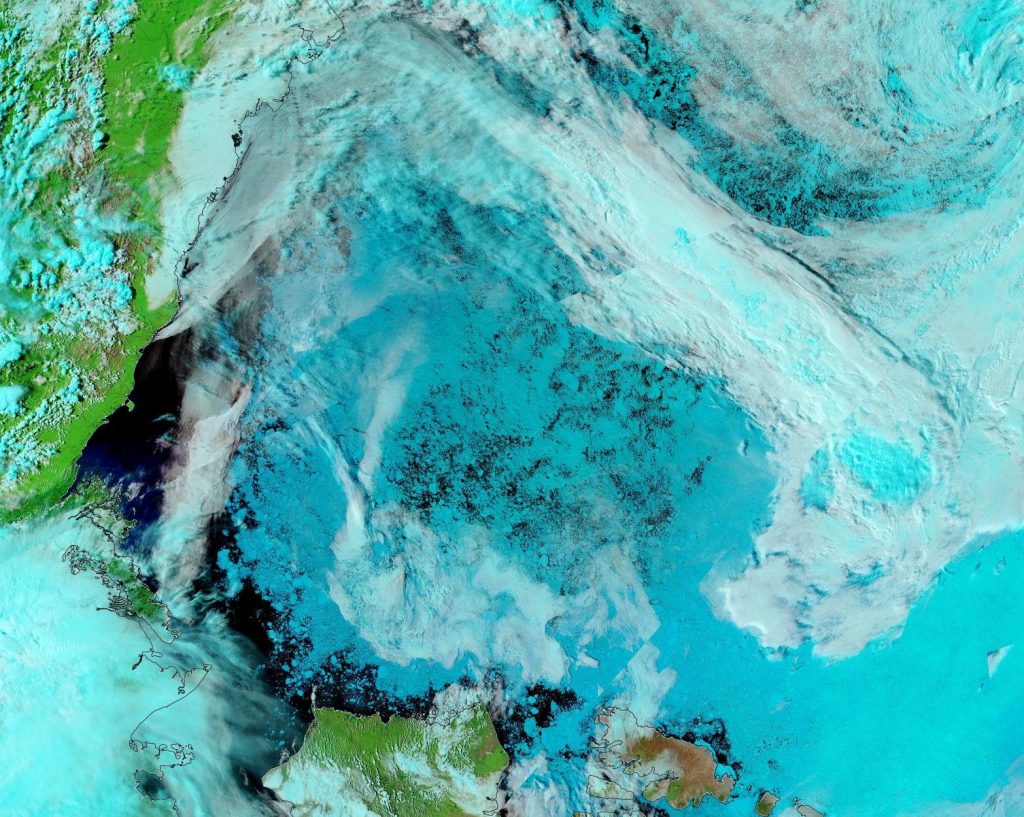
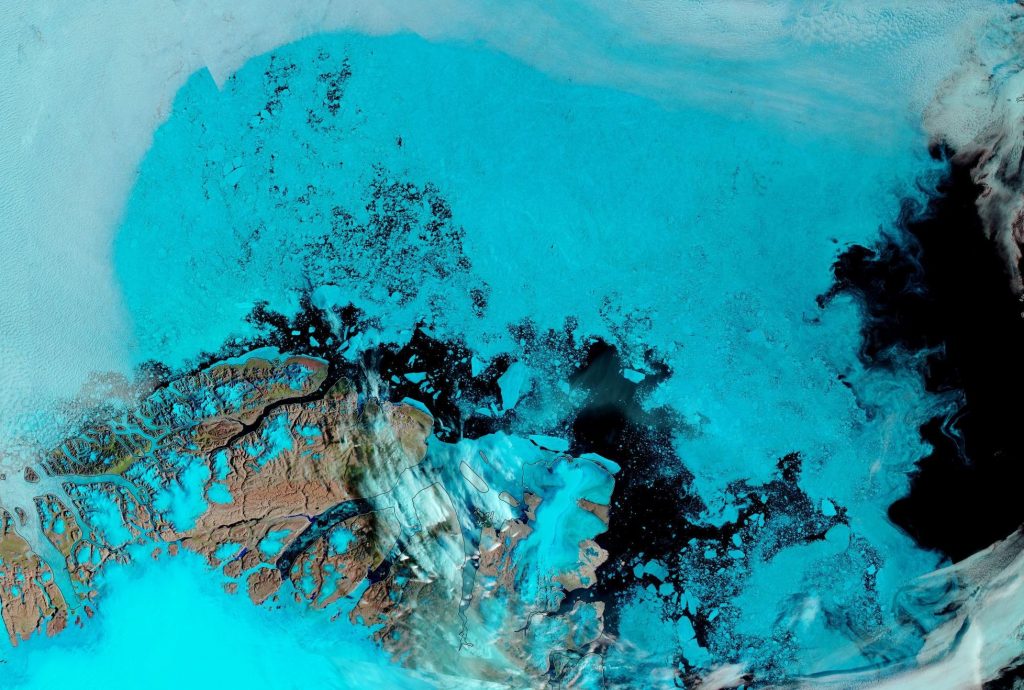
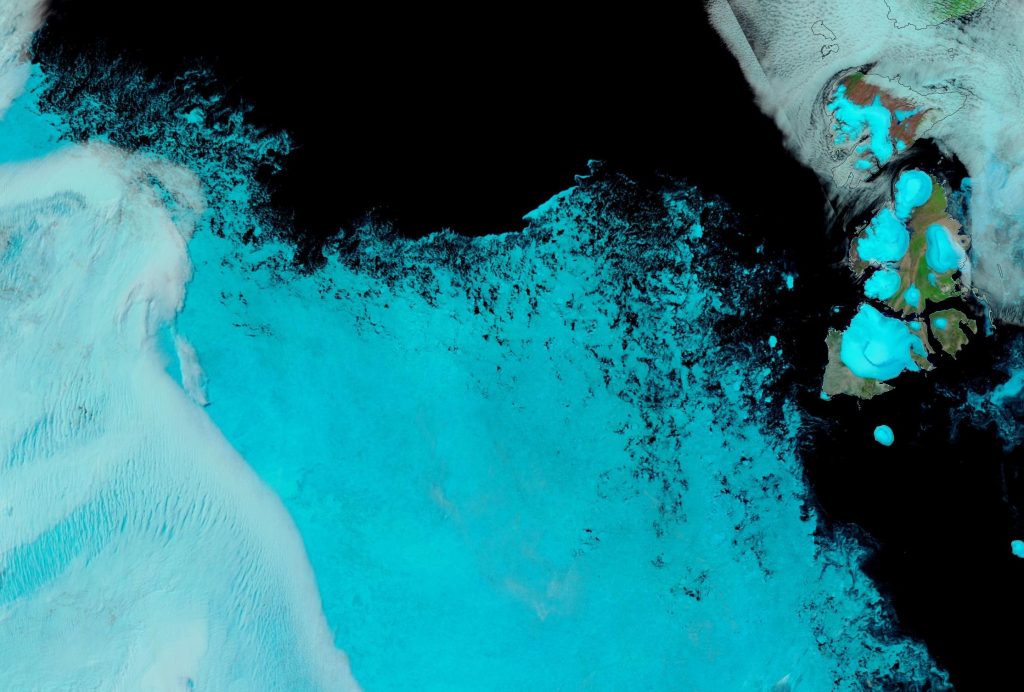
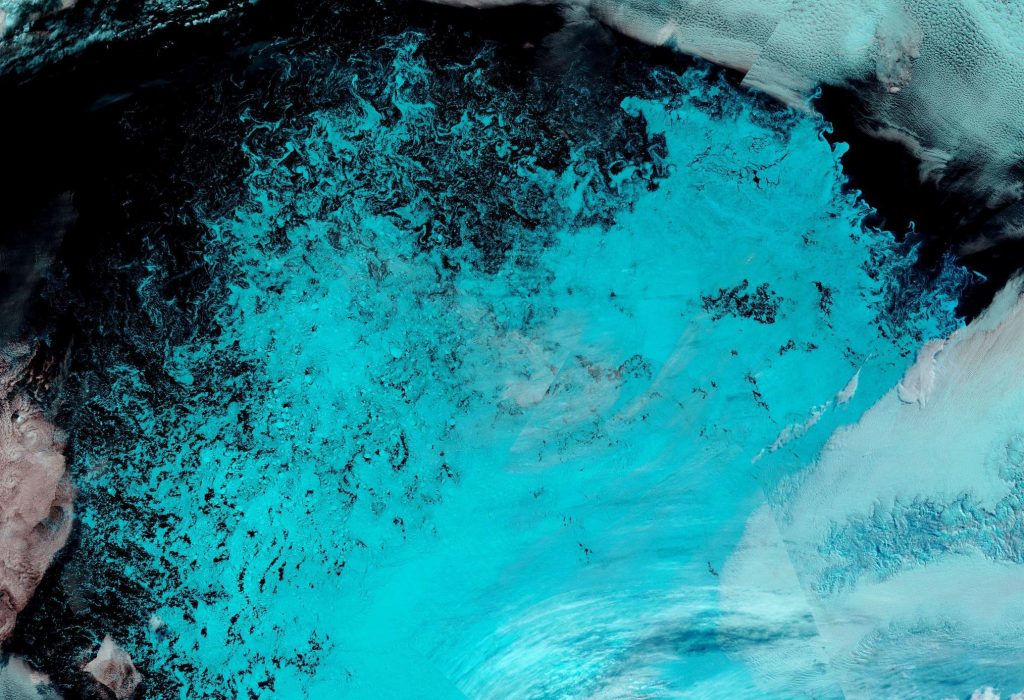
Here too is a close up of the current state of the remaining ice in the Chukchi Sea, snapped by the Suomi NPP satellite through a gap in the clouds:

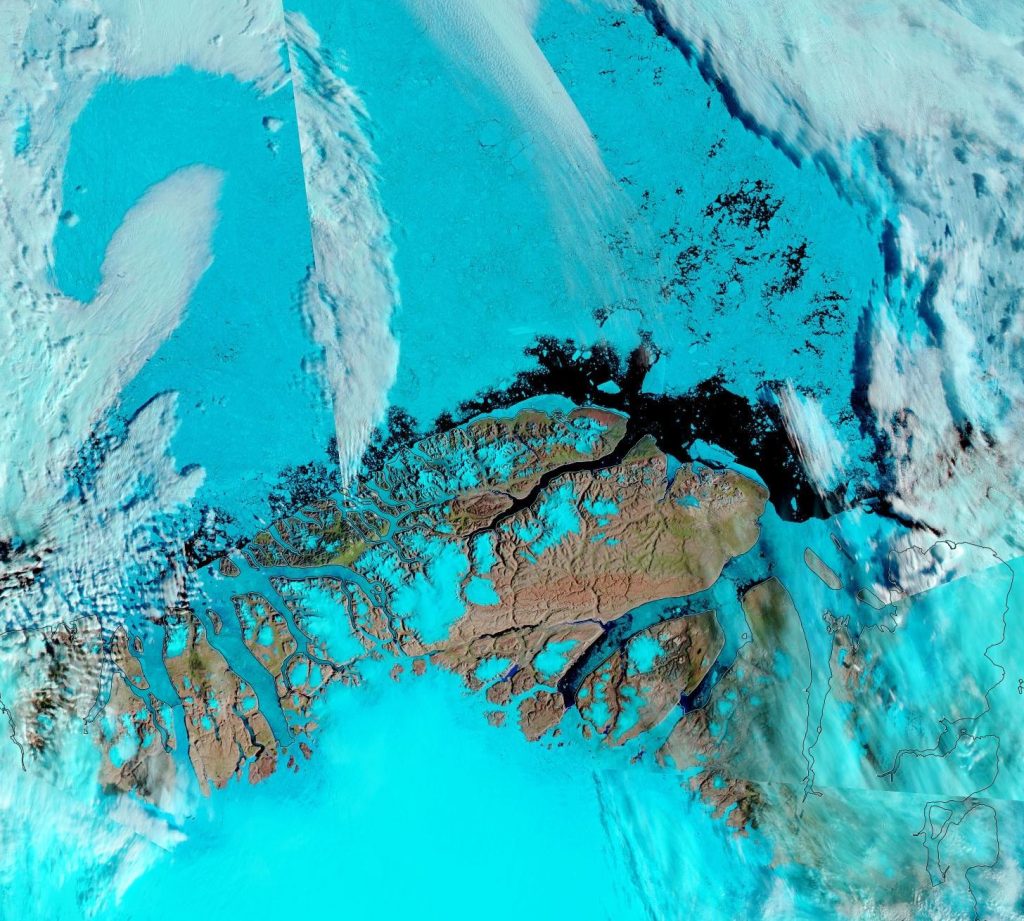
Plus the current open water north of Greenland. Perhaps once Polarstern has been flushed out into the open water of the Fram Strait at the end of the MOSAiC expedition she could take another look at this almost completely unexplored area of the Arctic Ocean?

[Edit – August 6th]

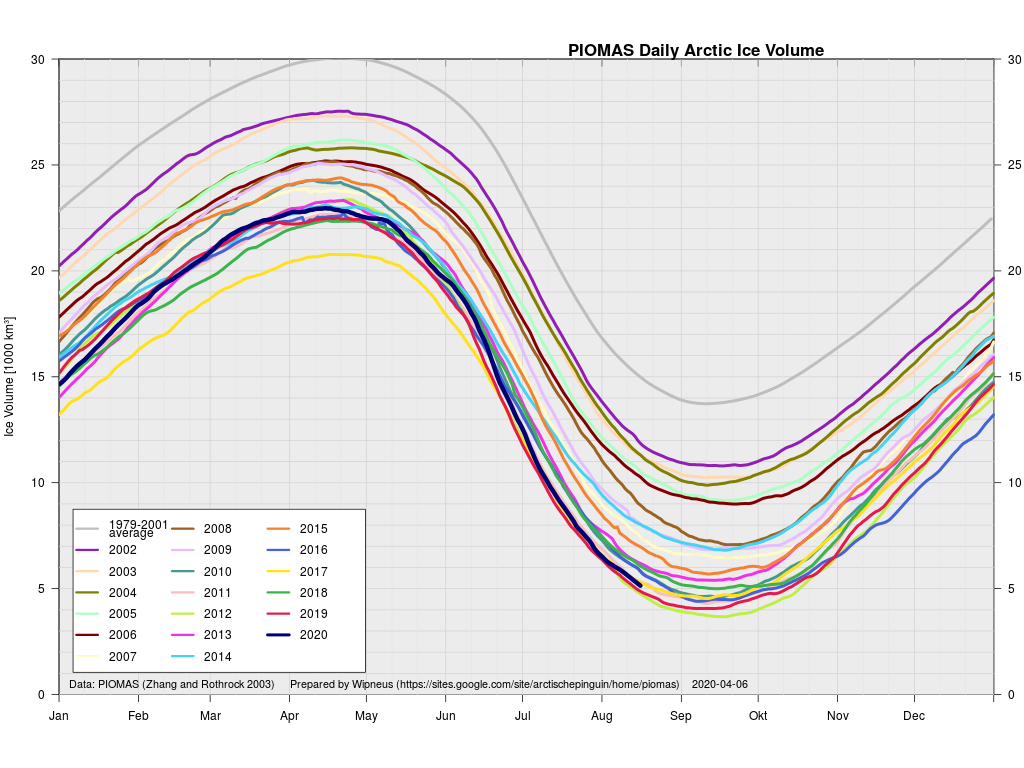
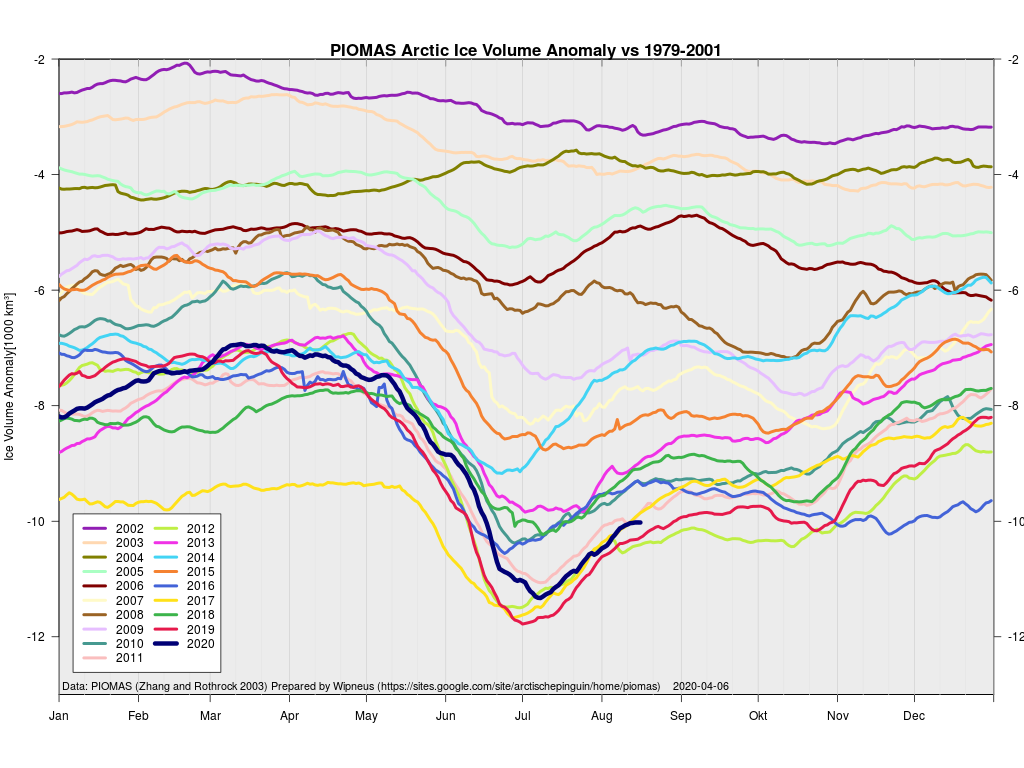
The latest gridded thickness data has been released by the PIOMAS team, and here are Wipneus’s visualisations:

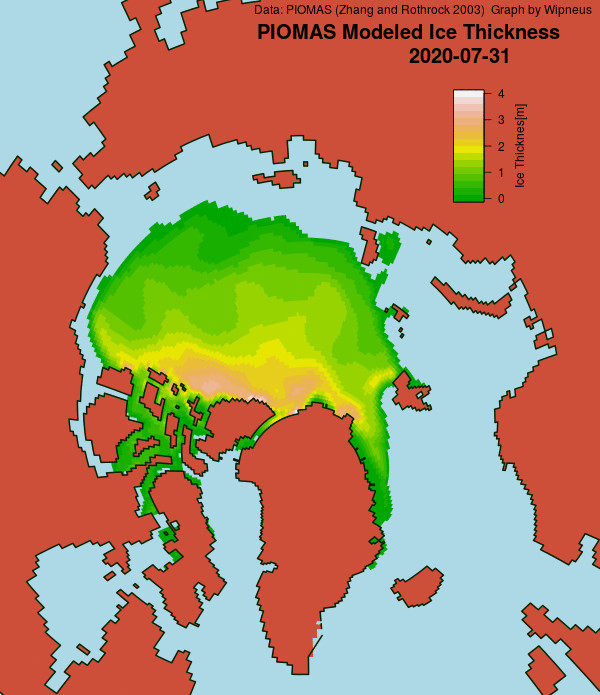
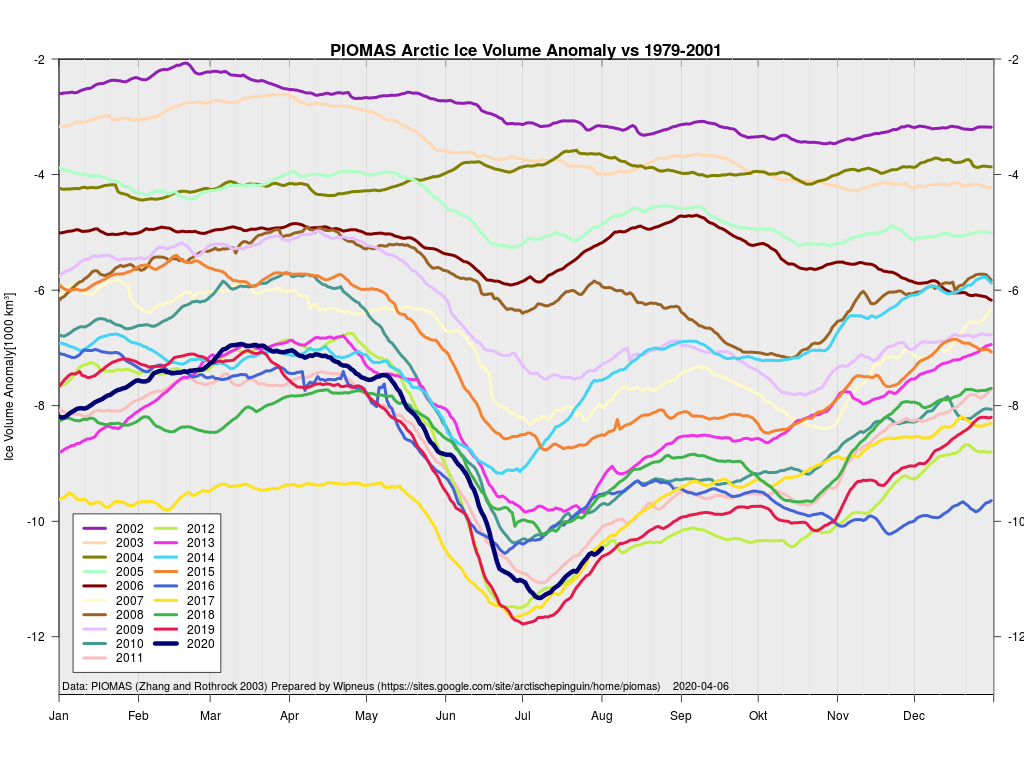
According to the Polar Science Center:

Average Arctic sea ice volume in July 2020 was 9,300 km3. This value is  only 400 km3 above the  record minimum  value of 8,900 km3 set in 2019. This makes 2020 the fourth lowest on record for July with 2012, 2017,2019 falling just below 2020.

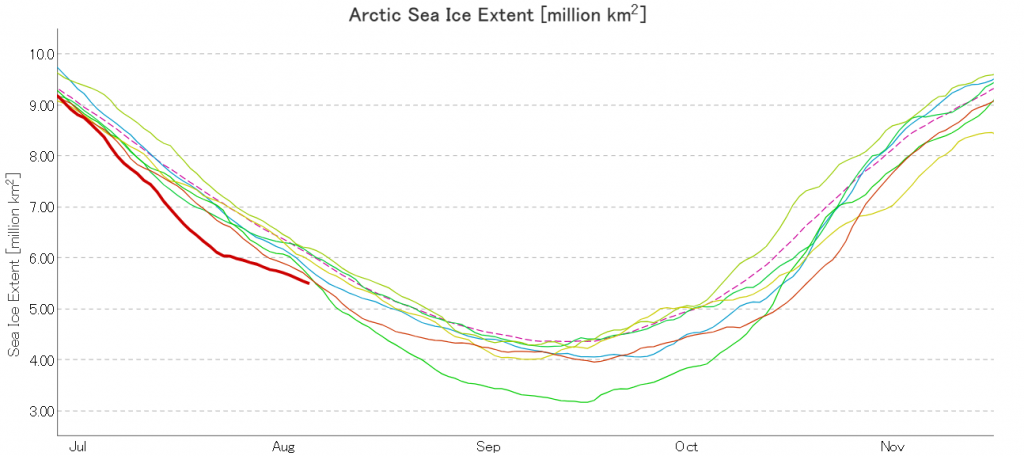
JAXA extent is still lowest for the date, but following the recent cyclone it looks as though it will not maintain that position for much longer:

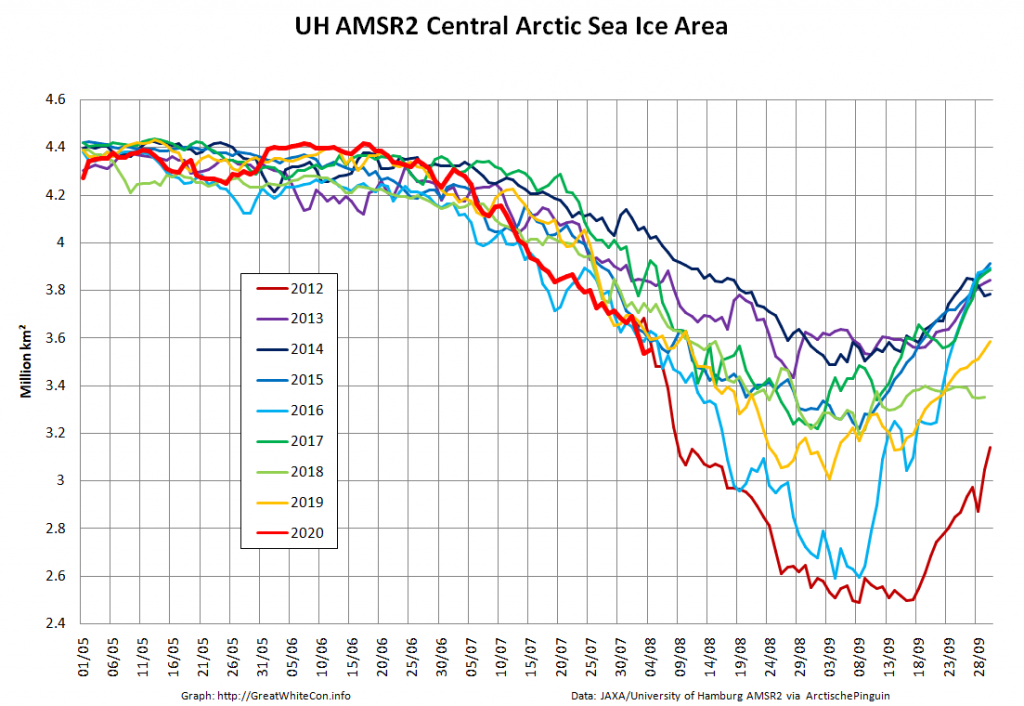
Now we’re in the month of August it’s possible to do a direct comparison with AMSR2 data for 2012. Here’s sea ice area for the Central Arctic Basin:

[Edit – August 8th]

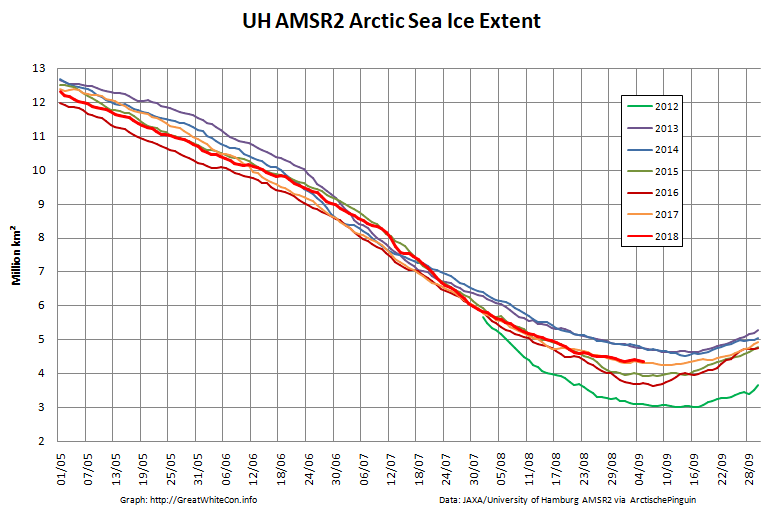
All of a sudden JAXA extent is in 3rd place in the race to the minimum:

However let’s also take a close look at the state of the sea ice in the Beaufort and Wandel Seas shall we?

At this juncture I reckon that come mid September second place is now more likely than first. However as always, it still all depends on the weather.

[Edit – August 9th]

Surprising as it may seem, high resolution AMSR2 Central Arctic Basin sea ice area has so far managed to keep up with the precipitous drop in 2012:

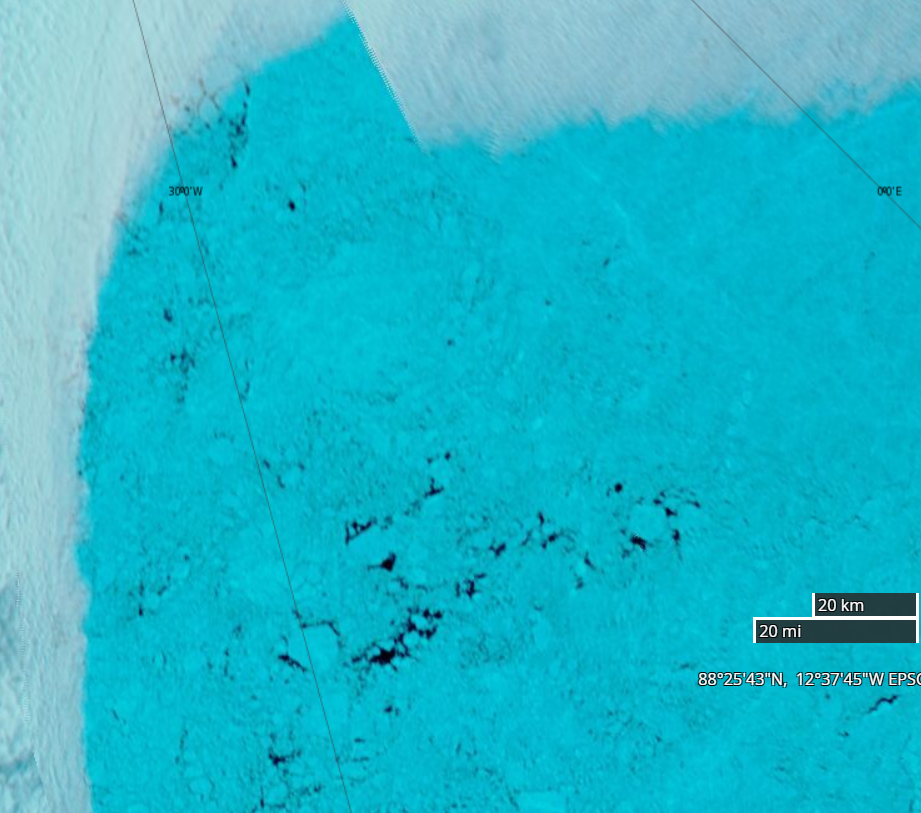
North of Greenland the clouds have cleared closer to the North Pole, to reveal this:

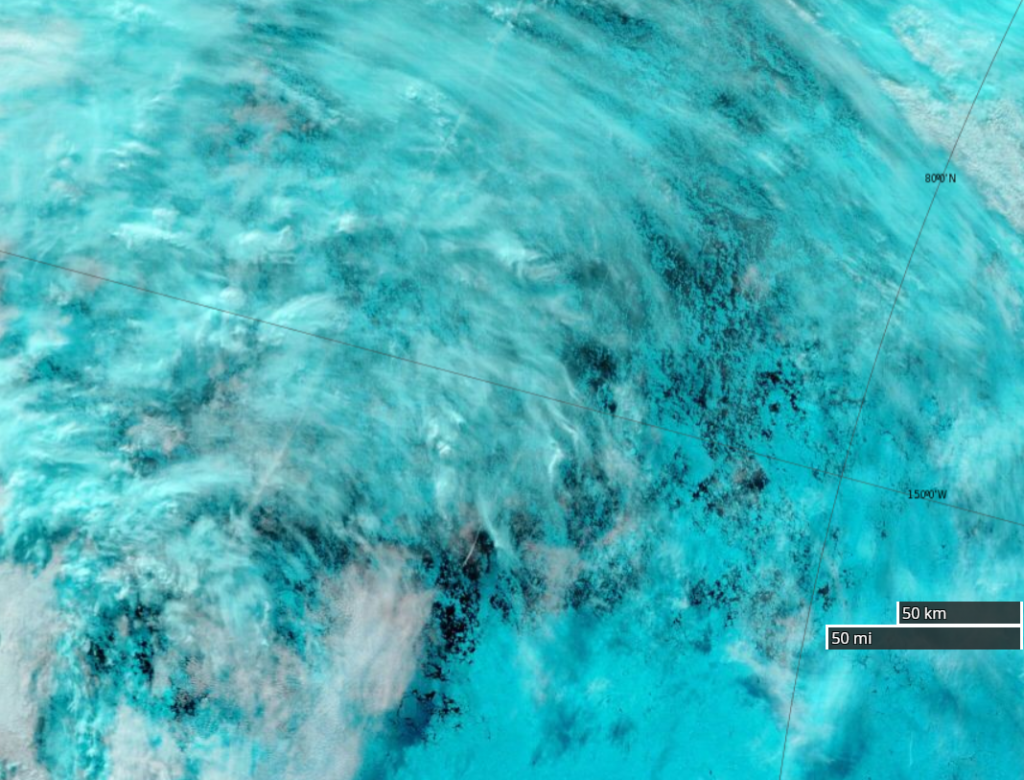
Fresh this morning from Terra, a rather cloudy view of the devastation near 80N, 150W:

[Edit – August 10th]

In a not entirely unexpected development one of ex Prof. Judy’s denizens is quibbling about the current condition of sea ice in the Arctic. Hence here is a close up of some “gaping holes in the sea ice cover” at 88N between Greenland and the North Pole:

[Edit – August 13th]

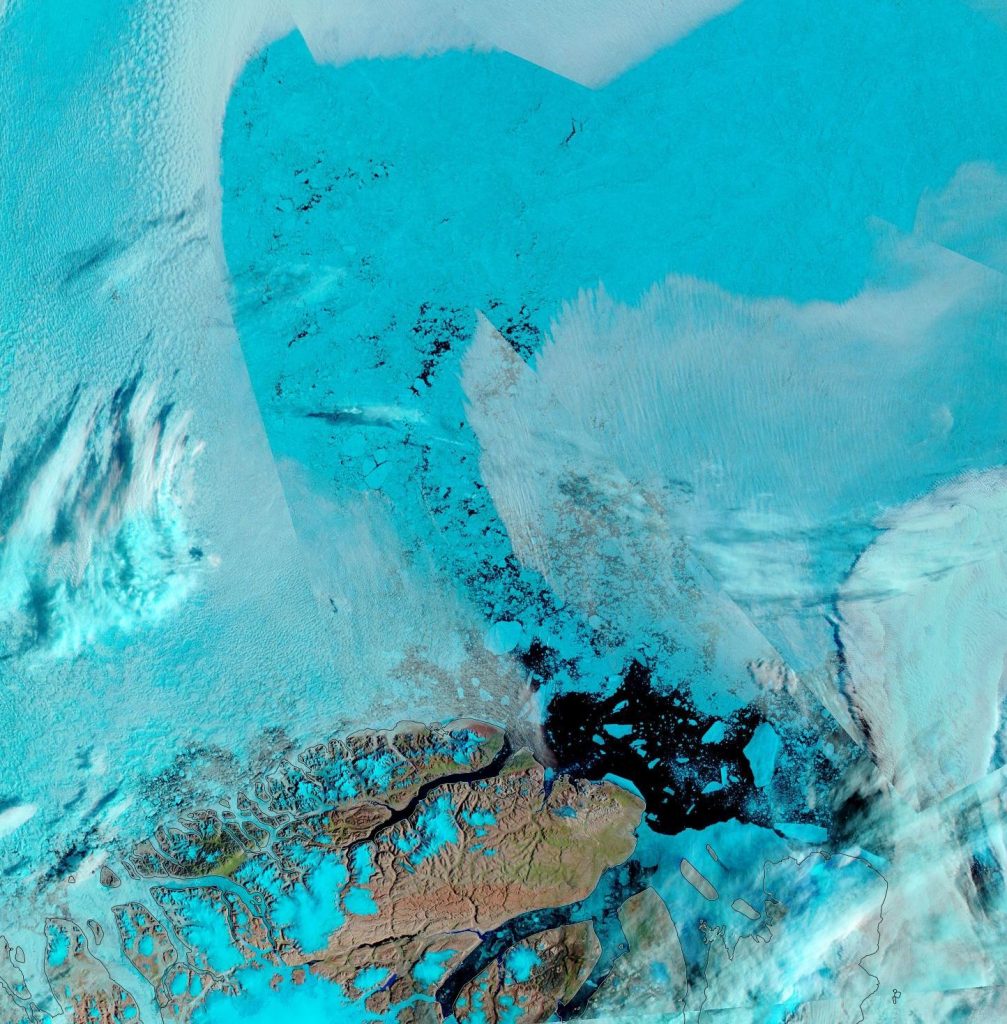
A nice clear view this morning of the marginal ice zone of the “Laptev Bite” and thereabouts from the Suomi satellite :

[Edit – August 16th]

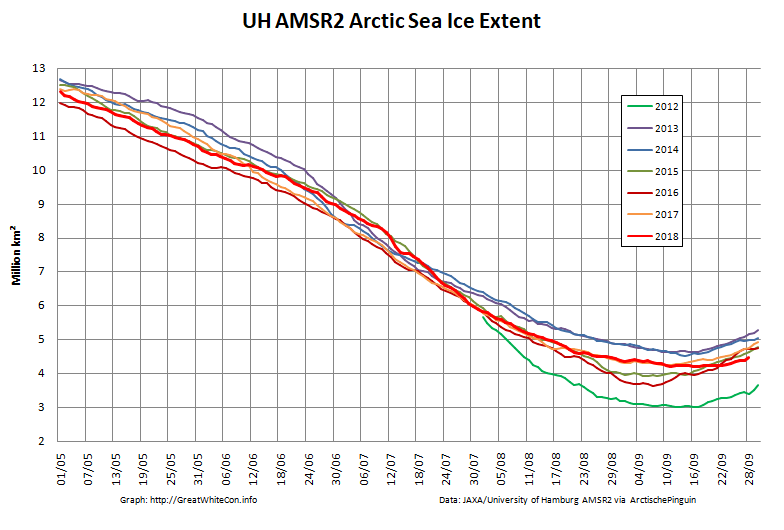
JAXA AMSR2 extent has fallen below 5 million km²:

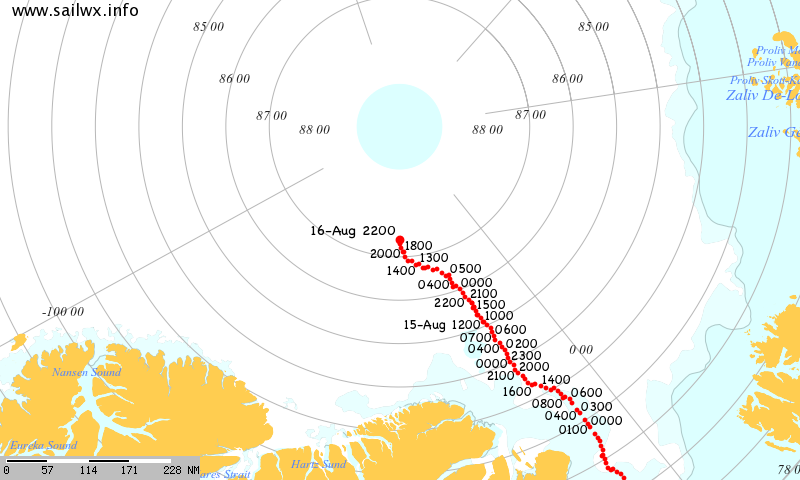
Having been flushed out of the Central Arctic through the Fram Strait the polar research vessel Polarstern is back, seemingly intent on taking a close look at the North Pole:

[Edit – August 19th]

The mid month PIOMAS gridded thickness numbers have been published:

According to the Polar Science Center model Arctic sea ice volume is currently third lowest after 2012 and 2019.

[Edit – August 24th]

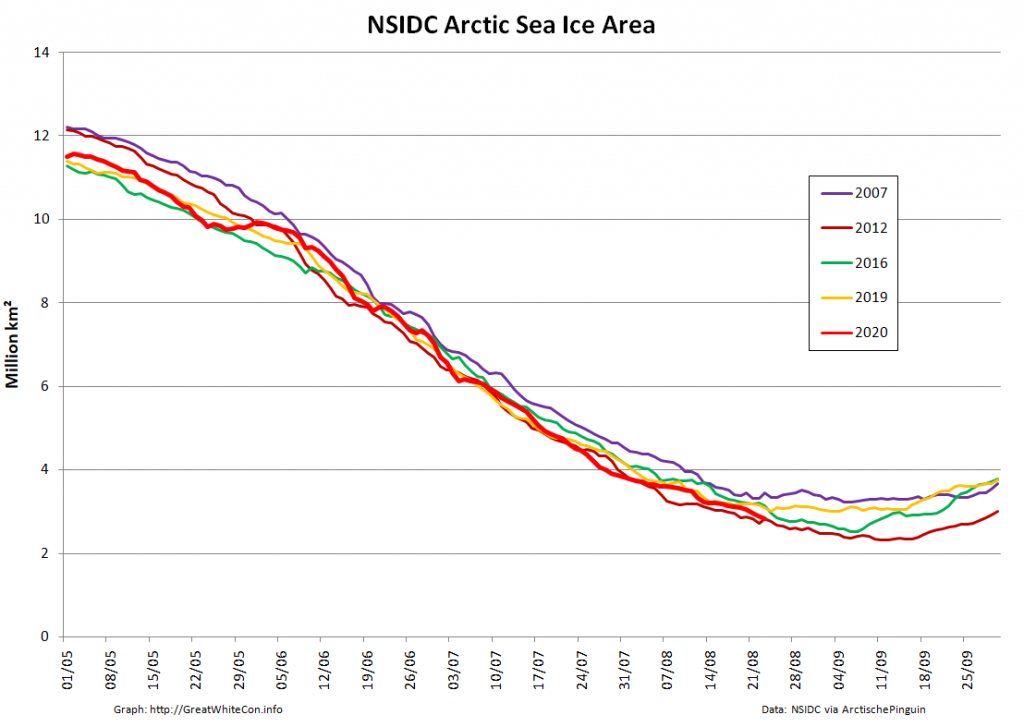
Arctic sea ice area based on NSIDC concentration data is now in a “statistical tie” with 2012 for the honour of “lowest for the date” in the satellite record:


High resolution AMSR2 area isn’t far behind:

[Edit – August 24th]

A nice clear view of the disintegrating sea ice north of the East Siberian and Chukchi Seas yesterday:

Watch this space very closely for the next few weeks!

The 2018 Arctic Sea Ice Metric Minima

September is upon us once again, the month in which the assorted Arctic sea ice area and extent metrics (almost) always reach their respective annual minima. Now we are free to start speculating about what the assorted minima will be, and on what date.

To begin with let’s take a look at our much beloved high resolution AMSR2 metrics derived by “Wipneus” from the University of Hamburg’s AMSR2 concentration data:

Arctic-Area-2018-09-01

Arctic-Extent-2018-09-01

There’s currently some divergence between the area and extent graphs. Area is declining rapidly for the time of year, whilst extent seems to almost have come to a standstill!

Next here’s the prediction of the late, great Andrew Slater’s Probabilistic Ice Extent algorithm:

SPIE-extent-20180901

Before looking at some of the other metrics we’ll wait for the effect of the assorted storms currently circling the Arctic to play out. Here’s how the AMSR2 concentration map looks at the moment:

Arc_20180901_res3.125

whilst here’s the University of Bremen’s summer SMOS sea ice “thinness” map:

SMOS-20180901


[Edit – September 3rd]

UH AMSR2 area and extent both increased yesterday, so we have a (very!) provisional minimum extent of 4.35 million square kilometres on September 1st.


[Edit – September 4th]

Area and extent have both increased again:

Arctic-Area-2018-09-03

Arctic-Extent-2018-09-03

Is the minimum already in, or will the storms still circulating around the Arctic Ocean reverse that trend over the next few days?


[Edit – September 6th]

High resolution area and extent both posted marginal new lows for the year yesterday:

Arctic-Area-2018-09-05

Arctic-Extent-2018-09-05


[Edit – September 29th]

According to the latest edition of the NSIDC’s Arctic Sea Ice News:

On September 19 and 23, Arctic sea ice appeared to have reached its seasonal minimum extent for the year, at 4.59 million square kilometers (1.77 million square miles). This ties 2018 with 2008 and 2010 for the sixth lowest minimum extent in the nearly 40-year satellite record.

Please note that this is a preliminary announcement. Changing winds or late-season melt could still reduce the Arctic ice extent, as happened in 2005 and 2010. NSIDC scientists will release a full analysis of the Arctic melt season, and discuss the Antarctic winter sea ice growth, in early October.

Figure2_09232018

The NSIDC numbers are based on a 5 day average, whereas the one day high resolution AMSR2 extent reached a minimum of 4.195 million square kilometers on September 17th:

Arctic-Extent-2018-09-28

The AMSR2 area minimum occurred significantly earlier. 3.737 million square kilometers on September 9th:

Arctic-Area-2018-09-28

The 2016 Arctic Winter Sea Ice Puzzle

Professor Judith Curry recently posed the following rhetorical question on her “Climate Etc.” blog:

Arctic sea ice extent has been anomalously low this winter. The greatest anomalies are in the European sector, specifically in the Barents Sea. To what extent are the anomalies associated with warm temperatures?

Which she answered as follows:

So, what might be causing this particular anomaly? Some possibilities are:

  • Gobal warming (January 2016 was warmest Jan on record, according to the surface temperature analyses

  • Multidecadal oscillations (e.g. stadium wave) predicts ice recovery to be occurring in the same region (European Arctic) where we see the sea ice decline).

  • Seasonal weather circulation patterns – this has been a year with with unusual weather patterns, with both low temperature and high temperature records being set.

As regular readers will already be aware we have been blogging about anomalously warm temperatures in the Arctic all year and so felt well qualified to contribute to the “debate”. What a job that turned out to be! Early on in the proceedings the anticipated pronouncement was made by one of Judith’s “denizens”. A link to a ludicrously inaccurate article on Watts Up With That accompanied by the following words of wisdom:

Other measures are high.

Which of course they aren’t! Instead of stating the bleedin’ obvious Professor Curry replied:

I spotted this, no idea what to make of it.

You would think she and her denizens would therefore have been pleased when I attempted to explain to her what to make of it, but you would have been mistaken. The icing on the ad hominem cake was the aforementioned Anthony Watts driving by to accuse me of all sorts of nefarious activities without providing a single shred of evidence and then running for the hills when invited to actually prove his ludicrous allegations.

Since the denizens of “Climate Etc.” aren’t particularly interested let’s take stock here instead shall we? After every Arctic area and extent metric under the sun sitting at “lowest *ever” levels for weeks a recent increase in coverage on the Pacific side of the Arctic has changed that. The most up to date example of that is the JAXA/ADS extent, which currently looks like this:

vishop_extent-20160228

The latest reading is the merest whisker above 2015’s record low maximum. However in other respects things are most certainly not comparable with 2015. See for example this concentration comparison from Andrew Slater of the NSIDC:

ice_con_delt_20160227

Much more ice on the Pacific periphery where it will all have disappeared by September, as opposed to much less ice on the Atlantic side, even well to the north of 80 degrees latitude where the sun still does not shine. Here’s a video revealing how the sea ice North of the Pacific Ocean has been reacting to the sequence of hurricane force storms that have been passing through the area over the past couple of months:

Now let’s take a look at “near real time” Arctic sea ice thickness as measured by the CryoSat 2 satellite:

CryoSat2_20160225

Notice the absence of any thick ice in the Beaufort and Chukchi Seas, an obvious difference from last year? Notice too the large area of thick ice that looks as though it’s heading towards the Fram strait exit from the Central Arctic. Here’s another video, this time of sea ice movement over on the Atlantic side of the Arctic Ocean:

Those dark areas between Svalbard and the North Pole are suddenly starting to look as though they represent reality rather than a mere “artifact”, although perhaps they are merely transient evidence of yet another Arctic “heat wave”?