My title today refers to the fact that the summer Arctic sea ice forecasting season is with us once again. The ARCUS Sea Ice Outlook (SIO for short) started in 2008, with the aim of gathering together and publishing “community predictions of the September sea ice extent”. The SIO is now part of the recently created Sea Ice Prediction Network, and the deadline for submission for the first set of forecasts of 2014 was June 10th.
I have a professional interest in UK and international energy policy, and as a consequence I have been commenting on the recent attempts of Professor Richard Tol to debunk the so called “97% climate change consensus” elsewhere in the blogosphere. As luck would have it I allowed myself to become engaged in what was supposedly a conversation about that very topic on the What’s Up With That blog. Feel free to read all about it if you’d like to see a pseudo-skeptical gish gallop in full swing:
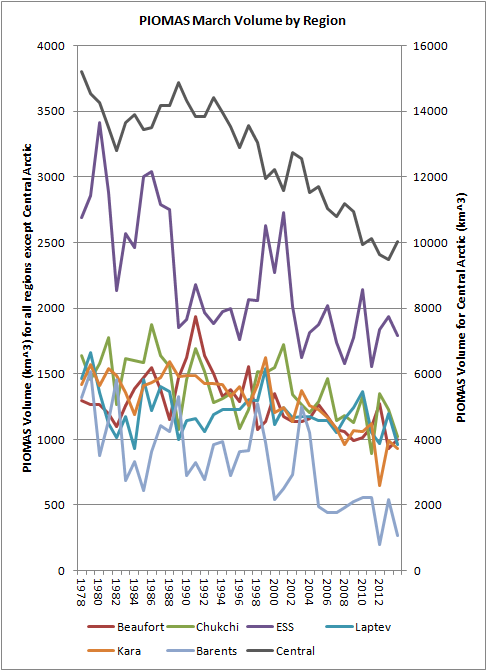
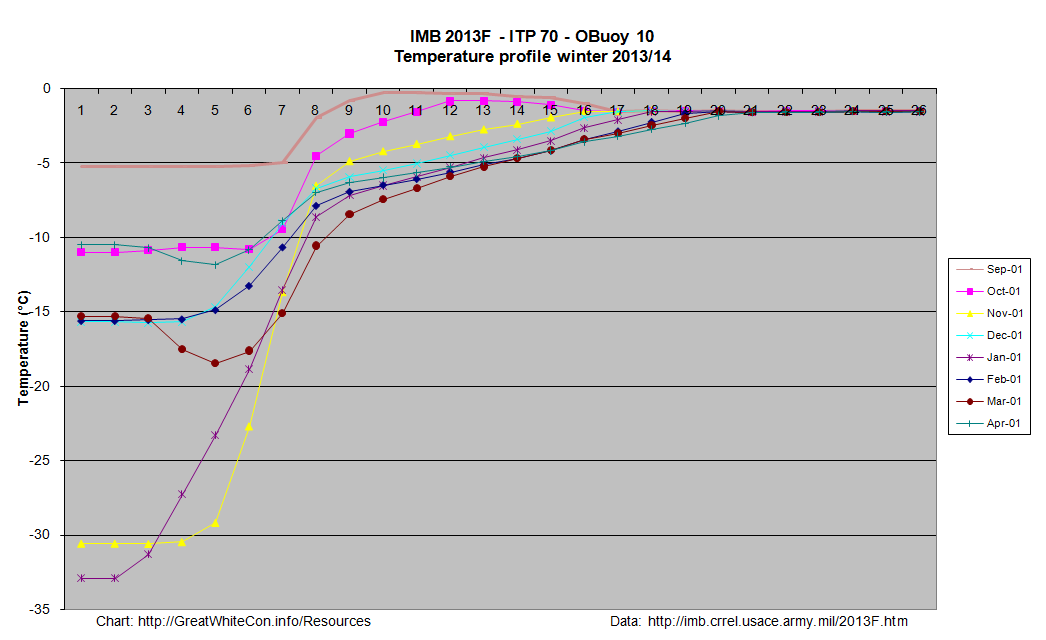
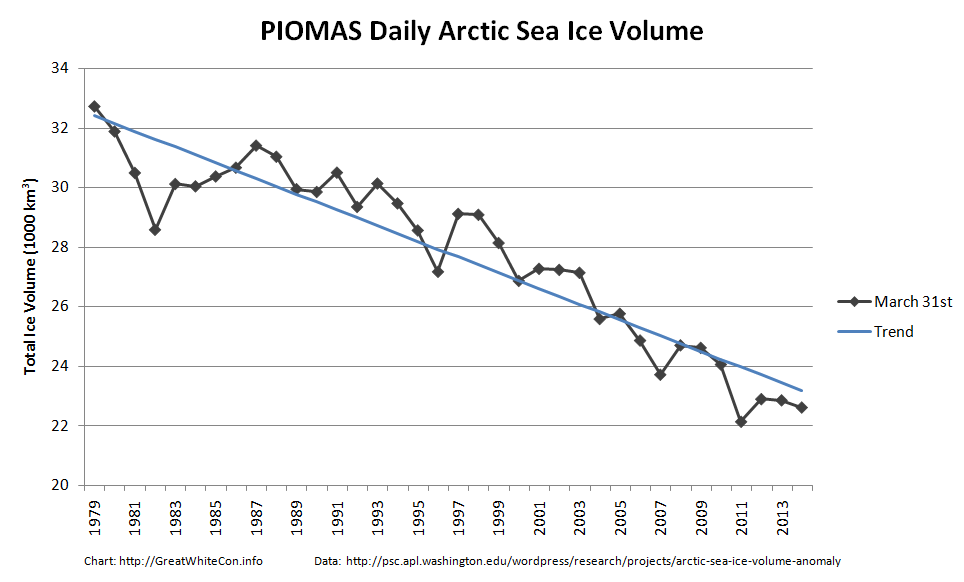
Whilst over there I couldn’t help but notice that Anthony Watts had left things until the eleventh hour before asking his faithful followers to contribute to the Sea Ice Outlook June survey. I also couldn’t help but notice that despite assurances to the contrary a few short weeks ago (and even after my recent “extra heads up“!) the WUWT “Sea Ice Reference Page” is still sadly lacking in a wide range of information about Arctic sea ice thickness and volume. Consequently I figured I would be performing a valuable public service by bringing this to the attention of Anthony and his readers. Here’s what happened after that:
Us:
Them:
June 10, 2014 at 8:55 am
[snip no, we are not going to have you thread-jack again by pushing your own website and own views – Anthony]
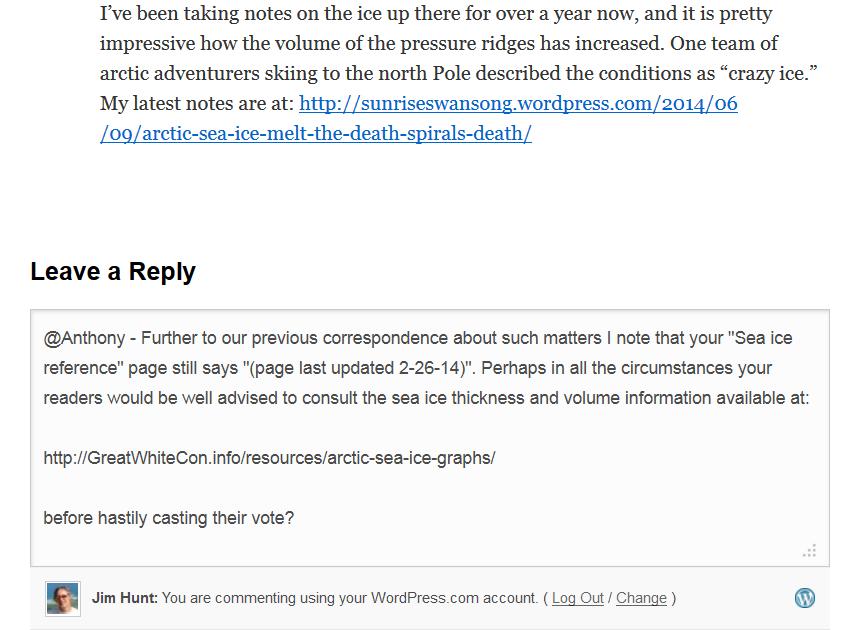
Us:
June 10, 2014 at 9:32 am
Re: @Anthony says: June 10, 2014 at 8:55 amIt’s not my “own views” Anthony. In fact it’s a long list of useful facts and figures for anybody attempting to forecast the future of Arctic sea ice. A long list of useful information still noticeable only by its absence from the WUWT sea ice reference page.
Them:
REPLY: We aren’t forecasting volume, we are forecasting extent, so again, your views that we should pay attention to volume graphs on your website (your favorite hobby horse) in this extent forecasting exercise are irrelevant. Don’t clutter up this thread further – Anthony.
Them & Us:
@wattsupwiththat What’s up with my “commenting style”? What’s up with my “own self” for that matter?
— Jim Hunt (@jim_hunt) June 10, 2014
Them:
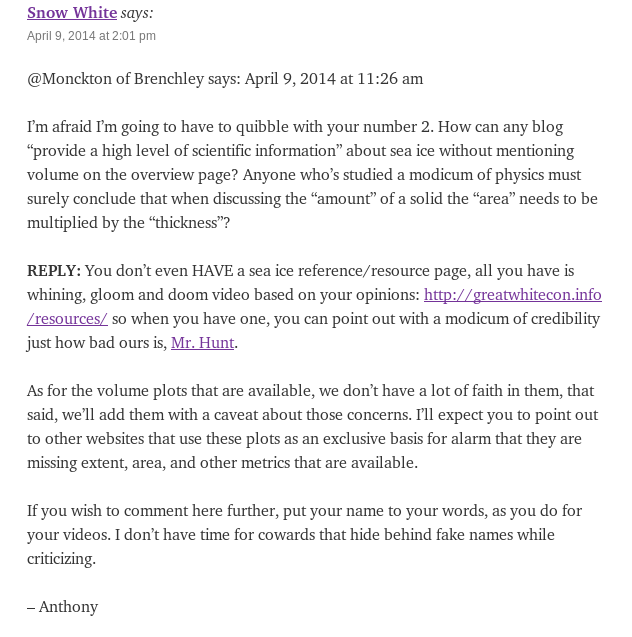
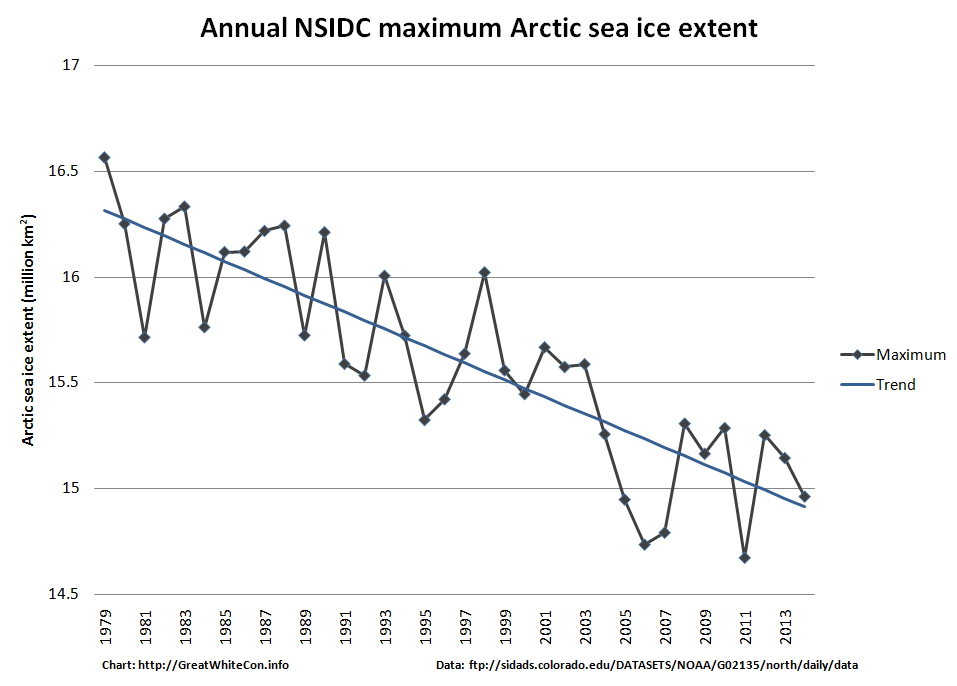
In the absence of a wide range of scientific information concerning the current thickness distribution of sea ice in the Arctic, and after due deliberation about the likely value of the NSIDC Arctic sea ice extent metric in September 2014, Anthony concluded:
A value of 6.12 million sq km will be sent to ARCUS.
Us:
We’ll keep you posted!