I’ve recently received a letter signed by John Wellington who is the Managing Editor of The Mail on Sunday.
Them:
Referring to David Rose’s Mail on Sunday article of September 8th 2013 John says amongst many other things that:
We deny that the article was significantly inaccurate apart from the original headline figure which we have already corrected.
and:
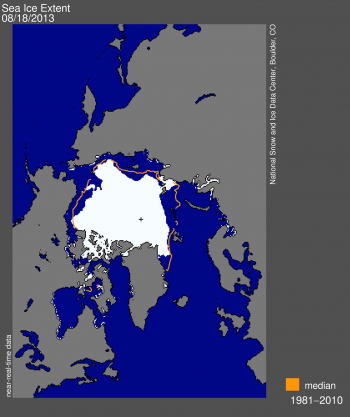
In August, ice did stretch from part of the Siberian shore to the Canadian islands. The image published in the newspaper and online supports this statement as does the enclosed image from the NSIDC site which shows the ice extent on August 18.
Here’s that image, which comes from the August 19th 2013 edition of the National Snow and Ice Data Center’s “Arctic Sea Ice News” entitled “The balding Arctic“:

Us:
I’m currently writing a reply to John’s letter. Amongst many other things it directs his attention to this very article and says:
Images showing sea ice “extent” reveal remarkably little about whether an “ice sheet” is “unbroken” or not. If that is what you want to illustrate then an image showing “concentration” is much more helpful. In their report of September 4th upon which David Rose’s article is supposedly based, at least in part, the NSIDC helpfully provided such an image. The Mail on Sunday didn’t publish that image, or a similar image from 2012. In order to correct this inaccuracy they should do so.
Since they’ve evidently read the NSIDC’s news that the Arctic was “Balding” towards the end of August and there was “A real hole near the pole” by early September John and David should be aware of this already, but it seems a refresher course is necessary. On August 19th the NSIDC pointed out that:
Satellite data from the AMSR-2 instrument and MODIS show an unusually large expanse of low-concentration sea ice (20 to 80% cover) within our extent outline (15% or greater, using the SSM/I sensor) spanning much of the Russian side of the Arctic and extending to within a few degrees of the North Pole.
While some of the low concentrations recorded by AMSR-2 may be due to surface melt on sea ice, the MODIS image confirms that a large region is covered by isolated floes.
On September 4th the NSIDC also helpfully pointed out that:
A large hole (roughly 150 square kilometers or 58 square miles) of near-zero ice concentration appears to have opened up at about 87 degrees North latitude.
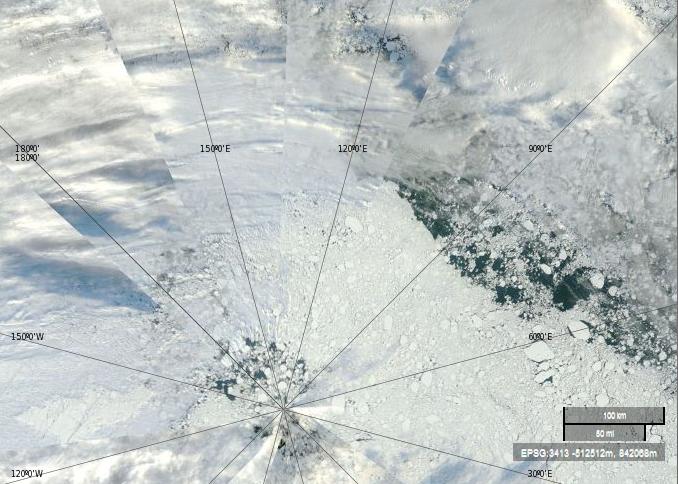
Here is a “true-color” image from September 4th 2013 using MODIS bands 1, 4 and 3, helpfully made available by NASA to anyone who might be interested via the EOSDIS Worldview web site:

The lines in this image converge on the North Pole, the same location as the little cross in the NSIDC extent image near the top of this article. Let’s play “Spot the Difference” yet again shall we. Would you say that the sea ice underneath the clouds looks “broken” in this Worldview “true-color” image? How about in the the University of Bremen concentration images often shown by the NSIDC, or in the NSIDC “extent” image above, or in the NASA “extent” videos so beloved by David Rose and the Mail on Sunday?