Further to the cessation of the brief hiatus in my continuing discussions with “Steve Goddard” about “global warming”, the debate has turned to predictions concerning Arctic sea ice metrics during the 2014 melting season.
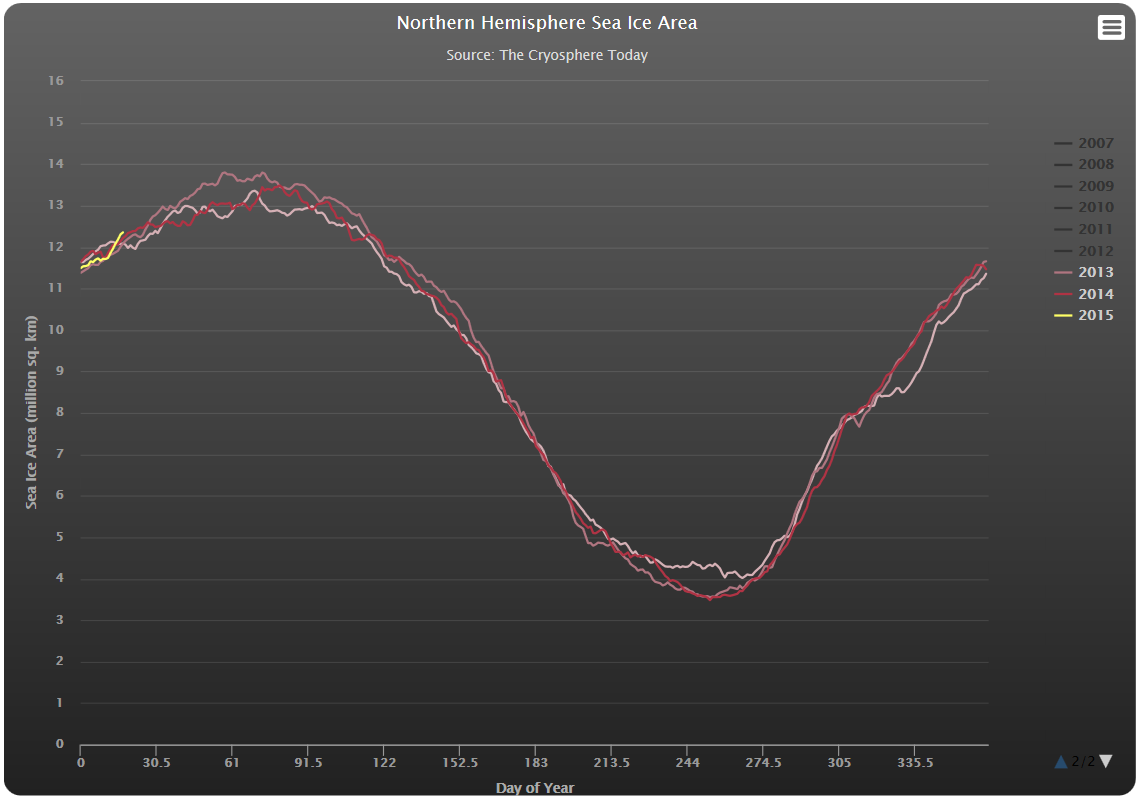
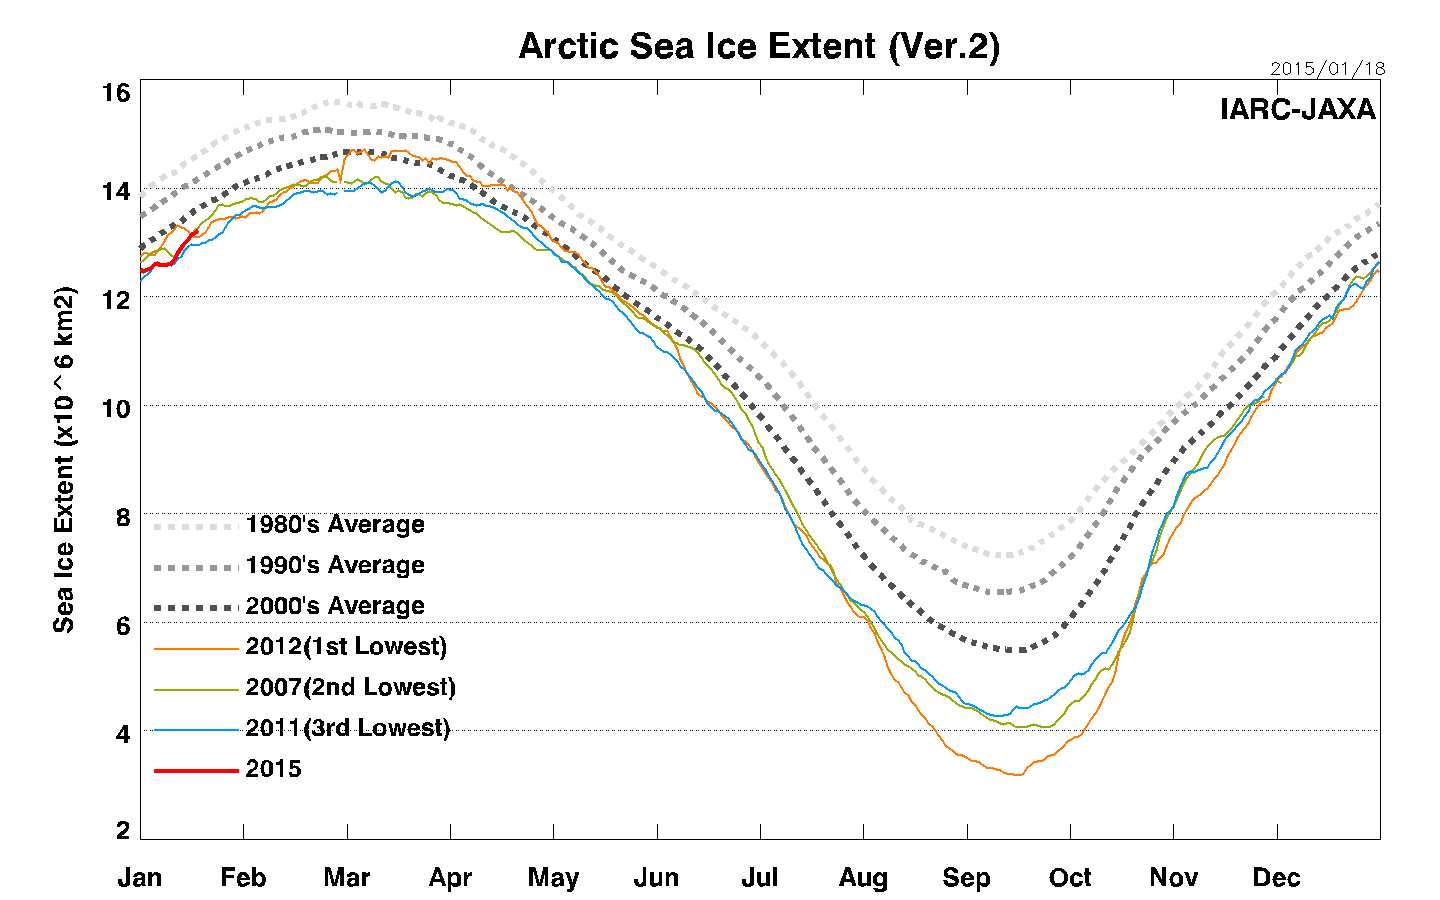
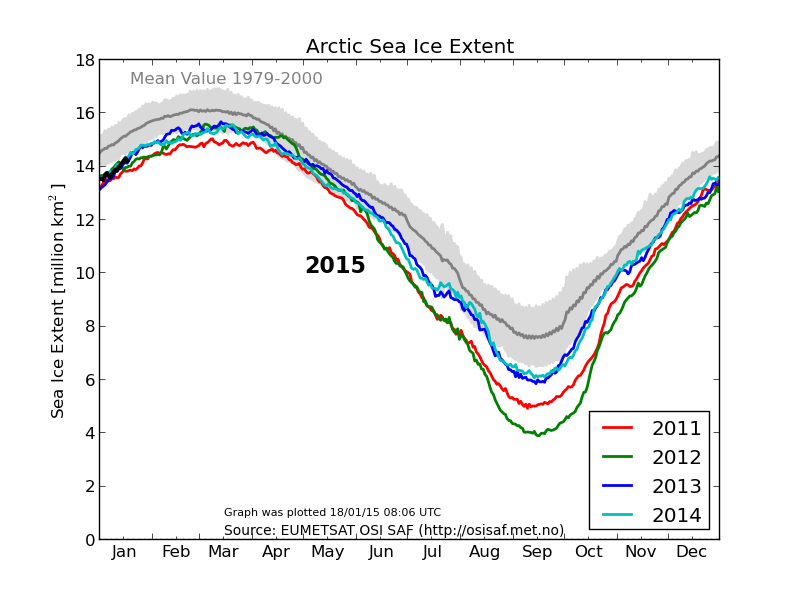
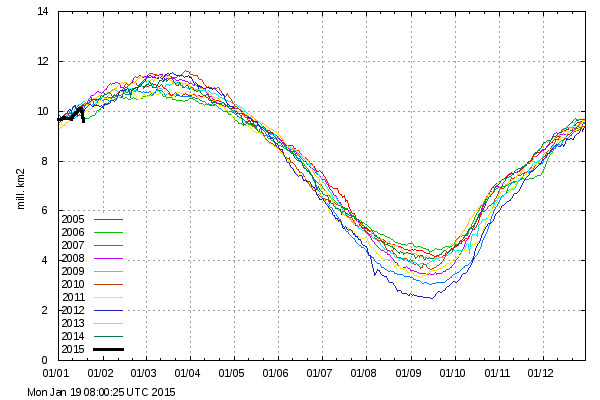
Firstly here’s a few charts of assorted Arctic sea ice metrics, hot off the virtual presses:
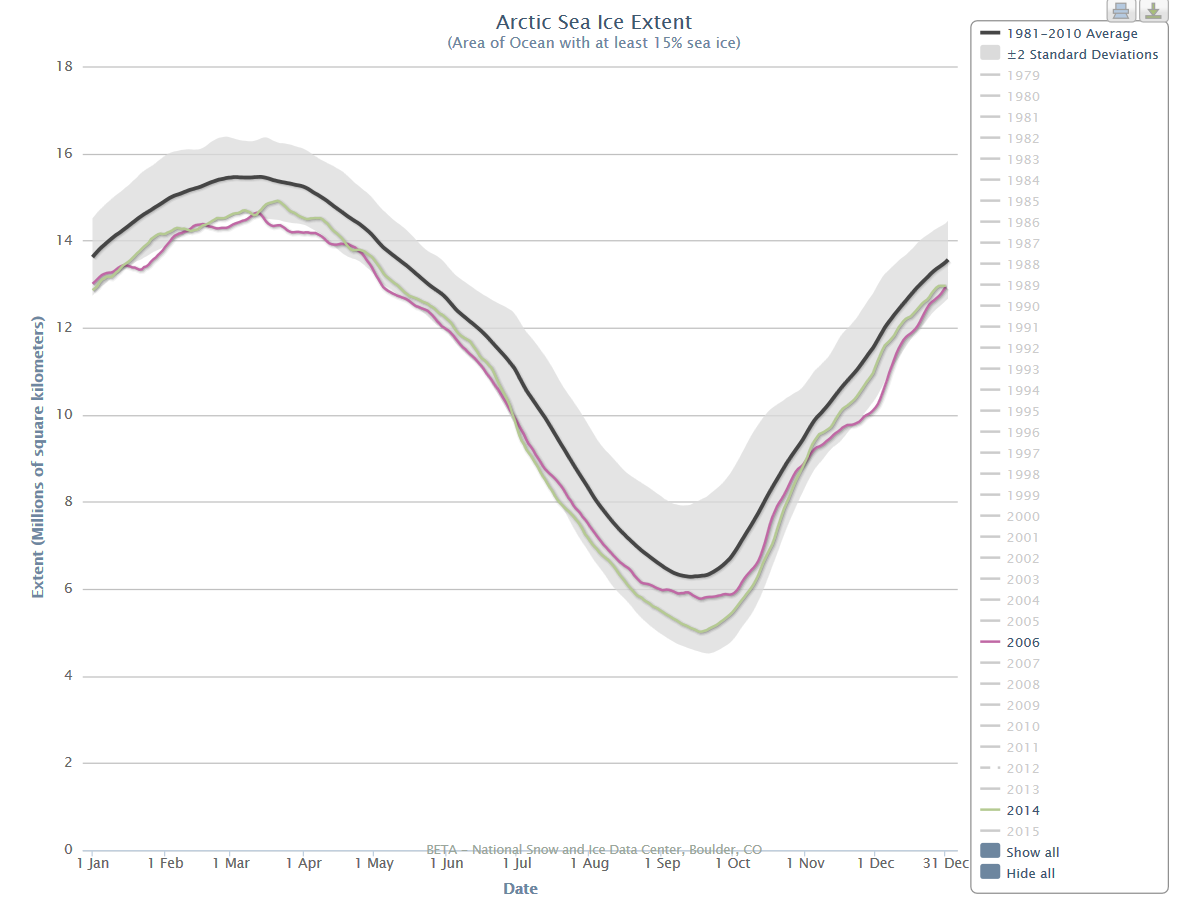
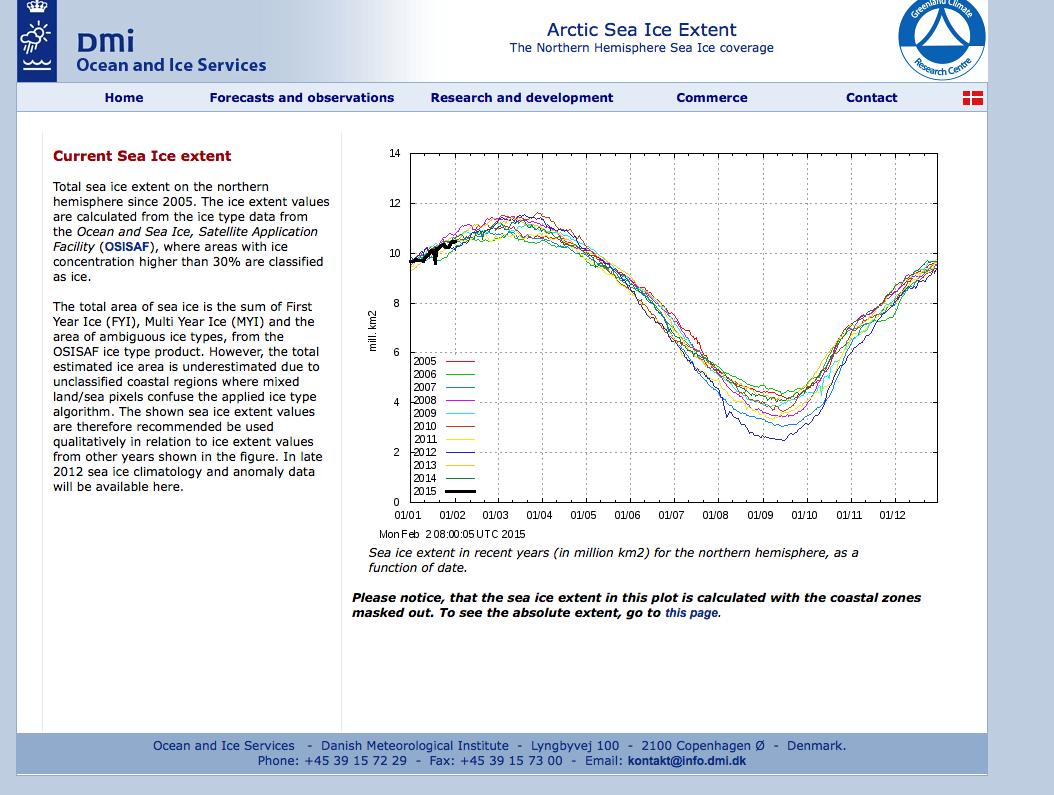
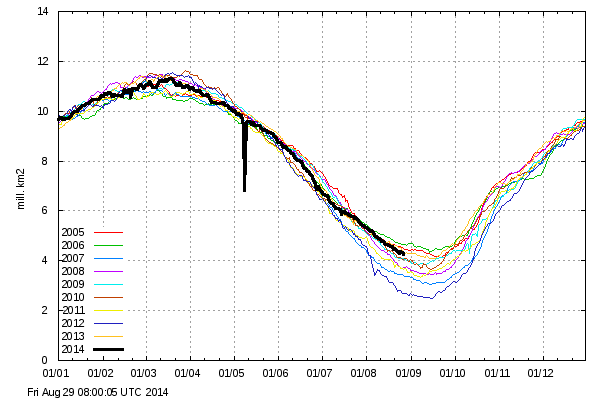
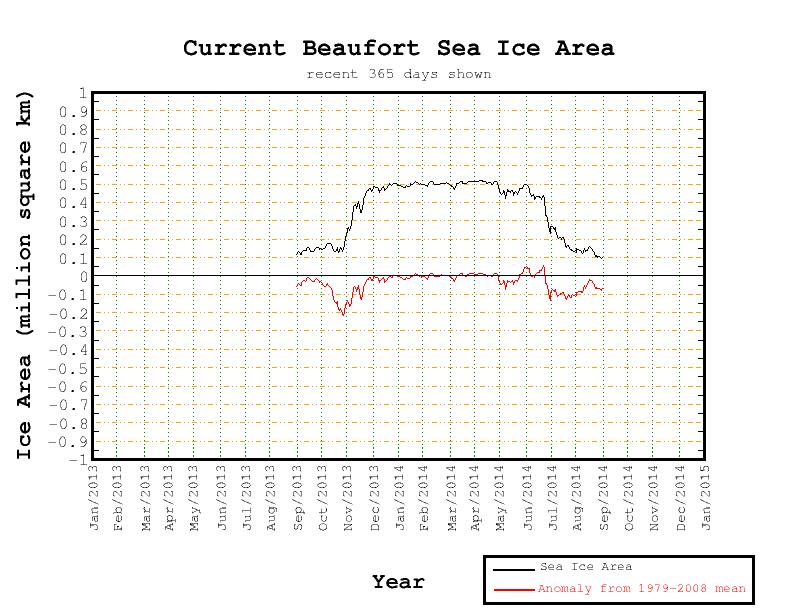
Chart from Cryosphere Today – http://arctic.atmos.uiuc.edu/cryosphere/arctic.sea.ice.interactive.htmlChart from IJIS – http://www.ijis.iarc.uaf.edu/en/home/seaice_extent.htmChart from DMI – http://ocean.dmi.dk/arctic/icecover.uk.phpChart from DMI – http://ocean.dmi.dk/arctic/old_icecover.uk.php
Here’s a table of the minimum value of some of those metrics for a selection of years:
In brief “Al Gore never ‘predicted’ that the Arctic would be ice-free by now!”
Them:
Well, he didn’t say ’22 years from now’, did he? No, he emphasized the most alarmist position he could find.
You can weasel out of this by stating that Gore did not make the prediction ,but he sure as Hell quoted and emphasized it, over any and all other predictions. And in front of the Nobel committee and entire world at that!
So have you confronted Gore over the failed prediction he parroted in Oslo? When you do, you will have a modicum of credibility. Get busy.
Us:
At the risk of repeating myself, “for the benefit of those who seem unable to understand either English or Mathematics a ‘projection’ is not the same thing as a ‘prediction’”
Getting back to Tony’s predictions, and using the NSIDC daily extent numbers for the moment, would you say that 4.98339 is “exactly” 5.74877? How about “close”?
Them:
Actually, no, your chart is less clear. Steve’s has all the years and it is clear his prediction is correct. Yours does not. Nor does yours have a legible legend. Another snow white lie.
Us:
Have you by any chance tried clicking on my chart? Does that help at all?
At the risk of repeating myself, would you say that 4.98339 is “exactly” 5.74877? How about “close”?
Them:
What bearing does 2013’s minimum have on goddard’s prediction for 2014? Are you a half-wit in addition to being a mentally ill stalker & transvestite?
Us:
What bearing does 2014’s maximum have on 2014’s minimum?
Are you blind?
Them:
You seem to think that some random number you came up with has some bearing on the subject at hand. Hint: it’s why we think you’re mentally ill.
Us:
Of course they’re not random numbers. To save you the bother of doing your own research please feel free to take a look at:
Stark, it’s not about random numbers, it’s about random harassment. This clown takes no issue with ridiculous ‘projections’ delivered by alarmist zealots on a world stage, instead he haunts this site moaning about near misses.
But you are right about the mentally ill bit.
Us:
The conversation about the non-random Arctic numbers has at last taken a statistical turn over at:
I don’t usually get involved in debates about “the global warming pause”, but as you will eventually see there is an Arctic connection, so please bear with me. Personally I reckon “global heat” is more relevant than “global surface temperature”, but nevertheless NASA and NOAA issued a “news release” a couple of days ago stating that:
The year 2014 ranks as Earth’s warmest since 1880, according to two separate analyses by NASA and National Oceanic and Atmospheric Administration (NOAA) scientists.
The 10 warmest years in the instrumental record, with the exception of 1998, have now occurred since 2000. This trend continues a long-term warming of the planet, according to an analysis of surface temperature measurements by scientists at NASA’s Goddard Institute of Space Studies (GISS) in New York.
In an independent analysis of the raw data, also released Friday, NOAA scientists also found 2014 to be the warmest on record.
The announcement was accompanied by this video:
I figured our old friend David Rose would have something to say about all that in the Mail on Sunday, and I was not disappointed. Yesterday David reported, in bold headlines:
Nasa climate scientists: We said 2014 was the warmest year on record… but we’re only 38% sure we were right
Nasa’s Goddard Institute for Space Studies claimed its analysis of world temperatures showed ‘2014 was the warmest year on record’
But it emerged that GISS’s analysis is subject to a margin of error
Nasa admits this means it is far from certain that 2014 set a record at all
David Rose includes this NASA video in the online version of his article:
which finishes up showing the Arctic blanketed in red for the period 2010-14. In the body of the article David suggests that:
GISS’s director Gavin Schmidt has now admitted Nasa thinks the likelihood that 2014 was the warmest year since 1880 is just 38 per cent.
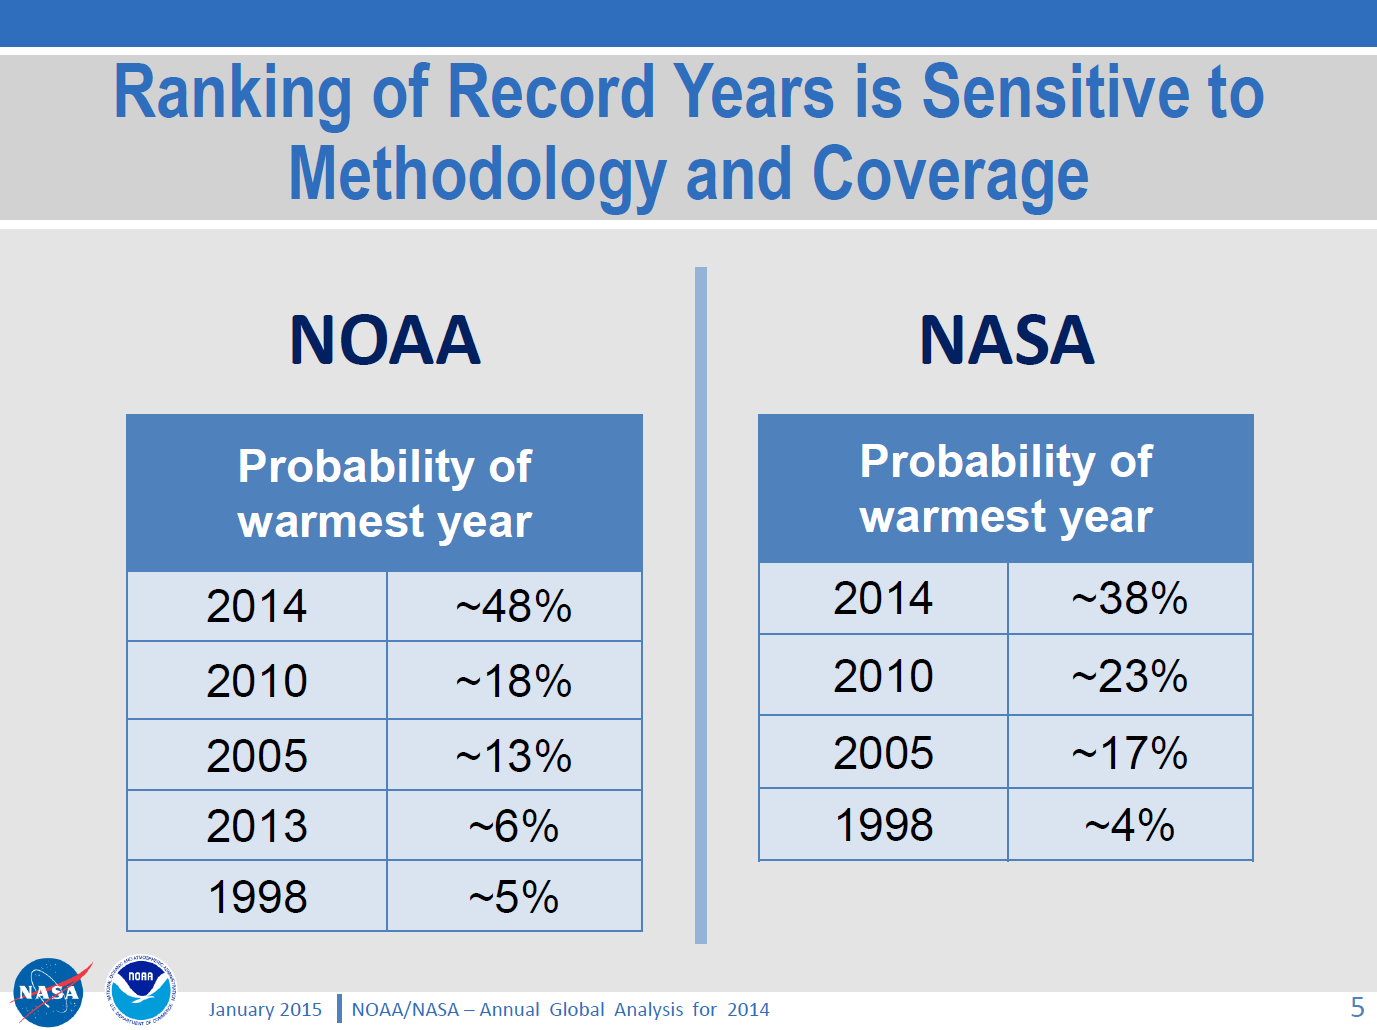
but for some strange reason David neglects to mention this NASA/NOAA “press briefing“, which includes the following figure:
As you can see and hear, Gavin Schmidt’s “admission” was pretty public, and available for anyone doing their due diligence on this thorny topic to see well before the Mail on Sunday published David Rose’s article. For still more from Gavin see also the second half of yet another video from NASA, which we’ve hastily made embeddable from YouTube since NASA’s Goddard Space Flight Center don’t seem to have done so themselves as yet:
[Edit – 23/01/2015]
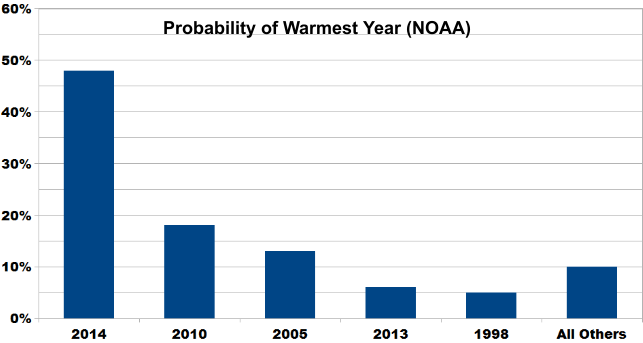
By way of further elucidation of the NASA/NOAA table of probabilities above, here’s a new graphic courtesy of Skeptical Science:
The probability of 2014 being the warmest year (due to margin of uncertainty and the small differences between years) is almost ten times that of 1998. And the contrarians were very certain that year was warm!
Does that help make things clearer, for those who evidently have difficulty understanding statistics?
[/Edit]
I also figured that the likes of “Steve Goddard” and Anthony Watts would be jumping on the same bandwagon, so you can imagine my disappointment when I discovered that they have both, unlike Gavin, blocked me from their Twitter feeds! Venturing over to the so called “Real Science” blog instead I discovered that Steve/Tony does at least read Gavin’s Twitter feed, although apparently not NASA/NOAA press briefings:
Them:
Implausible Deniability
Gavin is playing his usual game, trying to cover his ass with “uncertainty” that wasn’t mentioned in the NASA press release.
They get the propaganda out there for the White House and major news outlets, then try to generate implausible deniability through back channels like twitter. None of this was mentioned in the NASA press release.
Us:
I take it you weren’t on the call either Tony? Have you by any chance seen this press briefing?
THE DATA ON WEATHER AND CLIMATE (NASA AND NOAA) CAN BE COMPARED TO THE STOCK MARKET ON WALL STREET, MUCH CORRUPTION AND ALTERING. WE ARE NOT GUARANTEED A CERTAIN TEMPERATURE EVERYDAY; ALTHOUGH, THAT IS WHAT THEY WOULD HAVE US THINK, JUST BECAUSE OF SEASONS IN GENERAL.
Further to previous correspondence on similar matters, on January 27th 2015 I received the following email from the Personal Assistant to John Wellington, David Rose’s managing editor at the Mail on Sunday:
Dear Jim,
Thank you for your email.
I am afraid the best person to deal with your question is John Wellington who will reply on his return at the beginning of March.
Thank you for your patience.
Kind regards
Poppy Hall
Us:
CC: IPSO.co.uk
Dear Poppy,
Thanks for that information, but I am afraid my almost infinite patience in this matter is exhausted.
In John’s absence perhaps I might reiterate a question posed by Bob Ward of The Grantham Institute on Twitter yesterday:
Predictable that Mail on Sunday censored all letters pointing out errors in last week's article by @DavidRoseUK about @NASAGISS
Please would you ask whoever owns the desk on which the buck currently stops for the article entitled “Nasa climate scientists: We said 2014 was the warmest year on record… but we’re only 38% sure we were right” by David Rose to communicate with me as soon as possible. FYI – Here it is:
As I’m sure you must realise by now, unfortunately it includes some inaccurate and/or misleading statements which as far as I can ascertain have still not been publicly corrected.
Best wishes,
Jim Hunt
Post Script:
Bob Ward lodged a formal complaint with the Independent Press Standards Organisation about the Mail on Sunday article. Their conclusion?
The complaint was not upheld.
Remedial Action Required – N/A
Date complaint received: 13/02/2015
Date decision issued: 22/06/2015
Their “reasoning”?
The Committee noted that information about the margin of error had been made available by GISS, but that it was not in dispute that these details had been omitted from the press release. The article had made clear that this specifically was the basis for its criticism of Nasa, and the newspaper was entitled to present its view that this omission represented a failure on the part of the organisation. While the information had been released by Nasa, it had been released to a limited selection of people, in comparison to those who would have had access to the press release, and had not been publicised to the same level as the information in the release. The press briefing images referred to by the complainant were available on Nasa’s website, but were not signposted by the press release. In this context, it was not misleading to report that the information relating to the margin of error had emerged in circumstances where the position was not made clear in the press release. While these details of the margin of error may have been noted in a press briefing two days previously, rather than “yesterday”, as reported, this discrepancy did not represent a significant inaccuracy requiring correction under the terms of the Code.
The most widely used measurements of Arctic ice extent are the daily satellite readings issued by the US National Snow and Ice Data Center, which is co-funded by NASA.
He also stated that:
For years, many have been claiming that the Arctic is in an ‘irrevocable death spiral’, with imminent ice-free summers bound to trigger further disasters. These include gigantic releases of methane into the atmosphere from frozen Arctic deposits, and accelerated global warming caused by the fact that heat from the sun will no longer be reflected back by the ice into space.
Judith Curry, professor of earth and atmospheric sciences at Georgia Institute of Technology in Atlanta, said last night: ‘The Arctic sea ice spiral of death seems to have reversed.’
All of which got me thinking. Why did David Rose speak to a professor of earth and atmospheric sciences when researching his article, rather than an expert on Arctic sea ice? Why, indeed, did he not speak to the man who originally coined the “Death spiral” metaphor? Seeking answers to these troubling questions amongst others, I called the National Snow and Ice Data Center in Boulder, Colorado. I enquired whether I might be able to speak with Mark Serreze, who is currently director of the NSIDC. Shortly after that Mark called me back and I was able to ask him a number of questions.
My first question was whether David Rose or anyone from the Mail on Sunday had been in touch with the NSIDC recently. The answer was “No”. Next I enquired whether the “Death spiral” story was apocryphal or not. Mark told me he did recall saying something along those lines, but that he couldn’t recall the exact circumstances. Doing my own due diligence (unlike the Mail!) the earliest reference I could find suggested that “the circumstances” involved a telephone interview much like the one I was in the middle of. In an article dated August 27th 2008 the Reuters environment correspondent reported that:
This year’s Arctic ice melt could surpass the extraordinary 2007 record low in the coming weeks. Last year’s minimum ice level was reached on September 16, according to the National Snow and Ice Data Center.
Even if no records are broken this year, the downward trend in summer sea ice in the Arctic continues, the Colorado-based center said. Last year’s record was blamed squarely on human-spurred climate change.
“No matter where we stand at the end of the melt season it’s just reinforcing this notion that Arctic ice is in its death spiral,” said Mark Serreze, a scientist at the center. The Arctic could be free of summer ice by 2030, Serreze said by telephone.
Mark confirmed to me that he still stood by his 2030 estimate for the onset of a seasonally ice free Arctic, although “most models say more like 2050”.
Next I asked him whether he agreed that “The Arctic sea ice spiral of death has reversed.” He said that he agreed with the statement attributed to Dr. Ed Hawkins near the end of the Mail article, that “There is undoubtedly some natural variability on top of the long-term downwards trend caused by the overall warming“. However 2 years worth of data certainly didn’t constitute “a recovery”. It was more like “a one week retracement in the US stock market. The long term trend in extent is definitely downwards”.
In conclusion I asked Mark to offer his best estimate for Arctic sea ice extent at this summer’s minimum. He told me that even at this late stage some of that “natural variability” could affect the outcome, but that the NSIDC extent “will probably end up on a par with 2013”.
I have also had an email conversation with Andrew Shepherd, the British “expert in climate satellite monitoring” whose views about Arctic sea ice were reported in the Mail on Sunday’s article. He told me that:
Arctic sea ice cover is expected to continue to decline, with the possibility of ice-free summers in the next 20-30 years. Climate model predictions tend to be at the upper end of this range, whereas projections of past observations tend to be at the lower end. Once we are able to include direct measurements of thickness from CryoSat-2, I expect the accuracy of predictions will improve.
If nothing else changes, then the recovery in Arctic sea ice thickness will wind the clock backwards a few years, but there is no reason to believe this is anything other than a temporary reprieve due to one cool summer.
Finally, for the moment at least, I also called the Danish Meteorological Institute. Along with the NSIDC their Arctic sea ice extent figures were quoted by David Rose. Along with the NSIDC they told me that they had received no enquiries recently from Mr. Rose or anyone else at the Mail on Sunday.
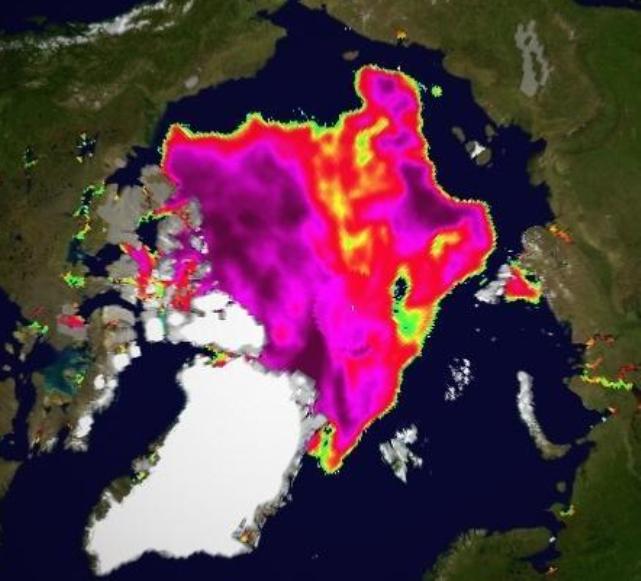
Regular readers may recall that way back when in September 2013 we wondered why David Rose hadn’t seen fit to reproduce any visualisations of Arctic sea ice concentration in a previous article about Arctic sea ice, particularly when his source materials from the NSIDC contained some very nice examples.
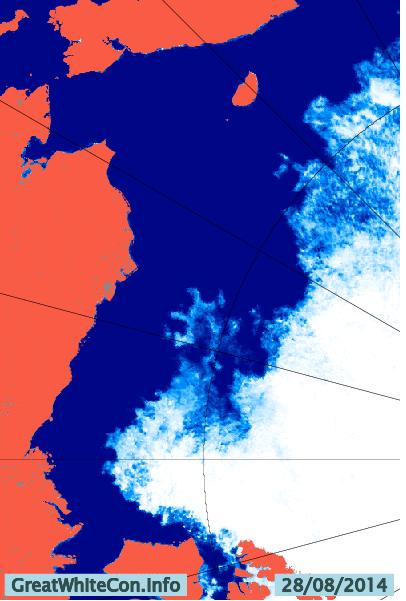
Today we are pleased to be able to inform you that David has now followed our long standing advice, and his article in the Mail on Sunday yesterday included two such “stunning satellite images”. Of course they are not really “photographic” images, any more than the visualisations of Arctic sea ice extent that David was so keen to show his loyal readers last time around were. Unfortunately David neglected to include a “stunning satellite concentration visualisation” for August 25th 2013 in yesterday’s article. We are pleased to be able to help correct that no doubt inadvertent oversight, albeit somewhat belatedly, with the able assistance of the Department of Atmospheric Sciences at the University of Illinois and their Cryosphere Today web site:
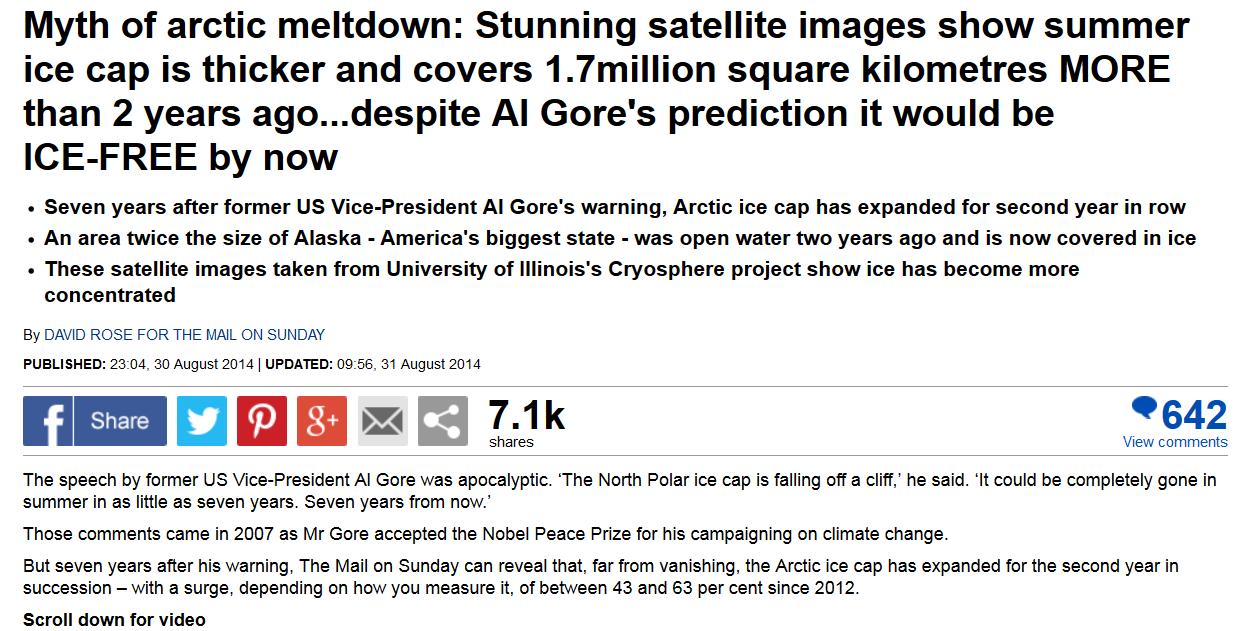
Stunning satellite images show summer ice cap is thicker and covers 1.7 million square kilometres MORE than 2 years ago…despite Al Gore’s prediction it would be ICE-FREE by now
Seven years after former US Vice-President Al Gore’s warning, Arctic ice cap has expanded for second year in row.
In the first paragraph of his article Mr. Rose continued:
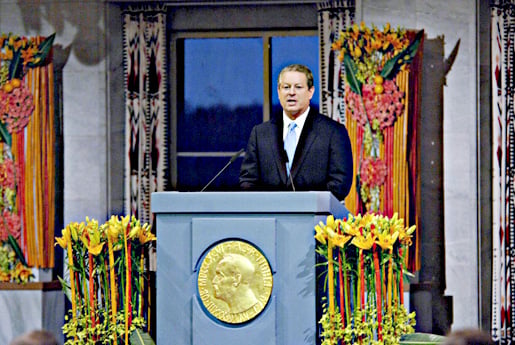
The speech by former US Vice-President Al Gore was apocalyptic. ‘The North Polar ice cap is falling off a cliff,’ he said. ‘It could be completely gone in summer in as little as seven years. Seven years from now.’
Those comments came in 2007 as Mr Gore accepted the Nobel Peace Prize for his campaigning on climate change.
But seven years after his warning, The Mail on Sunday can reveal that, far from vanishing, the Arctic ice cap has expanded for the second year in succession – with a surge, depending on how you measure it, of between 43 and 63 per cent since 2012.
Would it surprise you to learn that when it comes to reporting Nobel Prize acceptance speeches Mr. Rose has as much difficulty separating fact from fiction as he does when reporting on the state of the sea ice in the Arctic? What do you suppose Mr. Gore actually said in his Nobel lecture in Oslo in December 2007? It’s not hard to find out. Here’s a picture of the former US Vice-President at the time:
Skip to 4:30 minutes into the video and you will discover that what Al actually said was:
Last September 21st, as the Northern Hemisphere tilted away from the sun, scientists reported with unprecedented alarm that the North Polar ice cap is, in their words, “falling off a cliff.” One study estimated that it could be completely gone during summer in less than 22 years. Another new study, to be presented by U.S. Navy researchers later this week, warns it could happen in as little as seven years. Seven years from now.
For those who, like David Rose, apparently have difficulty in understanding English I suppose I now need to point out that the “falling off a cliff” phrase should be attributed to some unnamed scientists, not to Al Gore. You will no doubt have noted that Mr. Gore didn’t actually say the words put into his mouth by Mr. Rose, and that the sentiment that “it could happen in as little as seven years” is not in fact “Al Gore’s prediction” at all, and should instead be attributed to some unnamed “U.S. Navy researchers”.
For the hard of hearing amongst you:
Al Gore never “predicted” that the Arctic would be ICE-FREE by now!
Would it surprise you to discover that David Rose has misrepresented the “new study” that Al Gore referred to in 2007 as well, by some strange coincidence at around this time last year? I refer you to our article on that topic from September 15th 2013, and reiterate for the benefit of those who seem unable to understand either English or Mathematics that a “projection” is not the same thing as a “prediction”, and that Professor Wieslaw Maslowski’s statement that “if this trend persists the Arctic Ocean will become ice-free by around 2013” is not at all the same thing as David Rose’s (mis)interpretation that “The Arctic will be ice-free in summer by 2013”.
The obvious conclusion, or so it seems to me at least, is that Mr. Rose should stop pretending to be an investigative reporter and concentrate in future on his evident talent as a writer of speculative fiction.
[P.S. September 2nd 2014]
For some strange reason this post seems to have attracted a lot of interest over on Twitter. Here are the edited highlights!
According to David Rose’s latest article in the Mail on Sunday it has. This came as shock news to me, because only a couple of days ago I was discussing with “Steve Goddard” how Arctic sea ice extent (using “Steve’s” patent pending personal “DMI 30% clone” metric) had actually decreased since the same time last year!
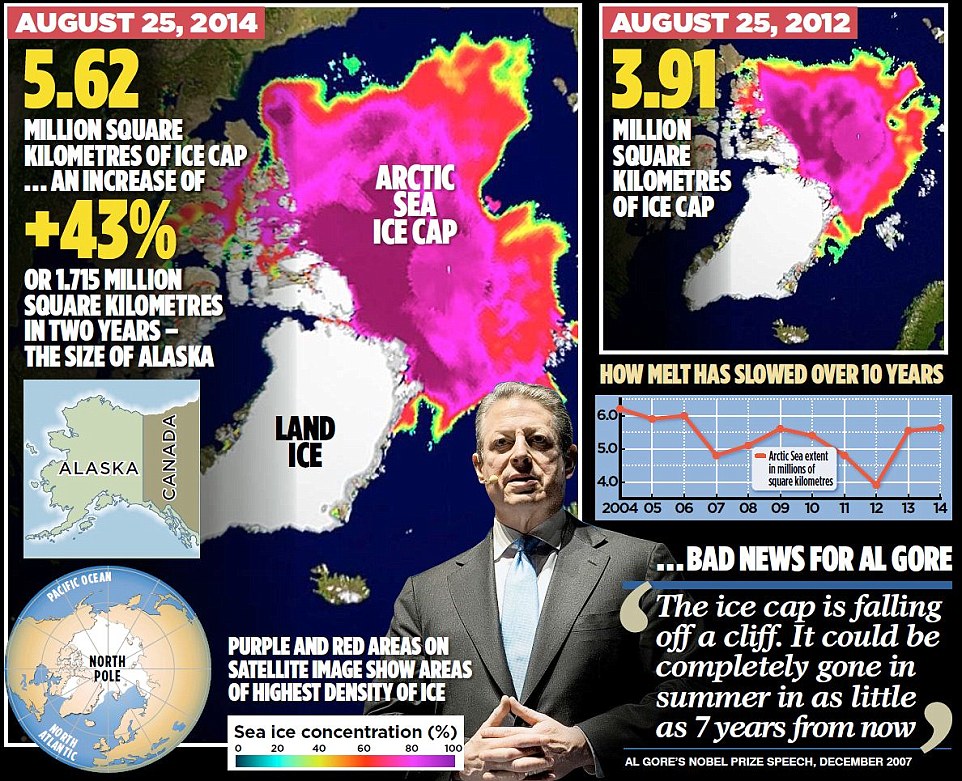
Before we delve deep into the data, and before the Mail on Sunday makes any “corrections” to David’s misleadingly purple prose, here’s how things look over there at the moment:
Them:
As you can see, the Mail’s main claims are:
Seven years after former US Vice-President Al Gore’s warning, Arctic ice cap has expanded for second year in row
An area twice the size of Alaska – America’s biggest state – was open water two years ago and is now covered in ice
These satellite images taken from University of Illinois’s Cryosphere project show ice has become more concentrated
not to mention that:
The Mail on Sunday can reveal that, far from vanishing, the Arctic ice cap has expanded for the second year in succession – with a surge, depending on how you measure it, of between 43 and 63 per cent since 2012.
For some strange reason David neglects to include any numbers for 2013, so….
Us:
A quick telephone call revealed that John Wellington doesn’t work at the Mail on Sunday’s, so I sent him an email instead:
“The Mail on Sunday can reveal that, far from vanishing, the Arctic ice cap has expanded for the second year in succession”
I don’t suppose David and/or the Mail on Sunday can provide any data to back up that assertion can they?
Best wishes,
Jim Hunt
Them:
Hello Jim,
I did wonder if we would be corresponding, again.
I will be in touch after the weekend.
Best regards
John
Us:
Hi Tessa,
I’m working on the assumption that you are still responsible for this subject. If not perhaps you can pass this email on to the relevant person?
David Rose is talking about the Arctic on the Mail Online again, so I’m attempting to comment again. Yet again I can’t see my comments (under the nom de guerre “SoulSurfer”) anywhere underneath the article in question. Can you look into it please, and let me know what the problem is?
To make things easier for you I’ve just commented for the third time this morning, as per the enclosed attachment.
Thanks,
Jim Hunt
Them:
In an email dated September 6th 2014:
Dear Jim,
Sorry not to reply sooner. The article relied on data from the US National Snow and Ice Data Centre comparing ice cover on the same date, August 25. In 2012 the figure was 3.91m sq miles, in 2013 it was 5.59m and in 2014, 5.62m. You may wish to note that the article did point out that the long-term trend is still downward.
Best regards
John
Us:
In an email dated January 24th 2015:
Dear John,
Sorry not to reply sooner. The PCC decided to laboriously mutate into something called IPSO right around the time of the 2014 Arctic sea ice minimum extent. Hence the brief hiatus. However David Rose is at it again, and he’s now even discussing tricky things like “probabilities”! IPSO do now seem to be getting their act together as well. Did you see their “open letter to publishers” last month?
No doubt I will have more than a few bones to pick with David’s article last weekend, not to mention the subsequent one by Victoria Woollaston. Is that one your responsibility too? For the moment though, perhaps we can pick up where we left off last summer?
Thanks for your information about the long term Arctic sea ice trend and the NSIDC extent numbers. However the article in question also states:
“Figures from the Danish Meteorological Institute suggest that the growth has been even more dramatic. Using a different measure, the area with at least 30 per cent ice cover, these reveal a 63 per cent rise – from 2.7 million to 4.4 million square kilometres”.
Where did David get those DMI numbers from? I asked the DMI, and even they didn’t seem to know!
Best wishes,
Jim Hunt
Them:
In the absence of any response from John I called the Mail offices on January 26th 2015. It seems John is out of the office for the next two weeks. His PA is now looking into matters for me.
Us:
I sent a further email to John and Poppy on February 2nd 2015:
Them:
Dear Jim,
If you have a complaint about last Sunday’s article, you should set out exactly what it is. If you disagree with any opinions expressed you are welcome to write a letter that we will consider for publication.
You mention that you have sent us a number of inquiries recently. The only other, to my knowledge is that you wanted to know the source of some data that David Rose mentioned in an article some months ago. David Rose told me it came from the official website. Perhaps my colleague Poppy Hall can find it for you since David is probably unwilling to help after your insult.
Best regards,
John
Us:
Dear Poppy (and John)
Please would you ask David to let me know where exactly, and on which “official website”, he obtained the DMI extent numbers he quoted in his article last Summer?
FYI John, at Poppy’s suggestion I have also emailed the editorial team @MailOnline. They have yet to even acknowledge receipt of my email of January 26th.
Best wishes,
Jim Hunt
Them:
Dear Jim,
David is unable to find the table with the numerical data. But he says that the graph here from the DMI website makes it clear that if you look at 30% concentration, the figures he gave were correct.
I hope this answers your query.
Kind regards,
Poppy
Us:
Dear Poppy,
Just to clarify, the facts of the matter are that David Rose did NOT obtain the DMI numbers he quoted last summer from a “table with the numerical data” on an “official website”?
Needless to say we are unimpressed by the following explanation:
Them:
The Danish Meteorological Institute shows a 63% increase in Arctic sea ice extent since the same date in 2012, and an increase of 76% since the 2012 summer minimum. Current extent is 4.4 million km², up from 2.7 million km² on August 28, 2012.
My methodology is similar numerically to DMI’s, I used maps from the Japan Aerospace Exploration Agency to generate the map below. Green shows ice gain since the same date in 2012, and red shows ice loss. My calculation shows a 64% increase in ice, almost identical to the calculations from DMI.
A favorite comment from alarmists is “the increase in ice extent is meaningless, because the ice is getting thinner“
They have it exactly backwards. The reason why ice extent is up, is because the ice is thicker.
Mind you I’m not the one proudly proclaiming “ice extent is up, because the ice is thicker.”. Steve/Tony is, but for some strange reason he provides visualisations of extent and age but not thickness!
Them:
Lets put it another way. Age of the ice is a proxy for ice thickness. But, if you don’t believe in proxies, just tell us.
Us:
Les – If you believe in proxies then PIOMAS Arctic sea ice volume for April 2014 was less than April 2012.
If instead you prefer the evidence of your own eyes then perhaps you can explain where all that red stuff in the Beaufort Sea in Steve/Tony’s animation has gone?
If “older, thicker ice is moving towards Alaska” then it looks like it’s melting there, not “accumulating”.
Them:
Mr. Hunt’s evidence…..
“NRL does not warrant or represent this INFORMATION is fit for any particular purpose,”
Us:
Anything/Gail/Sophie – Do you have any idea what this is?
Them:
Here’s a quick summary for people who aren’t following.
SG makes a post comparing 2012 and 2014. Jim argues with SG’s claim of thicker ice by comparing 2013 extent to 2014. When that gets called out, he shows the same silly 2014 plot that has no 2012 plot to compare to…still no valid comparison. After some back-and-forths and tangents, he brings up PIOMAS. When asked to compare thickness in PIOMAS 2012/2014, he avoids the question (twice).
Is there a single metric out there showing 2014 to be worse than 2012?
– Scott
Us:
Here’s a quick summary for you Scott:
Where’s all the “older, thicker ice in the western Arctic” that SG keeps referring to hiding?
Them:
Nice image, Jim. You have chosen a metric. So that’s half the story. Where’s the 2012 equivalent of that image so we can see if SG is wrong about 2014 vs 2012?
-Scott
Us:
Thank you for your kind words Scott.
I haven’t “chosen a metric”. I have nonetheless already shown you one comparison with 2013, using TH’s very own “metric”. To complete the story, and at the risk of repeating myself once again, perhaps you can explain where all the “older, thicker ice accumulating on the Pacific side” that TH keeps referring to is hiding?
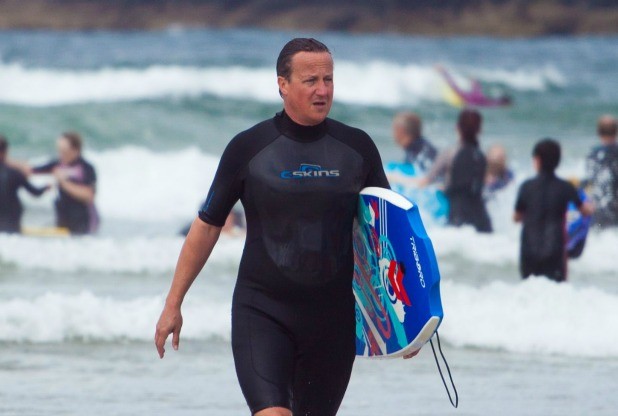
Shock News! It has recently been brought to our attention by the online version of the Western Morning News (WMN for short), our local daily newspaper, that the once Great Britain’s current Prime Minister (GBPM for short) has been secretly training for next week’s Arctic Basin big wave surfing contest just down the road from here in North Cornwall! According to the WMN:
David Cameron let criticism of his Cornish holiday wash over him today as he hit the waves. Today he spent the afternoon riding the waves on the beach at Polzeath, surrounded by ordinary holidaymakers. Mr Cameron took to the water in a three quarter-length wet suit and brightly-coloured bodyboard. He was accompanied by a detective who kept a discreet watch on him from the shallows.
Despite the discreet detective an intrepid paparazzo braved the pounding Polzeath surf and managed to grab this shot of Mr. Cameron in action:
The next obvious question, to us here in the Great White Con Ivory Towers at least, is whether Dave would prefer to wear neoprene or fur for the competition next week. Which do you think suits him best?
In the meantime the surf on Barrow beach is building:
and even as we speak a pulse of swell has blasted past Point Barrow and is currently heading straight for the Beaufort Sea Marginal Ice Zone.
Our headline for today is only partially plagiarised from today’s “Arctic Shipping Update” article on “Steven Goddard’s” (un)Real Science blog. This morning Tony Heller posted the following ACNFS Arctic sea ice concentration visualisation:
Them:
Climate experts say that Northeast and Northwest Passages are open for business, but neither will open up this year.
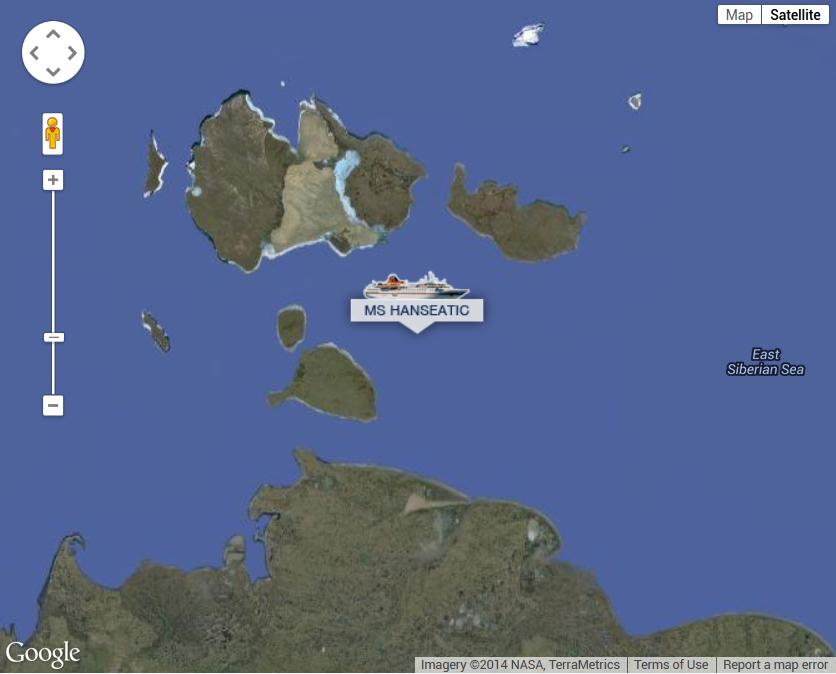
One of them is the Hapag-Lloyd cruise ship MS Hanseatic, which is currently wending its way through the New Siberian Islands:
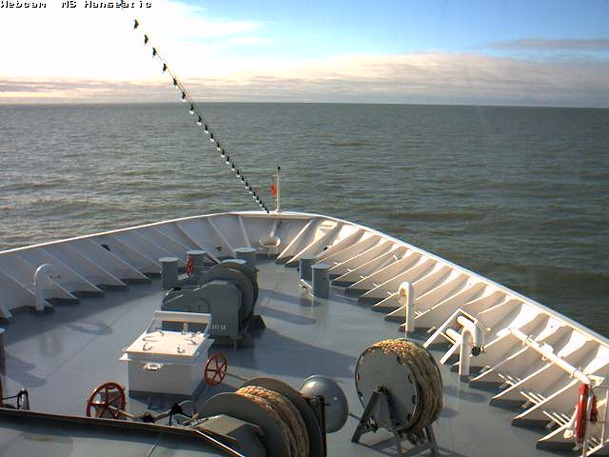
The Hanseatic also carries a webcam. Here’s what it reveals at the moment:
It’s currently pretty plain sailing on that section of the Northern Sea Route by the look of things!
Us:
By the morning of Sunday August 24th (UTC) my dissenting comment had been released from limbo, although it had remained there the previous evening. Them:
Somebody is telling a story aren’t they? Perhaps you’d like to tell us where the ship is. On the one hand I see a ship with the name Silver Explorer stuck in the ice, and then on the other I see your picture with green ice free waters. Everybody is going to be looking for this vessel now. Anybody with a satellite phone? Maybe they will wait it out till the ice thaws, like they did at the other pole. I will be saving that pretty picture of green, just in case you told us so.
Us:
Are you aware of the difference between the Northwest Passage and the Northern Sea Route, which is sometimes referred to as “the Northeast Passage”? That “pretty picture of green” is of the latter. Here’s the current position of the cruise ship MS Hanseatic in the Laptev Sea, coloured green on the map above:
Shock News! Over in the denialosphere at the (un)Real Science blog I’ve been challenged to yet another Arctic sea ice bet. This one now seems to be signed and sealed, but will probably have to wait a few years before it is delivered:
Them:
Have you come up with the terms of our bet yet? I have yet to find one single alarmist willing to bet their house on an ice free Arctic at any time over the next 20 years, I may have to extend to 30 years, though the amount of cigarettes I smoke, I doubt I will be around that long.
Us:
Having personally discussed the matter with Rear Admiral Jon White:
and having since publicly stated that I’m more pessimistic than him, how about $1000 in favour of ShelterBox on CT area < 1 mio square kilometers by the summer of 2022 at the latest?
Them:
$1000 on CT area being less than 1 million square kilometres at some point between now and 2022 sounds fine to me, we have a bet. Remember, this is where to send your $1000
Meanwhile I’ve been trying to find someone, anyone, willing to don a polar bear suit and then stand up on a surf board. I have yet to find one single “skeptic” willing to accept my challenge to become part of the “Great Green Con” Arctic surf team. First in line for an invitation was “Steve Goddard” (AKA Tony Heller):
Them:
Within a week, a cyclone will be spreading Arctic sea ice, and extent will flat line or increase.
Us:
I’m following that cyclone with much interest too Tony! What’s your Arctic surf forecast?
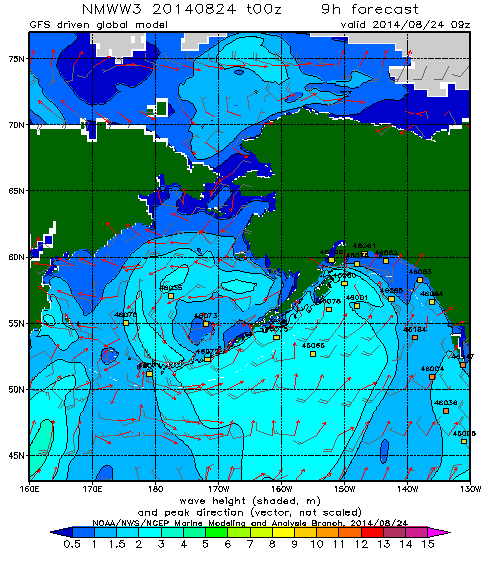
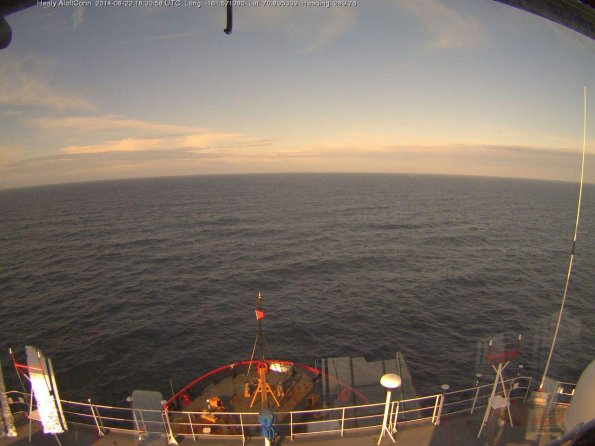
Whilst we wait for a “skeptic” willing to stop doing a chicken impression and start impersonating a polar bear to reveal themself, how is the surf in the Chukchi Sea coming along? There are already some signs of a building swell to be seen. The US icebreaker USCGC Healy is currently bobbing about on a modest swell off Barrow:
Whilst onshore a modest wave can currently be seen breaking on Barrow beach:
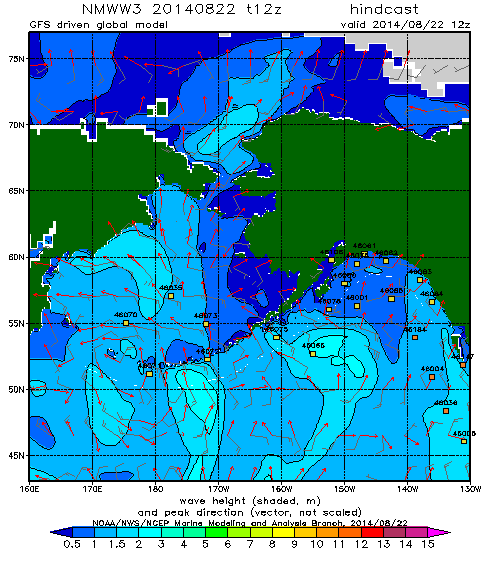
Here’s what that swell looks like on the WaveWatch III nowcast:
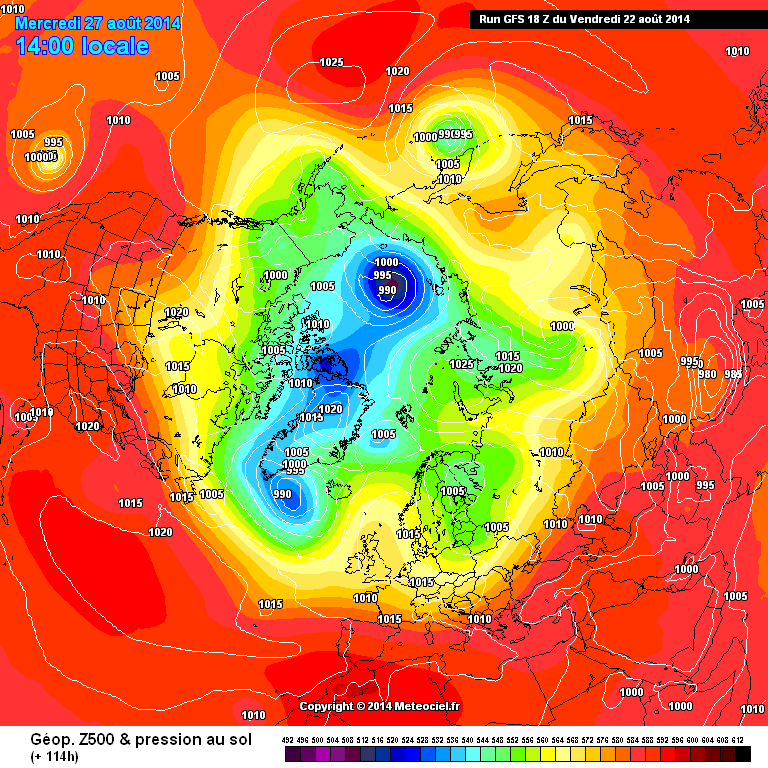
Meanwhile the cyclone brewing in the Arctic is now forecast to have a central pressure below 990 mb next week, by GFS at least:
We’ll keep you posted!
This website uses cookies to improve your experience. We'll assume you're ok with this, but you can opt-out if you wish. Cookie settingsACCEPT
Privacy & Cookies Policy
Privacy Overview
This website uses cookies to improve your experience while you navigate through the website. Out of these, the cookies that are categorized as necessary are stored on your browser as they are essential for the working of basic functionalities of the website. We also use third-party cookies that help us analyze and understand how you use this website. These cookies will be stored in your browser only with your consent. You also have the option to opt-out of these cookies. But opting out of some of these cookies may affect your browsing experience.
Necessary cookies are absolutely essential for the website to function properly. This category only includes cookies that ensures basic functionalities and security features of the website. These cookies do not store any personal information.
Any cookies that may not be particularly necessary for the website to function and is used specifically to collect user personal data via analytics, ads, other embedded contents are termed as non-necessary cookies. It is mandatory to procure user consent prior to running these cookies on your website.