We’ve recently been speculating about the effect on the sea ice in the Arctic of varying amounts of weather borne heat, wind and waves. The cumulative effect of all the assorted storms is that today a variety of sea ice metrics are all at their lowest ever level for the date, since their respective records began.
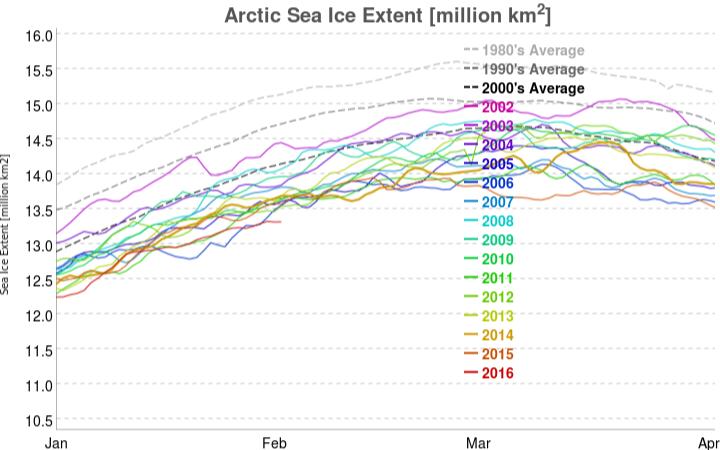
The JAXA/ADS extent was the first to fall below all previous years, and here’s how it looks today:
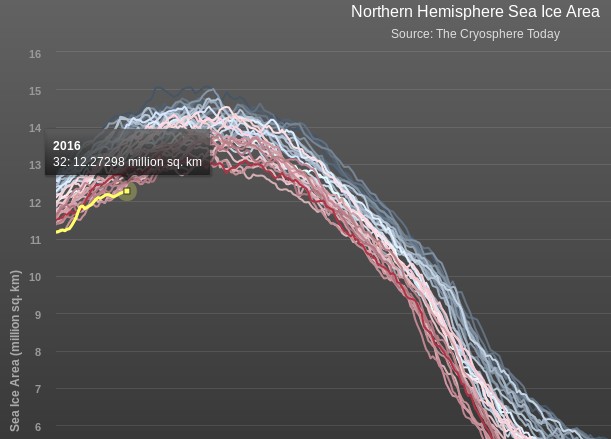
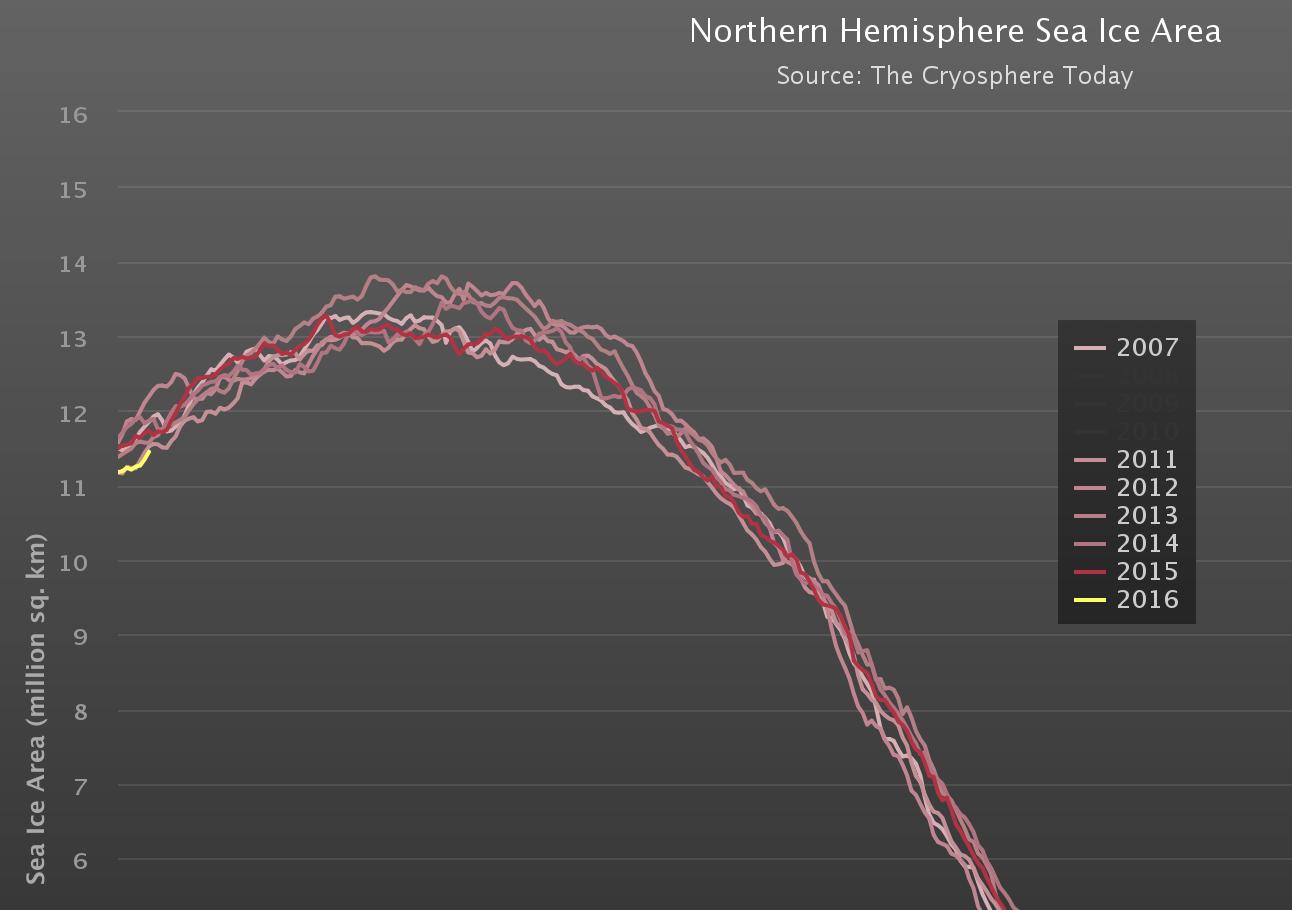
Note that it shows extent currently decreasing. Next came the Cryosphere Today area, which has also just decreased from the day before:
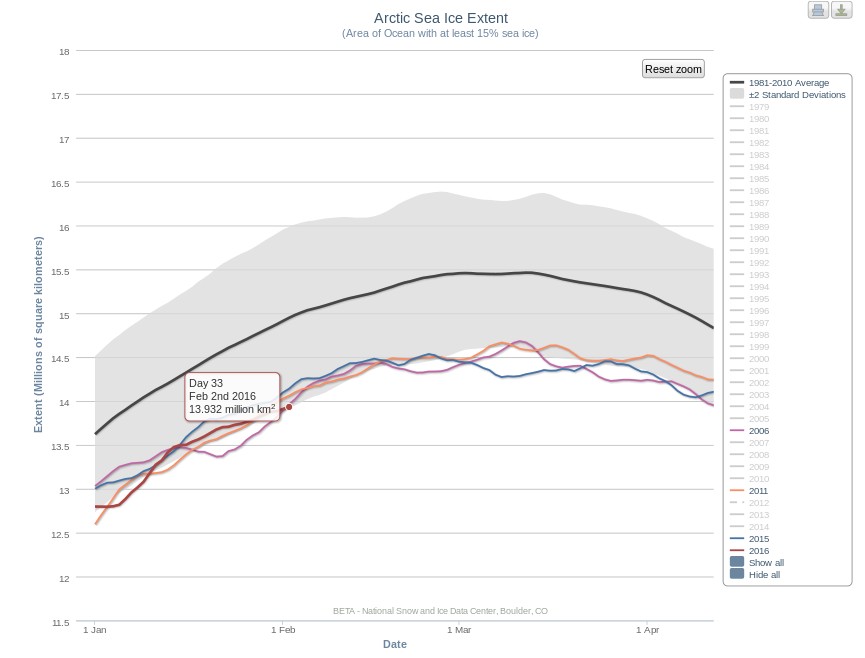
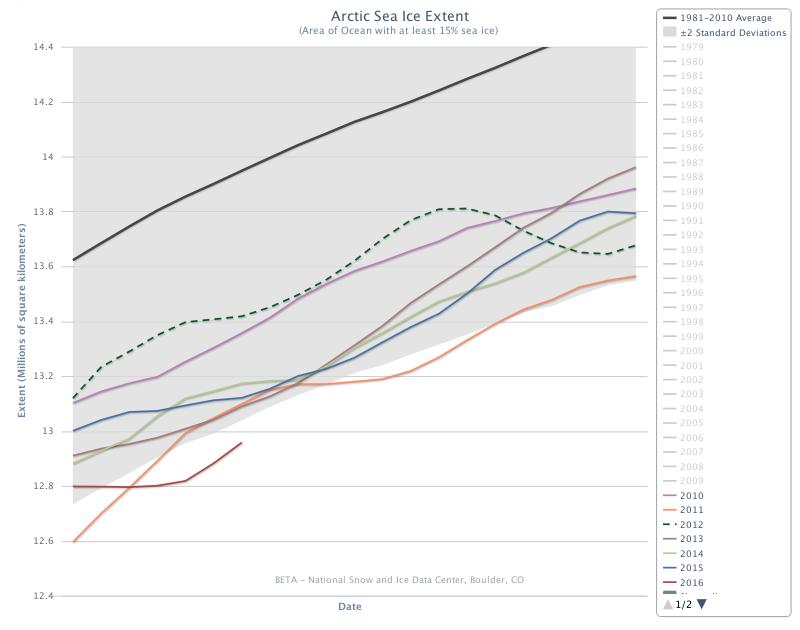
The latest metric to join the club is the 5 day averaged version of the NSIDC Arctic sea ice extent, which currently reveals:
Would any brave reader care to hazard a guess where and when the assorted Arctic sea ice metrics will eventually reach their maximum values for 2016?
We speculated a few days ago about whether the “Son of Storm Frank” might have battered Britain by now, and be sending a 10 meter swell past Svalbard towards the Arctic sea ice edge. That’s not quite how things have worked out in practice however! We haven’t had another named storm affecting the United Kingdom directly, but we have received a series of long distance swells from a sequence of hurricane force storms further out in the North Atlantic. I even managed to test my Arctic surfing equipment by personally partaking in the swell generated by Hurricane Alex!
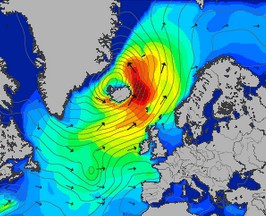
Moving from the water into the air, here’s the Danish Meteorological Institute’s forecast for Greenland tomorrow:
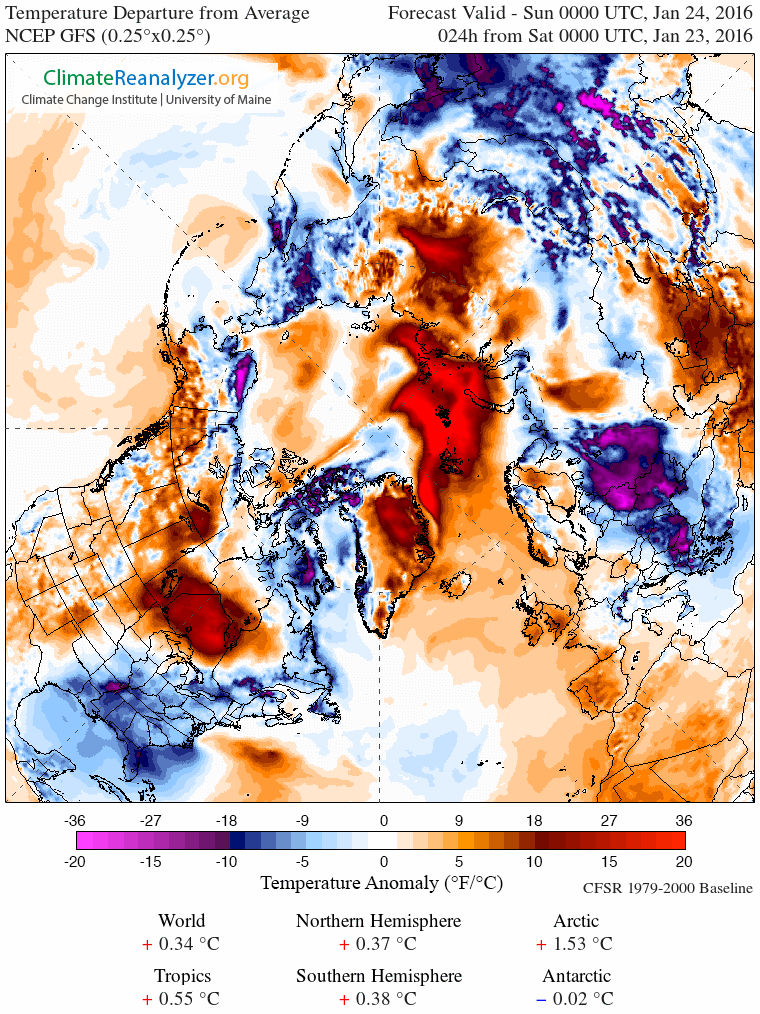
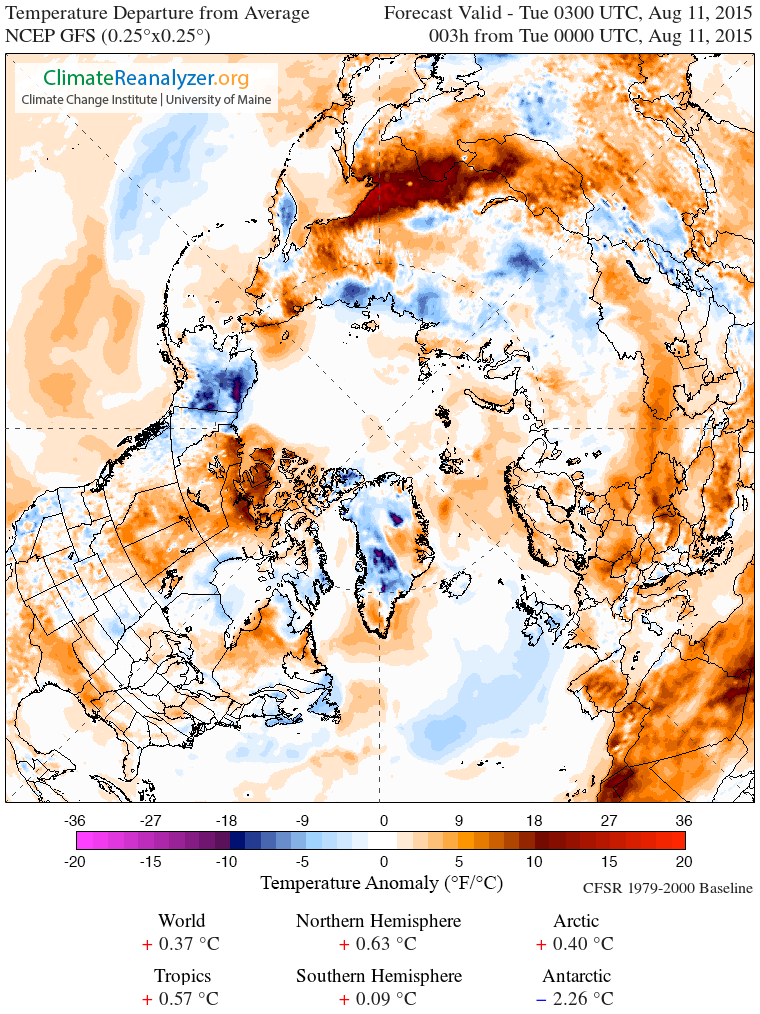
If you’re at all familiar with isobars you’ll note yet another storm off Southern Greenland and that comparatively warm, moist air will be heading up the east coast of Greenland towards the Fram Strait, albeit not at the speeds generated by Storm Frank! As a consequence here is Climate Reanalyzer’s surface temperature anomaly map for first thing tomorrow:
and here is how it looks by Wednesday lunchtime:
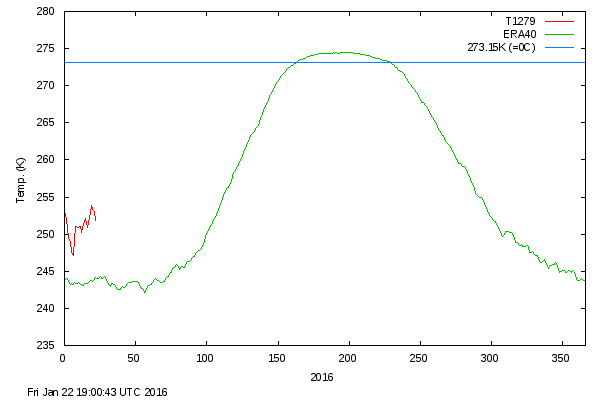
As you can see, the ultimate effect of the recent hurricane force storms in both the Atlantic and the Pacific is to attack the Arctic with warm, moist air from both sides. Whilst we wait to see exactly how this much shorter term forecast pans out, particularly at the North Pole itself, the DMI’s graph of temperatures in the central Arctic has burst back into life after a “brief hiatus” in the New Year. Here’s how it looks at the moment:
Our regular reader(s) may recall that this time last year we took umbrage at an article by David Rose in the Mail on Sunday about the joint NASA/NOAA press briefing outlining their findings about global surface temperatures in 2014.
We’ve been discussing Mr. Rose’s recent misleading “Tweets” about the Arctic with him:
As a consequence we also found ourselves in conversation with Gavin Schmidt of NASA about this year’s NASA/NOAA press briefing about global surface temperatures in 2015, which takes place on January 20th. Pencil it into your diary:
Climate experts from NASA and the National Oceanic and Atmospheric Administration (NOAA) will discuss the release of new data on 2015 global temperatures, and the most important weather and climate events of the year, during a media teleconference at 11 a.m. EST Wednesday, Jan. 20.
The teleconference panelists are:
Gavin Schmidt, director of NASA’s Goddard Institute for Space Studies in New York
Thomas R. Karl, director of NOAA’s National Centers for Environmental Information in Asheville, North Carolina, and chair of the Subcommittee on Global Change Research for the U.S. Global Change Research Program in Washington
Media can participate in the teleconference by calling 888-790-1804 (toll-free in the United States and Canada) or 415-228-4885 (international) and use the passcode “climate.”
Audio of the briefing, as well as supporting graphics, will stream live.
Whilst we wait with bated breath for the NASA/NOAA announcement, here’s how the Gavin, David & Snow show has been going over on Twitter:
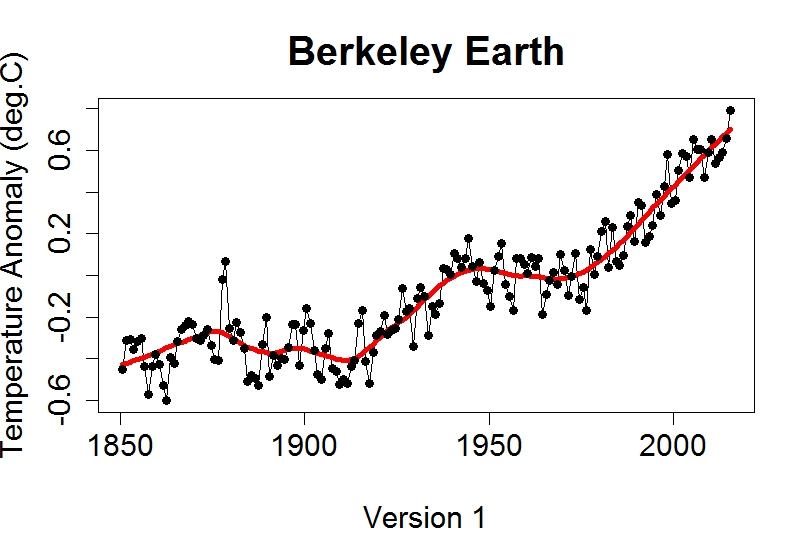
You will note from the exchange on Twitter that the Berkeley Earth Surface Temperature project are one of the organisations that have already declared 2015 “The Warmest Year in the Modern Record”, which brings me to the Arctic connection. Tamino explains over at “Open Mind”, in an article entitled “Hottest Year On Record“:
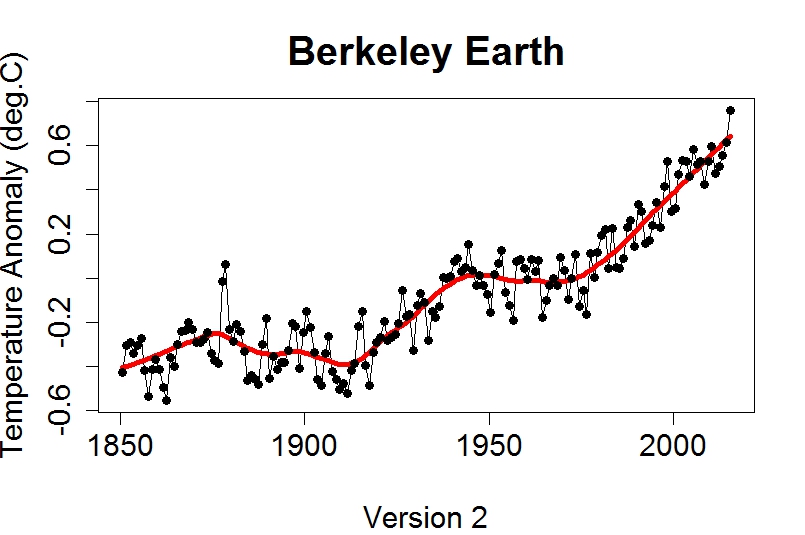
When it comes to global temperature over land and sea, Berkeley produces two versions, different in the way they treat areas covered with sea ice. Version 1 uses air temperature estimates for sea-ice covered regions, version 2 uses ocean temperature estimates.
and quotes BEST as follows:
For most of the ocean, sea-surface temperatures are similar to near-surface air temperatures; however, air temperatures above sea ice can differ substantially from the water below the sea ice. The air temperature version of this average shows larger changes in the recent period, in part this is because water temperature changes are limited by the freezing point of ocean water. We believe that the use of air temperatures above sea ice provides a more natural means of describing changes in Earth’s surface temperature.
As Tamino puts it:
Let’s not keep you in suspense any longer. Here are annual averages through 2015 (which is now complete) according to version 1:
Here it is according to version 2:
Any way you look at it, 2015 is the hottest. Any way you look at it, there was no “pause” in global temperature.
[Edit – 17:30 UTC on January 20th 2016]
The joint NASA/NOAA media briefing on 2015 global average surface temperatures has just finished. The recording of the event is due to go online “in 2 hours” or so from:
I waited patiently in the NASA/NOAA queue to ask some Arctic related questions, but never received the call. I’ll let you know when I receive the promised answers by email.
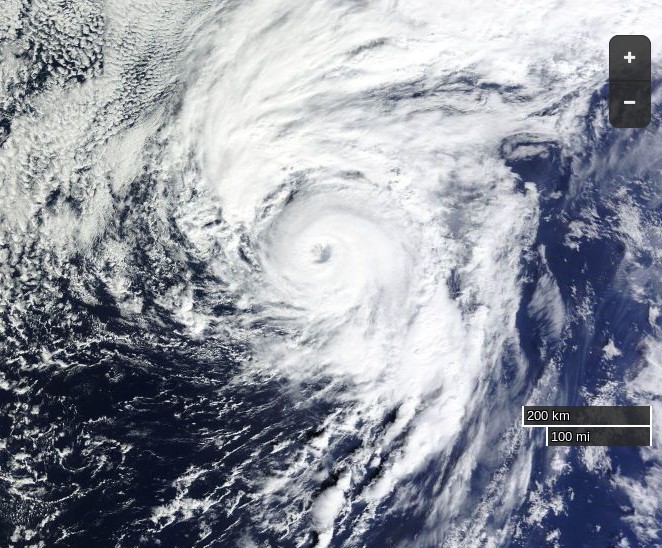
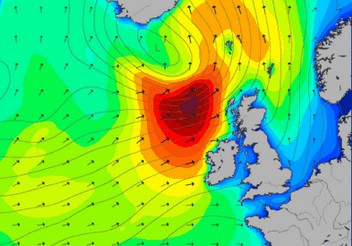
Strange things are happening in the North Atlantic at the moment. It’s the middle of January, and currently Hurricane Alex is heading straight for Greenland:
By the time he gets there Alex is due to meet another strong storm already spinning north of Newfoundland:
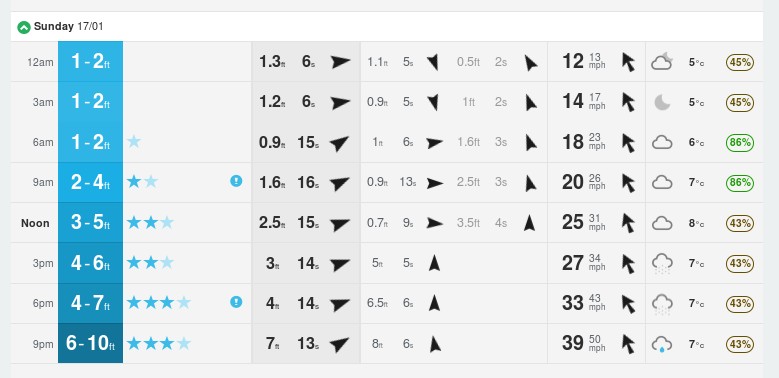
That combination is forecast by Magic Seaweed to bring some interesting surfing conditions to my local beach break here in Soggy South West England this coming weekend:
On January 1st 2016 the 15% concentration threshold daily Arctic sea ice extent metric reported by the United States National Snow and Ice Data Centre reached the lowest ever level for the first day of any year since their satellite derived records began in 1979. A couple of days later the more familiar 5 day trailing averaged extent also reached the lowest ever level for the date:
Cryosphere Today have been somewhat sluggish about updating their records of Arctic sea ice area, but have at long last revealed that their metric is now also at the lowest ever level for the date:
Meanwhile Great White Con commenter “Just A Thought” states that:
I find it hard, with what I do have access to, to see why everyone is so worried that the Arctic is melting.
He or she has evidently only had access to the propaganda perpetrated by Tony Heller (AKA “Steve Goddard”) on his so called “Real Climate Science” blog. Mr. Heller’s latest Arctic pronouncement on December 31st 2015 is entitled “Arctic Meltdown Update” and claims that:
Experts say that a terrifying storm melted the North Pole yesterday. This unprecedented melting event has caused Arctic ice to reach its highest December extent in over a decade.
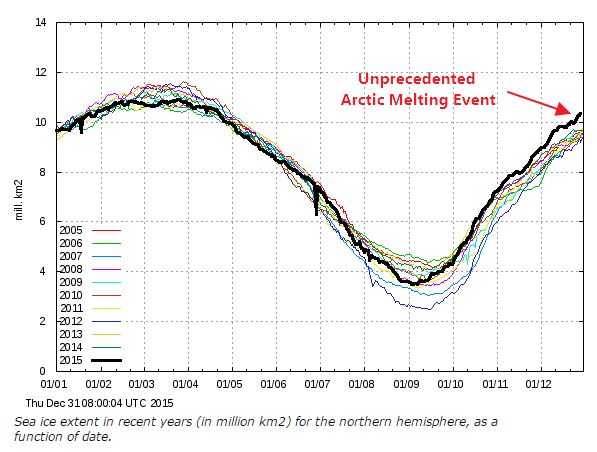
justifying that comment with the following graph of his beloved (albeit deprecated) 30% concentration threshold DMI extent metric:
Here’s a video revealing the effect of the recent “terrifying storm” on the sea ice on the North Atlantic side of the Arctic:
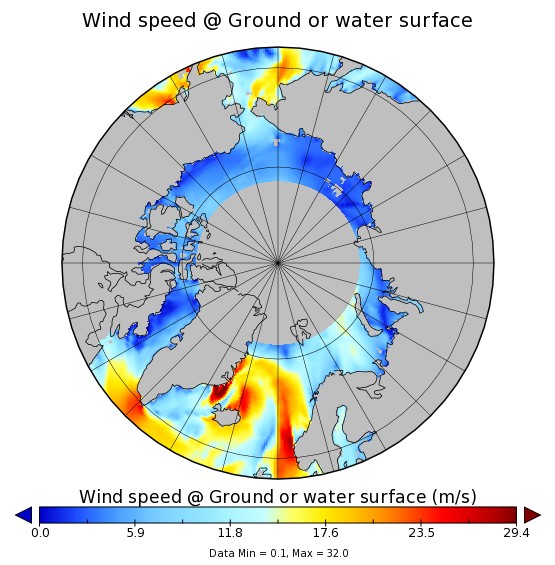
As you can see the ice at the North Pole didn’t melt away. However the ice edge did retreat in the immediate aftermath of what is referred to here in the United Kingdom as “Storm Frank“. Frank led to lots of flooding in the North of the nation, and also to some strong winds inside the Arctic Circle:
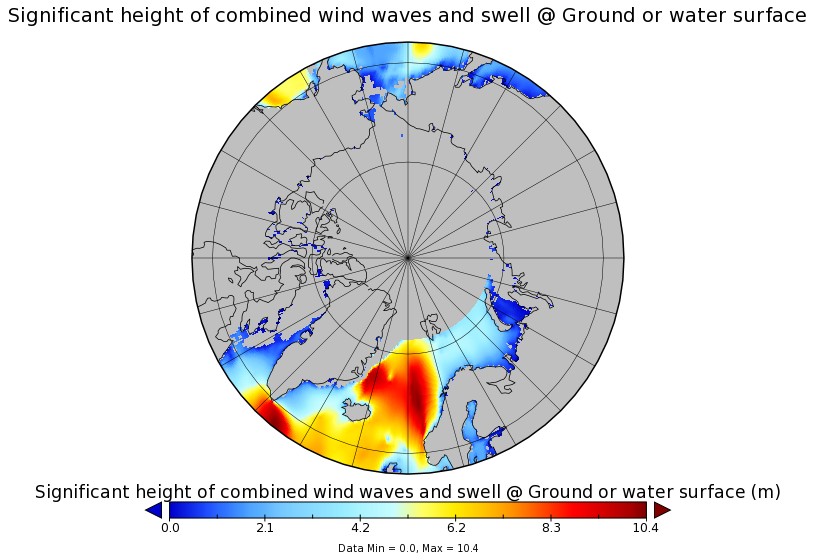
Those winds, travelling over a long stretch of open ocean, produced some pretty significant waves, speeding in the direction of the sea ice edge:
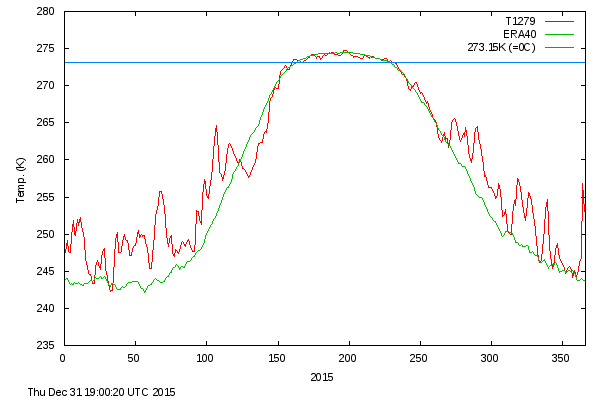
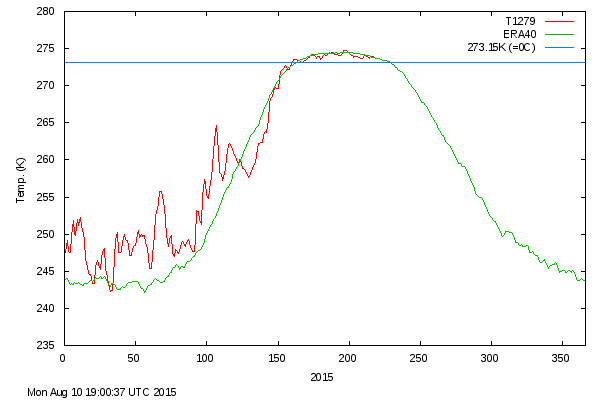
Meanwhile temperatures near the North Pole did briefly rise above the freezing point of sea ice in the middle of the Arctic winter. Here’s the Danish Meteorological Institute’s view of the air temperatures in the central Arctic:
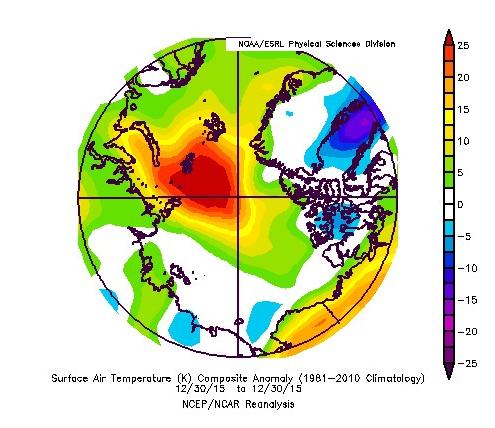
and here is NOAA’s temperature anomaly reanalysis for December 30th 2015:
Personally I reckon the 25 m/s winds and resulting 10 meter waves had more effect on the sea ice metrics than the 25 °C above normal air temperatures, but your mileage may of course vary, especially if your pseudonym is “Steve Goddard”!
The Zachariæ Isstrøm glacier in North East Greenland is in the news at the moment. Here’s a recent article from The Guardian for example, which states that:
A major glacier in Greenland that holds enough water to raise global sea levels by half a metre has begun to crumble into the North Atlantic Ocean, scientists say. The calving of the glacier into chunks of floating ice will set in train a rise in sea levels that will continue for decades to come, the US team warns.
“Even if we have some really cool years ahead, we think the glacier is now unstable,” said Jeremie Mouginot at the University of California, Irvine. “Now this has started, it will continue until it retreats to a ridge about 30km back which could stabilise it and perhaps slow that retreat down.”
Mouginot and his colleagues drew on 40 years of satellite data and aerial surveys to show that the enormous Zachariae Isstrom glacier began to recede three times faster from 2012, with its retreat speeding up by 125 metres per year every year until the most recent measurements in 2015.
The same records revealed that from 2002 to 2014 the area of the glacier’s floating shelf shrank by a massive 95%, according to a report in the journal Science. The glacier has now become detached from a stabilising sill and is losing ice at a rate of 4.5bn tonnes a year.
Eric Rignot, professor of Earth system science at the University of California, Irvine, said that the glacier was “being hit from above and below”, with rising air temperatures driving melting at the top of the glacier, and its underside being eroded away by ocean currents that are warmer now than in the past.
“The glacier is now breaking into bits and pieces and retreating into deeper ground,” he said. The rapid retreat is expected to continue for 20 to 30 more years, until the glacier reaches another natural ledge that slows it down.
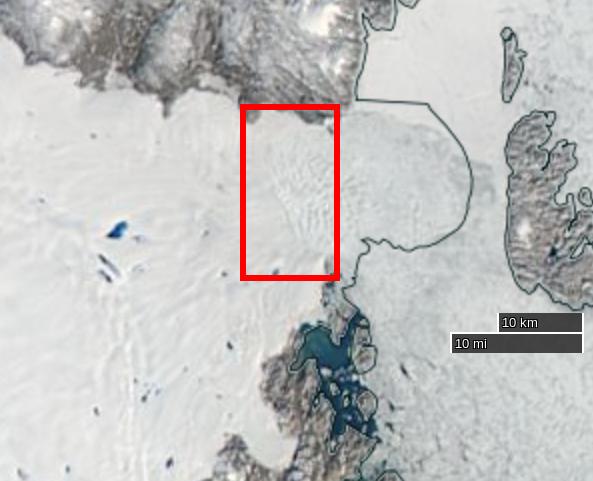
The Guardian article includes a picture of Zachariæ Isstrøm, along with much of the rest of North East Greenland. Here it is again, together with a helpful annotation revealing the location of the calving face of Zachariæ Isstrøm in amongst all the snow and ice:
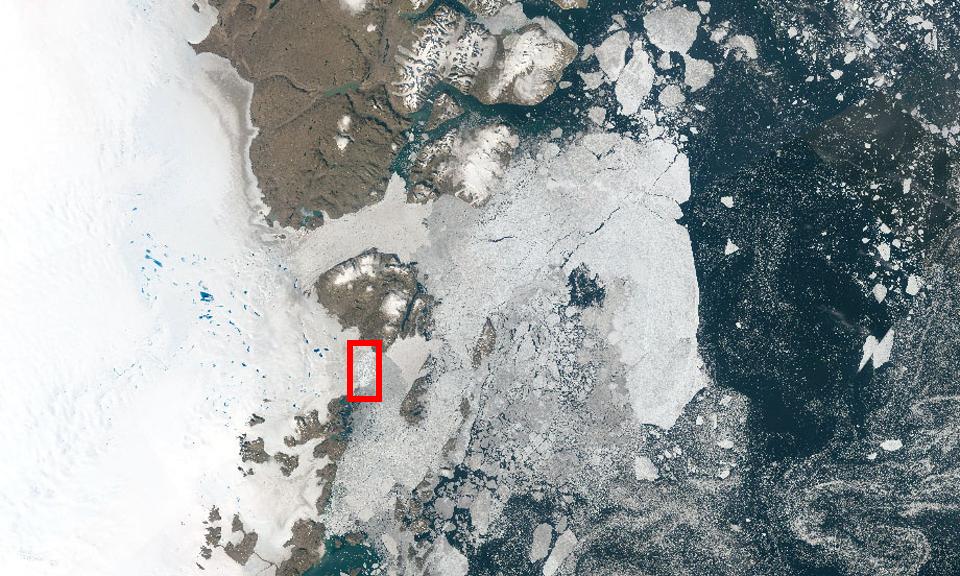
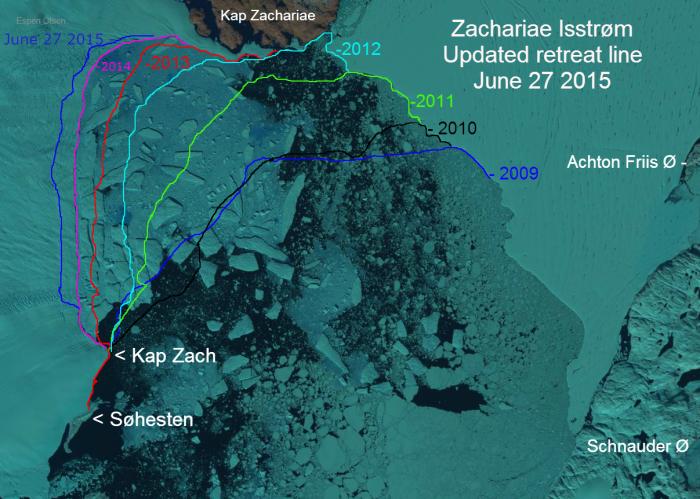
That’s still not really much help when it comes to visualising the “retreat speeding up by 125 metres per year”, so here’s a closer look at Zachariae Isstrom using an image prepared by Espen Olsen for the Arctic Sea Ice Forum, which is based on a Landsat 8 satellite image from September 2014:
Retreat of the calving face of the Zachariae Isstrøm glacier between 2009 and 2015
North East Greenland is in the dark at the moment, but if you want to take a closer look at recent changes to Zachariæ Isstrøm for yourself you can do so with the aid of NASA’s EOSDIS Worldview web site, which allows you to scroll through images from both the Aqua and Terra satellites. Here’s one from August 26th 2015:
NASA Worldview “true-color” image of the Zachariae Isstrøm glacier on August 26th 2015, derived from the MODIS sensor on the Aqua satellite
Our headline for today announces that yet another large chunk of ice has just detached itself from Zachariæ Isstrøm. You may wonder how we can be so sure of that when it’s dark in North East Greenland? That’s because yet another satellite can “see” in the dark, using synthetic aperture radar. Here’s an animation prepared earlier today by “Wipneus” using data from the European Space Agency’s Sentinel 1A satellite, once again for the Arctic Sea Ice Forum:
Animated comparison of Sentinel 1A visualisations of the Zachariae Isstrøm calving face on 4th and 16th November 2015
Can you spot “The new iceberg [that] seems to lie on its side”?
The conclusion to all this frantic activity, according to Mouginot, Rignot et al. at least, is that:
The Zachariæ Isstrøm / Nioghalvfjerdsfjorden sector is one of three major marine-based basins in Greenland along with the Jakobshavn Isbræ and Petermann–Humboldt glaciers, each holding a 0.6-m sea-level equivalent. Jakobshavn Isbræ started a rapid retreat (18 km in 2001-2015) following the collapse of its ice shelf and has undergone massive calving events since 2010. The central channel of the Petermann ice shelf lost 250 m of ice in 2002-2010, and the ice front retreated 33 km in 2010-2012. The Nioghalvfjerdsfjorden ice shelf will become vulnerable to break up in the near future if thinning continues. These observations combined suggest that all three major marine-based basins are undergoing significant changes at present. Jakobshavn Isbræ and Zachariæ Isstrøm have already transitioned to tidewater glacier regime, with increased calf-ice production and ice melting by the ocean. The retreat of these marine-based sectors is likely to increase sea-level rise from Greenland for decades to come.
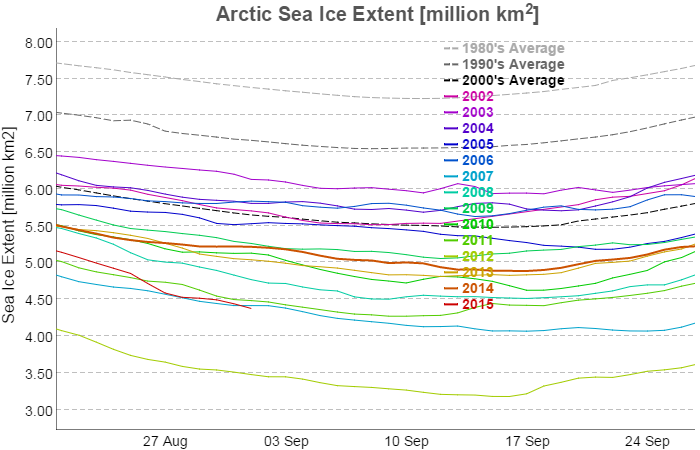
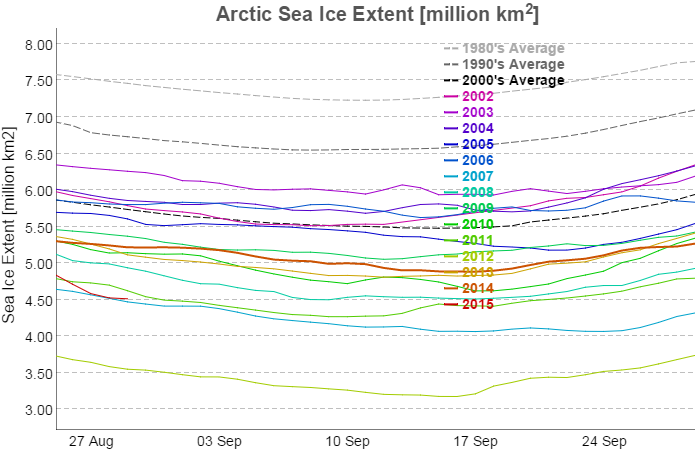
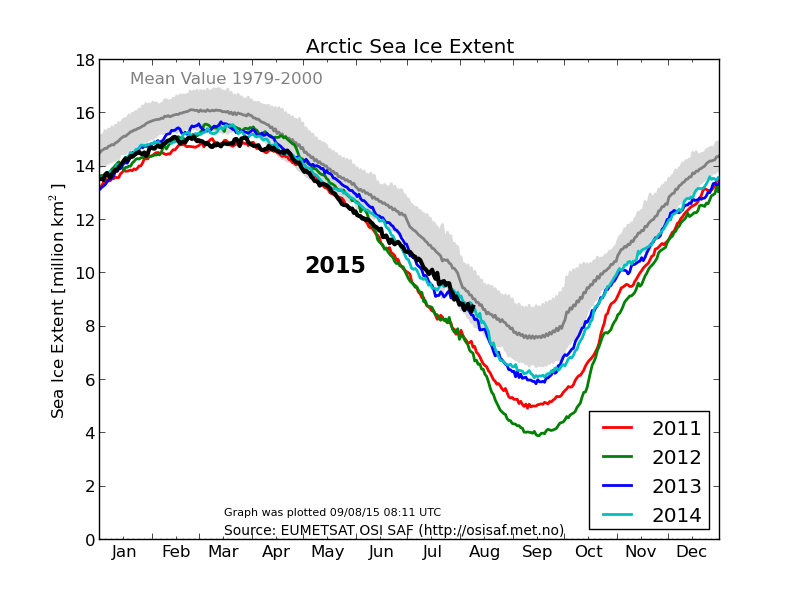
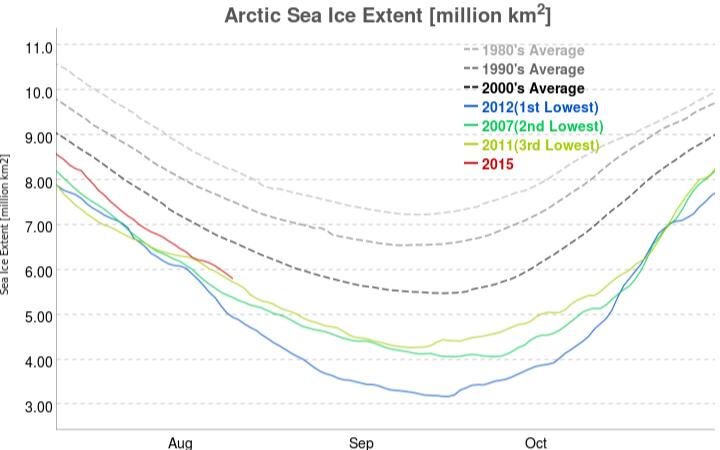
We’ve now entered the month of September, the month in which Arctic sea ice extent and area reach their annual minimum levels, historically at least. To set the scene, here’s the extent graph from the Japan Aerospace Exploration Agency (JAXA) for September 1st, based on data from the AMSR2 sensor on board their SHIZUKU satellite.:
As you can see, the 2015 curve has just dropped below 2007 and is now at the second lowest level for the date in JAXA’s records. As the month progresses we’ll be taking a look at a variety of other metrics as they start to report their numbers for September.
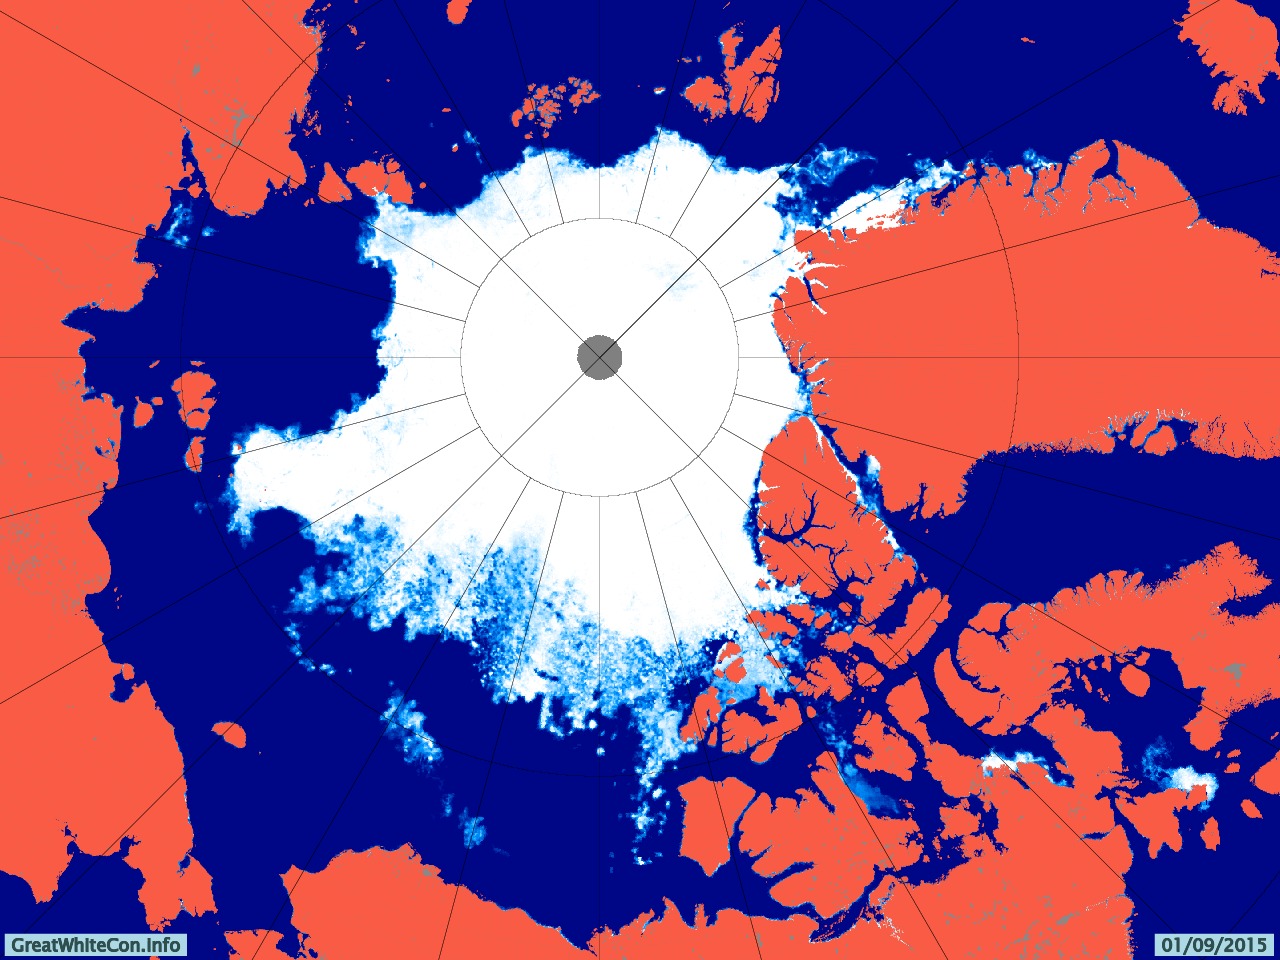
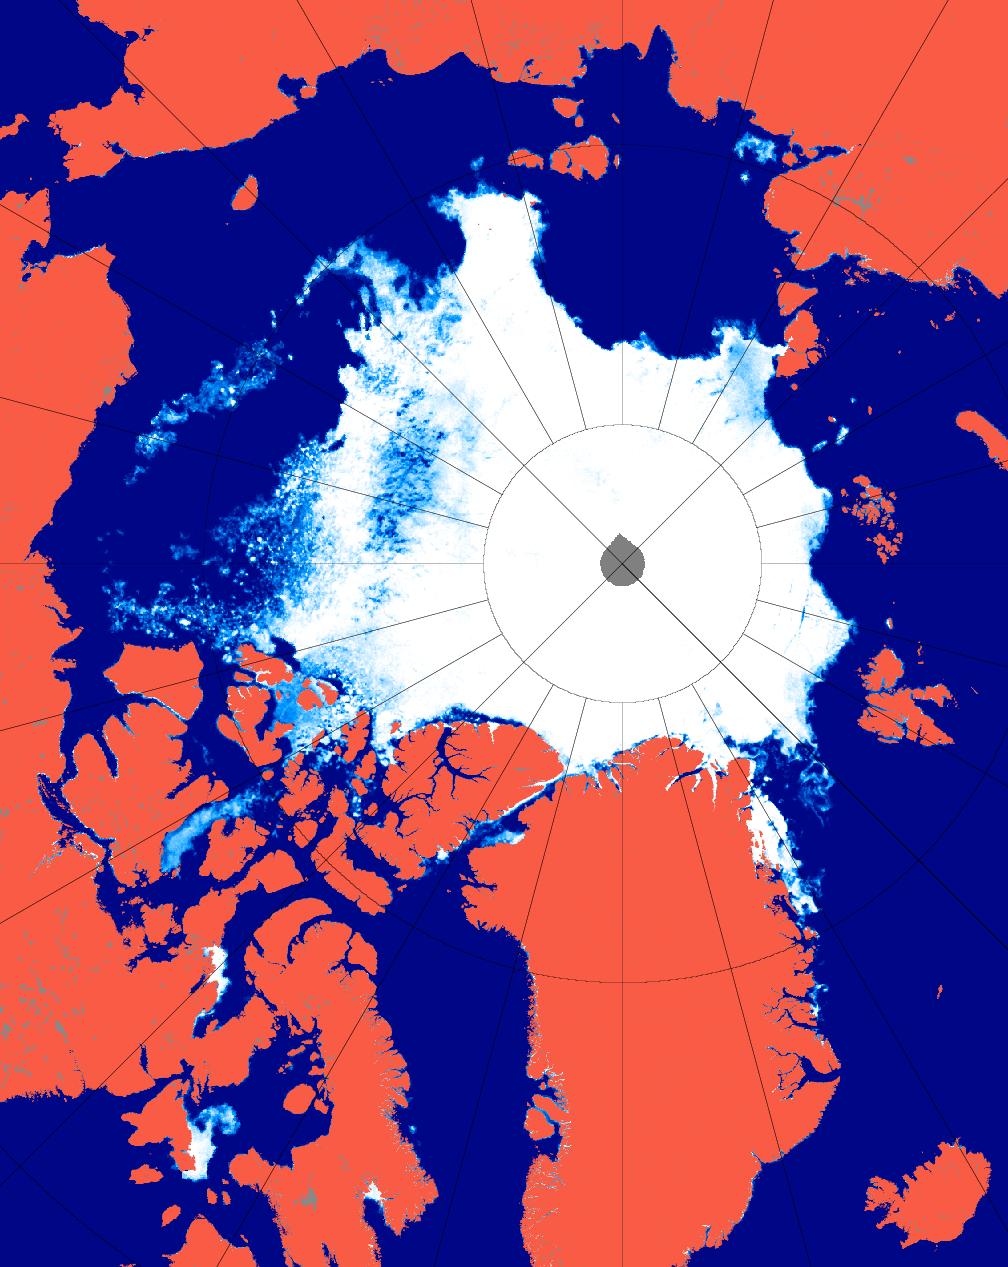
To set the scene, here’s the University of Hamburg’s map of Arctic sea ice concentration for September 1st, again based on AMSR2 data:
Here’s a video showing how that map has changed over the last two months:
Notice in particular the effect of the recent Arctic cyclone on the sea ice in the lower left quadrant. Note also our comment that:
[There is] a large potential fetch across the East Siberian, Chukchi and Beaufort Seas should any further cyclones occur in the area over the next few weeks. The conditions now exist for an even more damaging swell to be generated before the 2015 minimum Arctic sea ice extent is reached.
By now you may be wondering if we have a prediction to make? Well, we predict it still all depends on the weather! However here’s how the “probabilistic” 50 day ahead prediction from Andrew Slater of the NSIDC looks at the moment:
If I were a betting man I’d say that the red line will ultimately put in a lower low than the dark blue one.
Finally, for the moment at least, take a look at the GFS surface level pressure forecast for later today, courtesy of MeteoCiel:
Can you see the 1000 hPa central pressure low spinning over the Laptev Sea? It’s currently not very deep, and it’s not over the East Siberian Sea either, but watch that space along with us as we wait to discover where and when the assorted Arctic sea ice metrics reach their minima for 2015.
[Edit – September 3rd 2015]
The latest edition of the US National Snow and Ice Data Center’s Arctic Sea Ice News has just been published. In the section on the imminent minimum they show this graph:
and say that:
Starting with the ice extent observed on August 31 and then applying 2006 loss rates, the slowest rate in recent years, results in the highest extrapolated minimum for 2015 of 4.50 million square kilometers (1.74 million square miles), and a September monthly average extent of 4.59 million square kilometers (1.77 million square miles). The lowest daily minimum comes from using the 2010 pace, yielding an estimated 4.12 million square kilometers (1.67 million square miles) for the daily minimum, and a September monthly average extent of 4.33 million square kilometers (1.67 million square miles).
Using an average rate of ice loss from the most recent ten years gives a one-day minimum extent of 4.38 ± 0.11 million square kilometers (1.79 million square miles), and a September monthly average of 4.49 ± 0.09. As of August 31, the 5-day running daily average extent is 4.72 million square kilometers. If no further retreat occurred, 2015 would already be the sixth lowest daily ice extent in the satellite record.
The forecast places the upcoming daily sea ice minimum between third and fourth lowest, with fourth more likely. There is still a possibility that 2015 extent will be lower than 4.3 million square kilometers, the third lowest sea ice extent, surpassing the 2011 sea ice extent minimum, and a small chance of surpassing 2007, resulting in the second-lowest daily minimum. This assumes that we continue to have sea ice loss rates at least as fast as those of 2010. This was indeed the case for the final ten days of August 2015.
Somewhere between 2nd and 6th then! We felt compelled to enquire on Twitter:
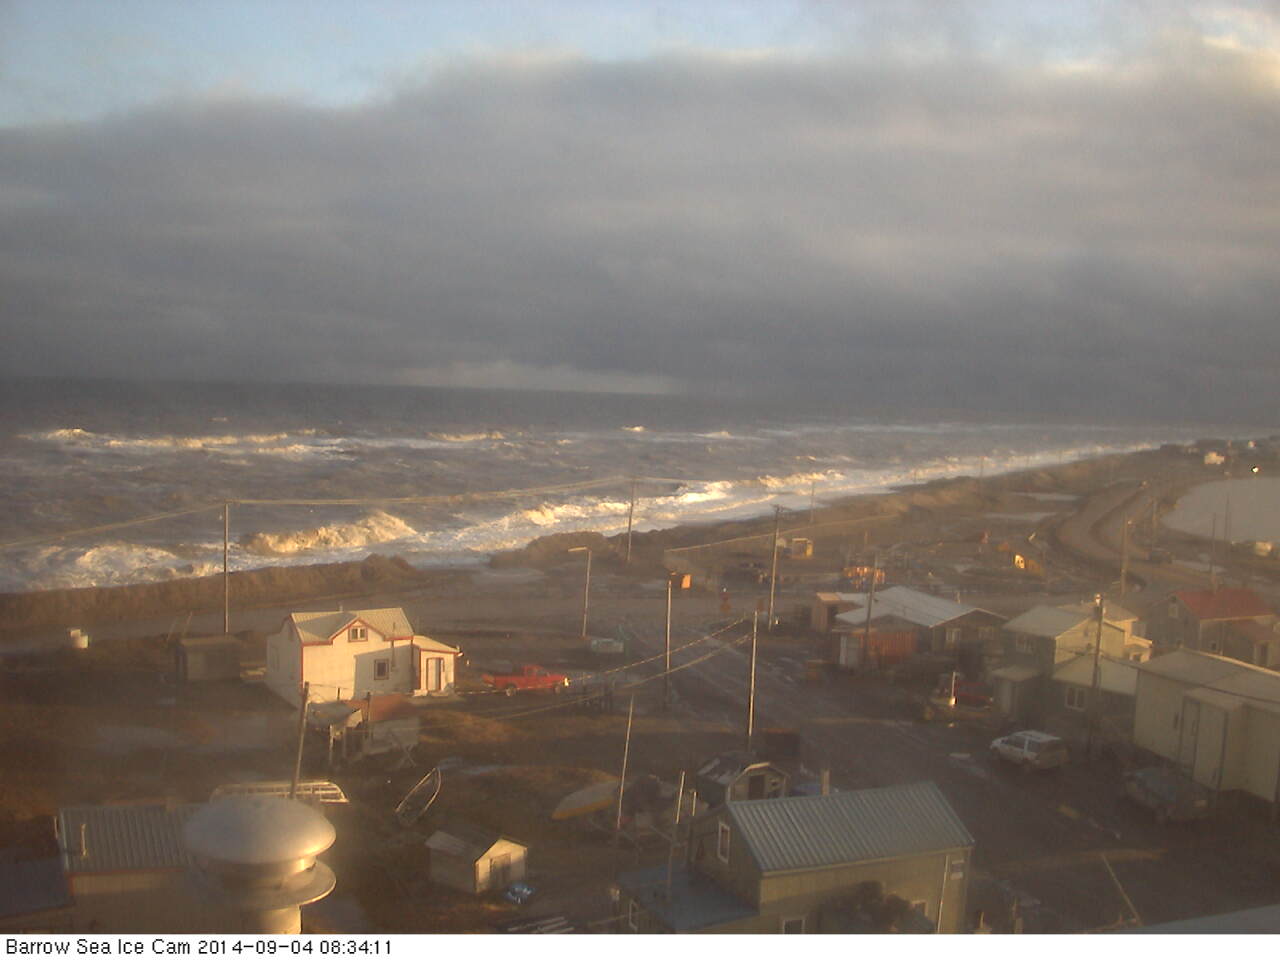
The first big waves of 2015 have been battering the town of Barrow, Alaska today and they’ve already broken through the coastal defences. Firstly take a look at the view from the Barrow webcam during a less damaging storm on September 4th last year:
Now take a look at the view from the same camera earlier today, and play “spot the difference” with me:
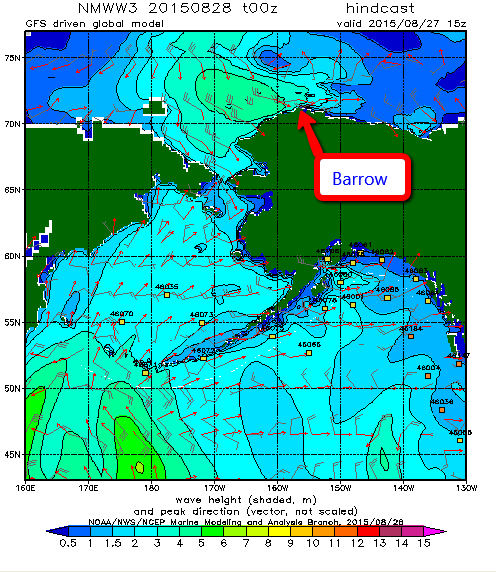
The cause of the flooding that is all too visible is a cyclone that’s been whirling around in the Chukchi Sea for a while, and here is a WaveWatch III “hindcast” of what the resultant winds have created in the way of waves. Firstly the “significant wave height”:
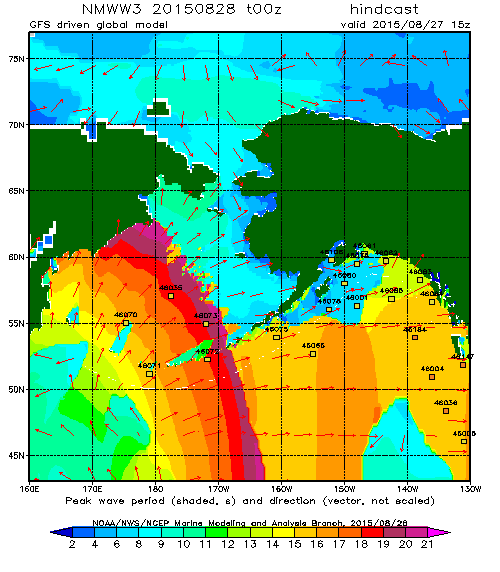
and now the “peak period”:
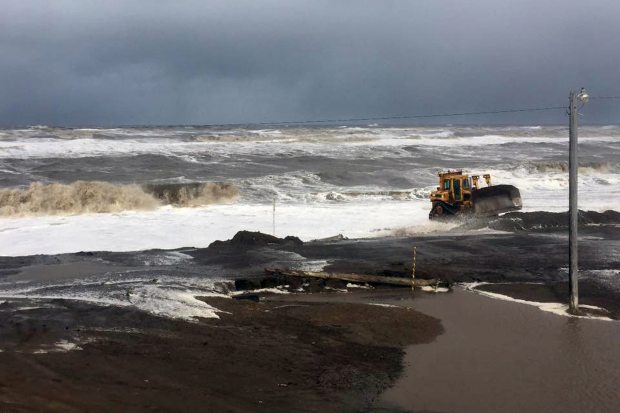
which reveal a swell 4 to 5 metres high with a period of 10 seconds heading directly towards Barrow Beach. According to the Alaska Dispatch News:
Huge, wind-whipped waves crashed onto the shore at Barrow on Thursday, forcing the closure of a nearby road. Westerly winds were gusting up to 50 miles an hour, pushing waves up to the top of the beach and causing some erosion, the National Weather Service said.
The service has issued a coastal flood warning for Barrow until Friday morning, along with a high surf advisory for the western part of the North Slope and a gale warning for much of the Beaufort and Chukchi Seas.
The big surf and flooding, which has covered a road that runs between the ocean and Barrow’s lagoon, is “not terribly unusual” at this time of the year, said Ryan Metzger, a National Weather Service meteorologist in Fairbanks. Fall is a stormy season, and the timing — right around the annual minimum sea ice extent — allows the surf to build and reach shore.
Photograph by Brittni Driver via Alaska Dispatch News
Just in case it’s not obvious from all the pictures, the respective advisory messages point out that:
A COASTAL FLOOD WARNING MEANS THAT RISING SEA WATER THAT CAUSES FLOODING IS EXPECTED. COASTAL RESIDENTS IN THE WARNED AREA SHOULD BE ALERT FOR RISING WATER…AND TAKE ACTIONS TO PROTECT LIFE AND PROPERTY.
A HIGH SURF ADVISORY MEANS THAT LOCALIZED BEACH EROSION IS EXPECTED. PRECAUTIONS SHOULD BE TAKEN TO PROTECT PROPERTY.
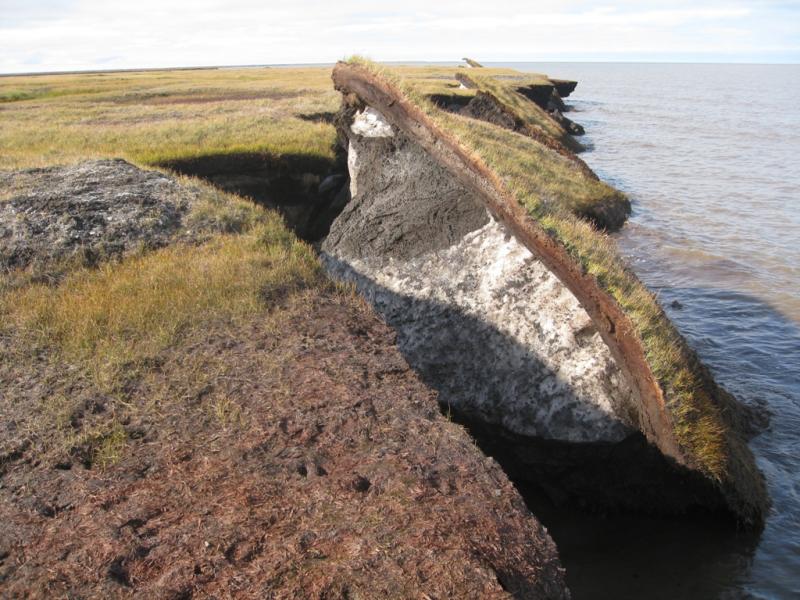
If you’re now wondering what might happen to other areas of the north coast of Alaska in similar circumstances, but with no bulldozer in attendance, here’s an example from Cape Halkett:
Thawing permafrost causes coastline collapse on Alaska’s North Slope, which is no longer kept frozen and protected from fall storms by sea ice—the ice now forms later in the season.
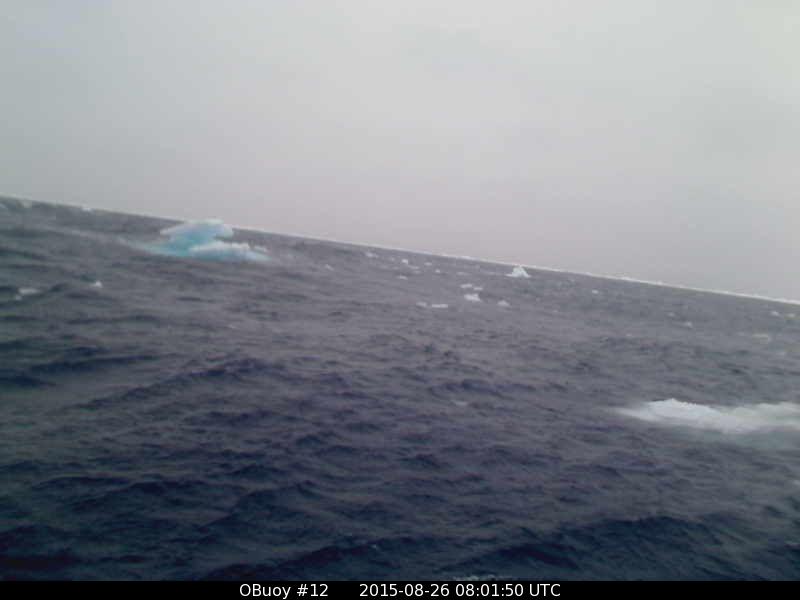
Away from the coast swell from the same cyclone has also been affecting the sea ice north of Barrow, and here’s what a webcam bobbing about on a buoy north of the Chukchi Sea showed as the winds started to build yesterday:
O-Buoy 12 image from August 26th 2015
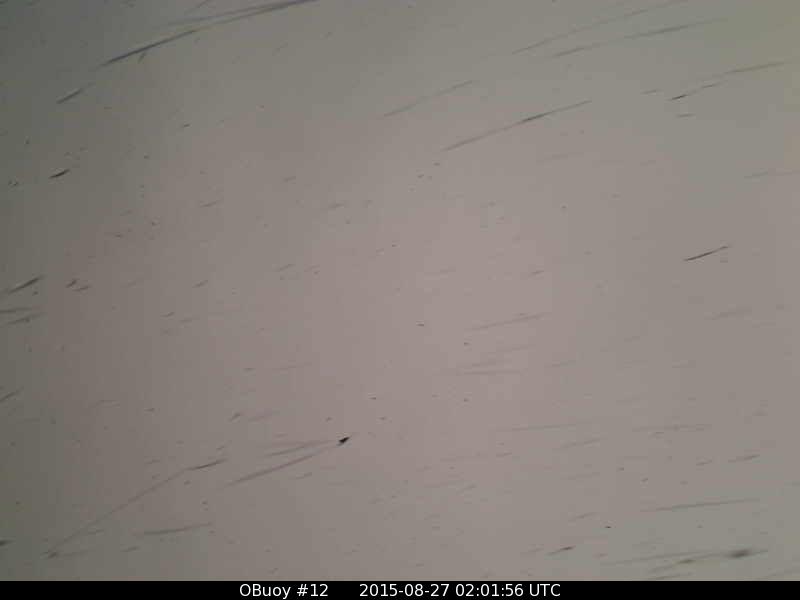
O-Buoy 12 has now tipped over and then ceased transmitting. This is the last picture received, in the early hours of August 27th when the wind speed had reached 13 m/s and the buoy had been moving at over 5 m/s:
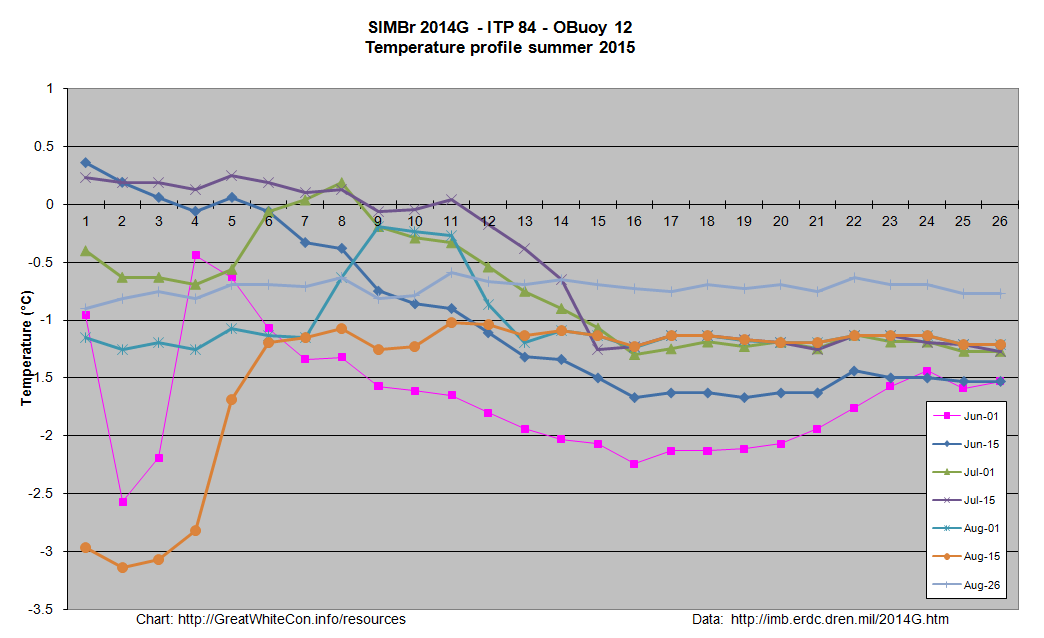
Once upon a time O-Buoy 12 was sat on the same ice floe as ice mass balance buoy 2014G, which has also been free floating for a while. Here’s what it reveals about the temperature of the sea water on August 26th 2015 at 77.56 N, 163.86 W:
Somewhere in the vicinity of -0.7 °C.
[Edit on 30/08/2015]
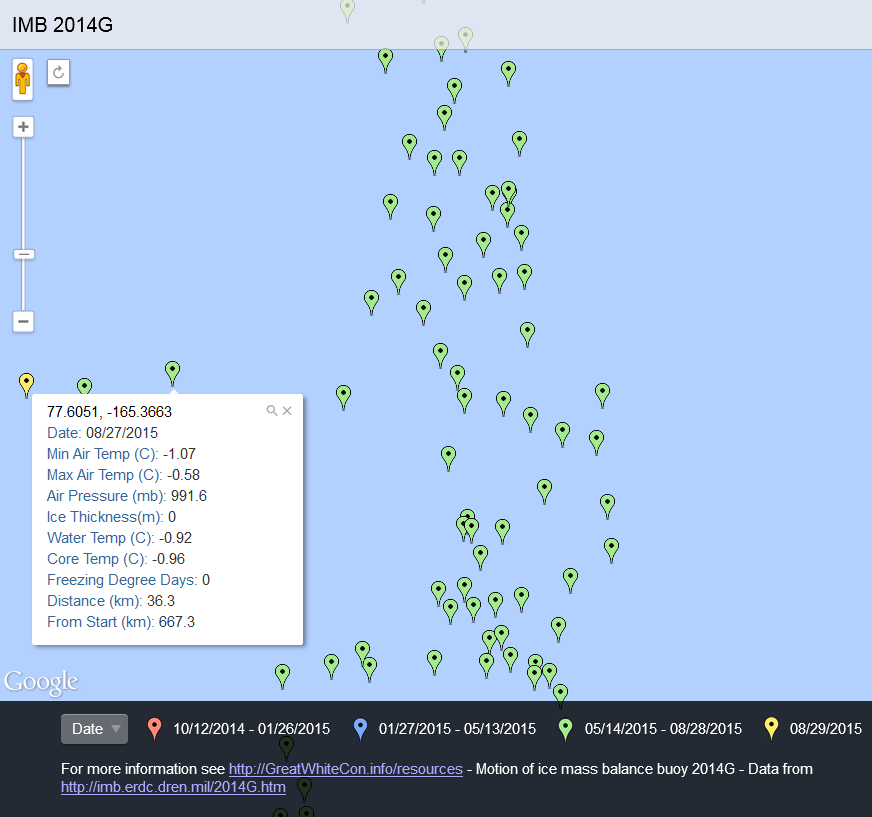
O-Buoy 12 has made no further transmissions, and therefore seems to have succumbed to the storm. In addition IMB buoys 2014F and 2013F stopped transmitting on the 26th and 27th of August respectively. Ice mass balance buoy 2014G has survived however, and reports two successive record daily distances travelled:
25.6 km on August 26th, followed by 36.3 km on the 27th. After a brief dip during the cyclone water temperature is still around -0.7 °C.
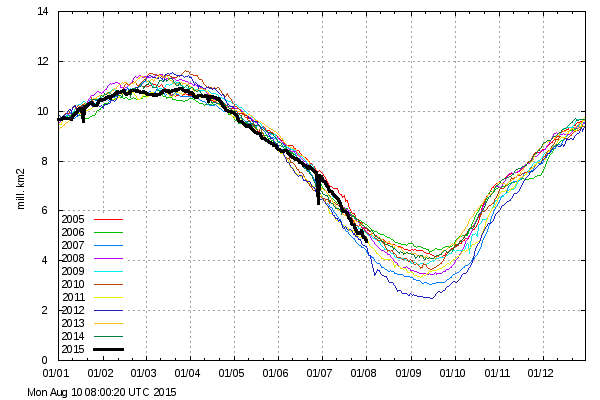
Presumably as a result of the cyclone JAXA Arctic sea ice extent has taken a tumble over the last few days. It has stabilised this morning slightly above 2007 levels:
Here is the current AMSR2 Arctic sea ice concentration map from the University of Hamburg, revealing a large potential fetch across the East Siberian, Chukchi and Beaufort Seas should any further cyclones occur in the area over the next few weeks:
AMSR2 Arctic sea ice concentration on August 29th from the University of Hamburg
Hence the conditions now exist for an even more damaging swell to be generated before the 2015 minimum Arctic sea ice extent is reached.
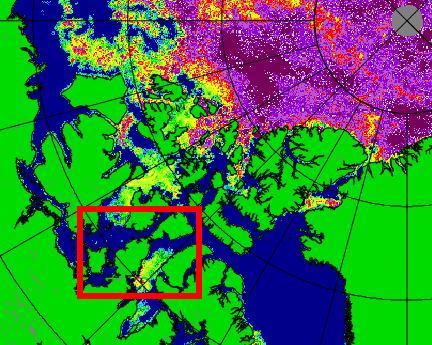
People keep on posing that question just at the moment. Here’s a typical example from the Arctic Sea Ice Blog this morning:
Albeit not ‘officially’ declared as such, the daily Uni-Bremen chart shows Amundsen’s route is cleared and free now.
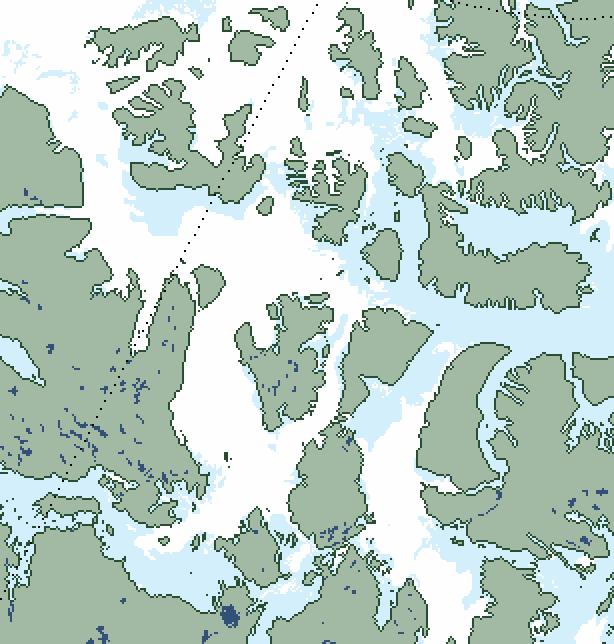
Here’s an extract from the “Daily Uni-Bremen chart” referred to, with an apparently “ice free” section of the southern route through the Northwest Passage highlighted:
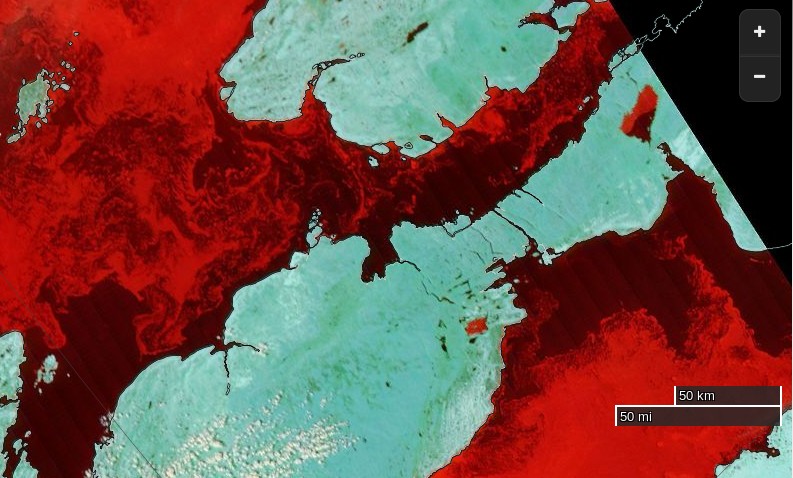
As we’ve been discussing here recently, the automated passive microwave based satellite Arctic sea ice concentration products can miss ice that’s visible to the naked human eye. Here’s some pictures from the Great White Con Northwest Passage page:
NASA Worldview “false-color” image of the Northwest Passage on August 13th 2015, derived from bands 7, 2 and 1 of the MODIS sensor on the Terra satellite
The Canadian Ice Service sea ice concentration chart for the Queen Maud Gulf on August 13th 2015
Here’s an extract from the NSIDC’s Multisensor Analyzed Sea Ice Extent (MASIE) product (currently for August 12th 2015):
and here’s an extract from an answer I gave to a similar question on the Arctic Sea Ice Forum earlier this morning:
The Canadian Ice Service still have 4-6/10 ice within a whisker of the coast. Would you fancy your chances in amongst that and a bit of a breeze?
The CIS definition of “navigable” is “a criteria of less than 60% ice cover over all sections of the Northwest Passage”. See:
The answer to the question posed in the title to this article is therefore currently NO, the Northwest Passage is not open yet, both officially from the CIS and unofficially from any mariner with a sense of self preservation in charge of any vessel that isn’t “ice hardened”. In all the circumstances that answer might change quite quickly though!
[Edit 18/09/15]
The Canadian Ice Service have finally published a close up map of the Parry Channel that doesn’t say “No Analysis”. Here it is:
There’s still a (narrow!) green path into McClure Strait, so I reckon we can at long last confidently declare the main Northwest Passage to be OPEN!
The melt season has essentially stopped, with very cold air across the Beaufort Sea
[Image redacted – It shows Canada and one corner of the Beaufort Sea]
The usual criminals in the press (Guardian, New York Times, etc.) and government agencies will of course not mention this, because reality and science wrecks their agenda.
I have to admit Steve’s confusing language confused me briefly. The Arctic sea ice concentration and ice type maps from the OSISAF on which the Danish Meteorological Institute base their extent graphs have been updating normally, but I eventually discovered what “Steve”/Tony was on about. On close inspection although the date at the bottom has been updating the 2015 curve on DMI’s 30% threshold Arctic sea ice extent graph currently seems to be stuck on August 2nd:
I’ve informed DMI of the problem, but when it might be fixed remains to be seen, since as the DMI web site puts it:
The old plot can still be viewed here for a while.
and as I was just informed they don’t have any resources allocated to keep the “deprecated” 30% service running.
Meanwhile back in real world in the Arctic, DMI temperatures north of 80 degrees are above “normal”:
This website uses cookies to improve your experience. We'll assume you're ok with this, but you can opt-out if you wish. Cookie settingsACCEPT
Privacy & Cookies Policy
Privacy Overview
This website uses cookies to improve your experience while you navigate through the website. Out of these, the cookies that are categorized as necessary are stored on your browser as they are essential for the working of basic functionalities of the website. We also use third-party cookies that help us analyze and understand how you use this website. These cookies will be stored in your browser only with your consent. You also have the option to opt-out of these cookies. But opting out of some of these cookies may affect your browsing experience.
Necessary cookies are absolutely essential for the website to function properly. This category only includes cookies that ensures basic functionalities and security features of the website. These cookies do not store any personal information.
Any cookies that may not be particularly necessary for the website to function and is used specifically to collect user personal data via analytics, ads, other embedded contents are termed as non-necessary cookies. It is mandatory to procure user consent prior to running these cookies on your website.