It’s May Day 2021, and just for a change we’re going to start the month off with a pretty picture!
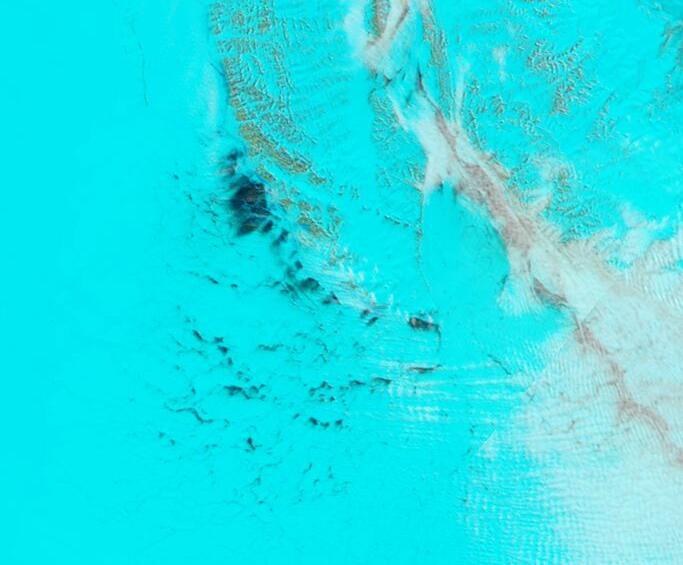
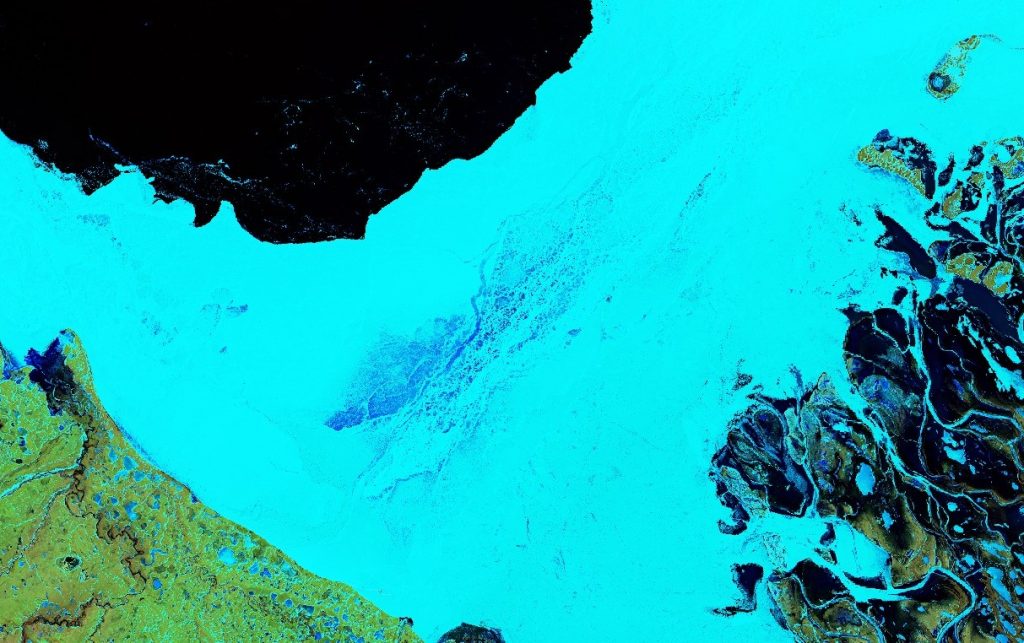
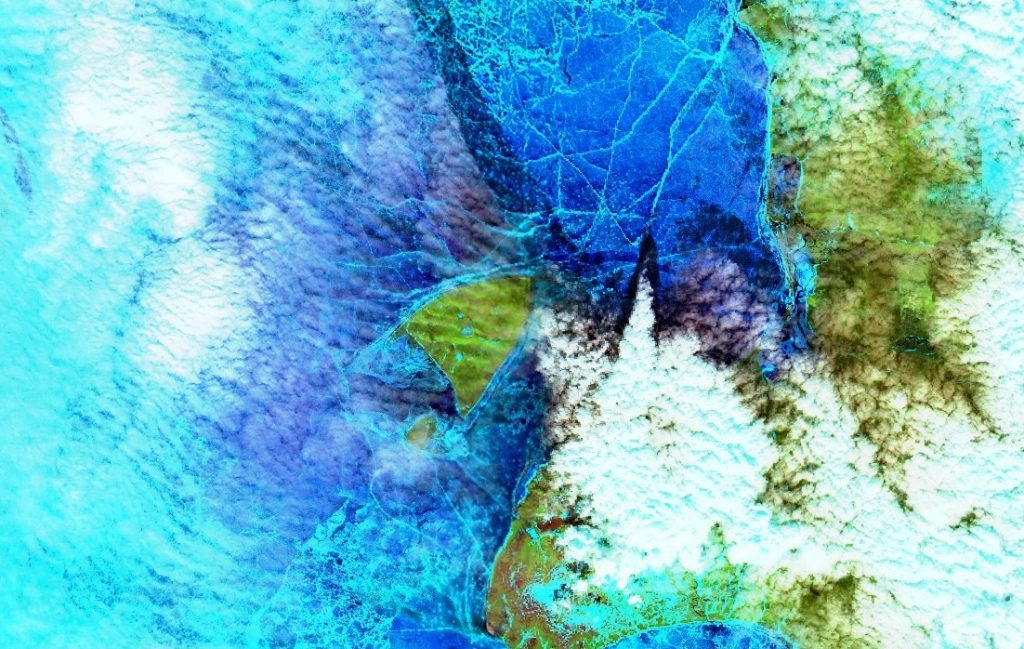
Parts of the Laptev Sea are starting to look distinctly “warm” in the infra-red. Here’s a “false colour” image taken by the Terra satellite during a gap in the clouds:
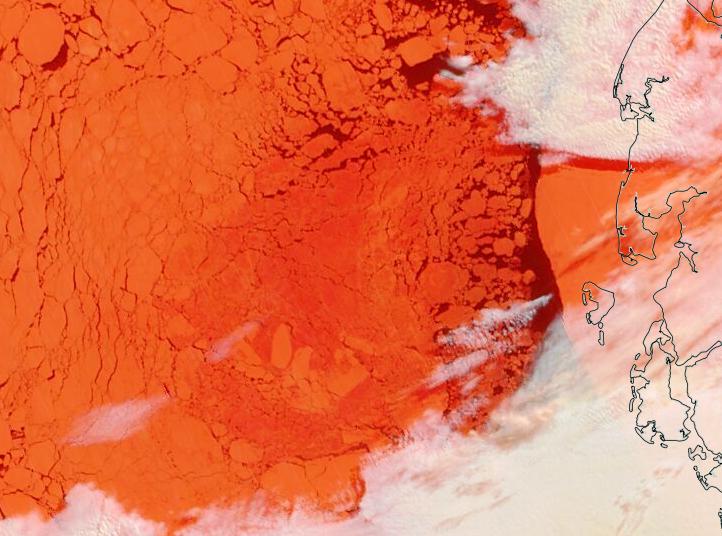
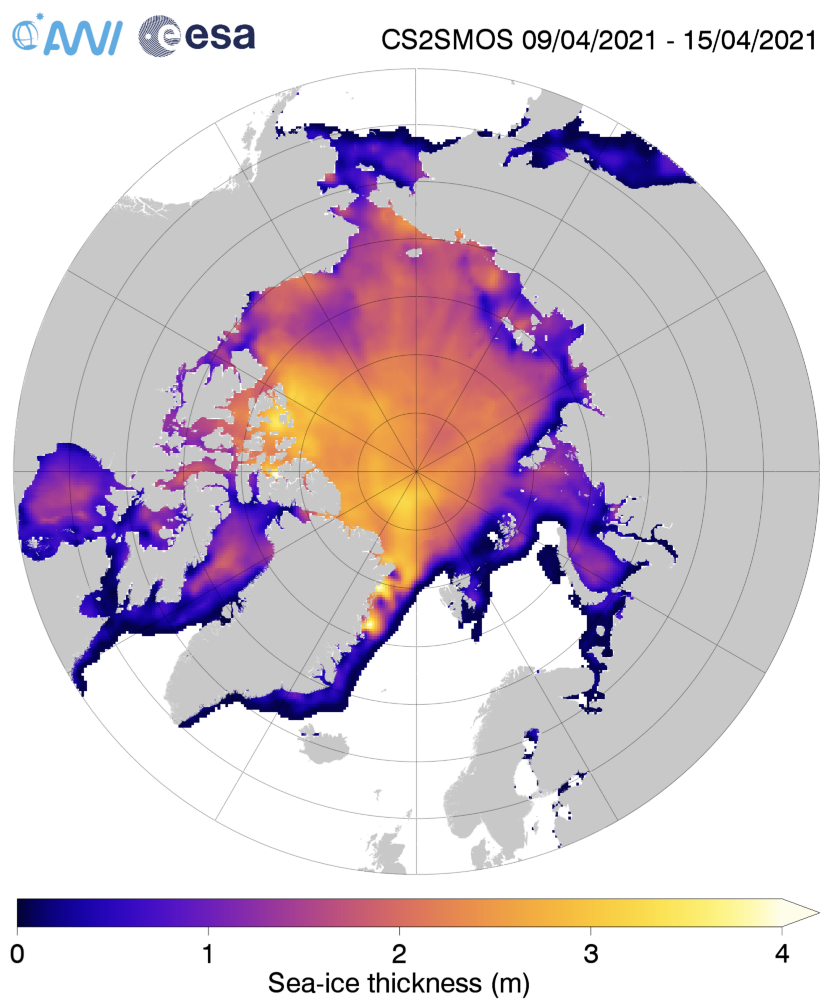
We have reached the time of year when the SMOS “thin ice thickness” readings start being affected by surface melt, but let’s take a look anyway:
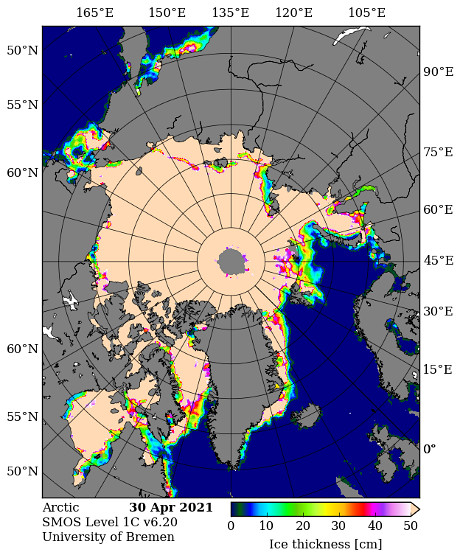
That area of the Laptev certainly appears to be either thin or melting.
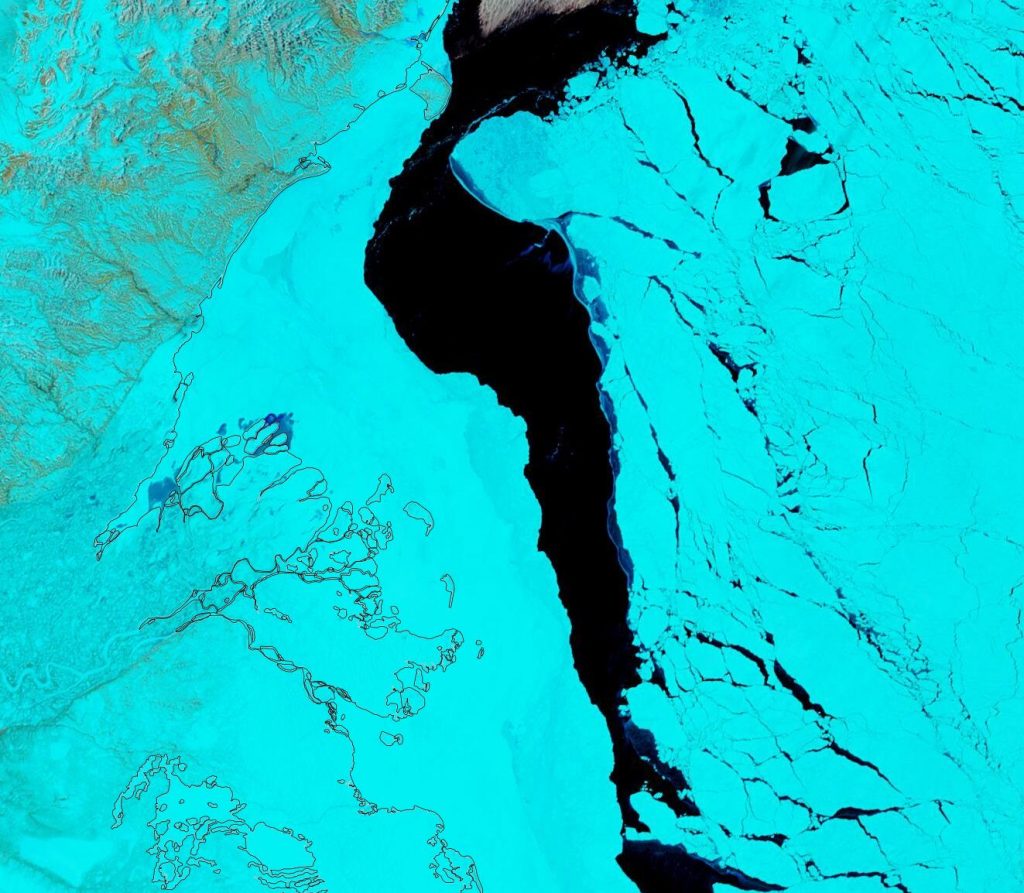
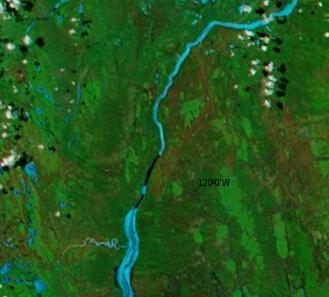
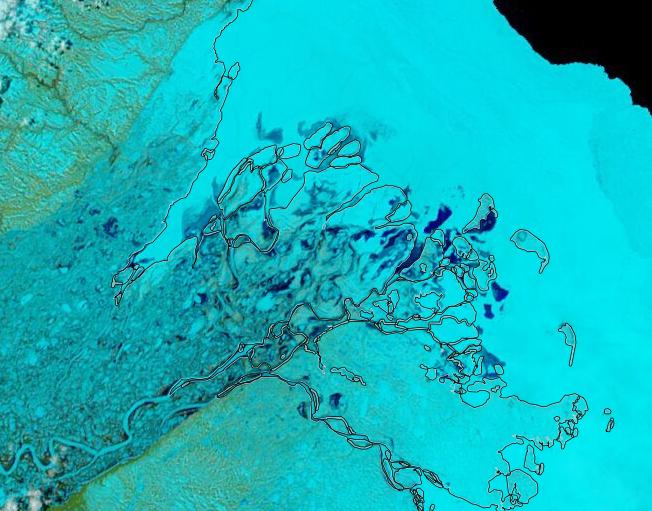
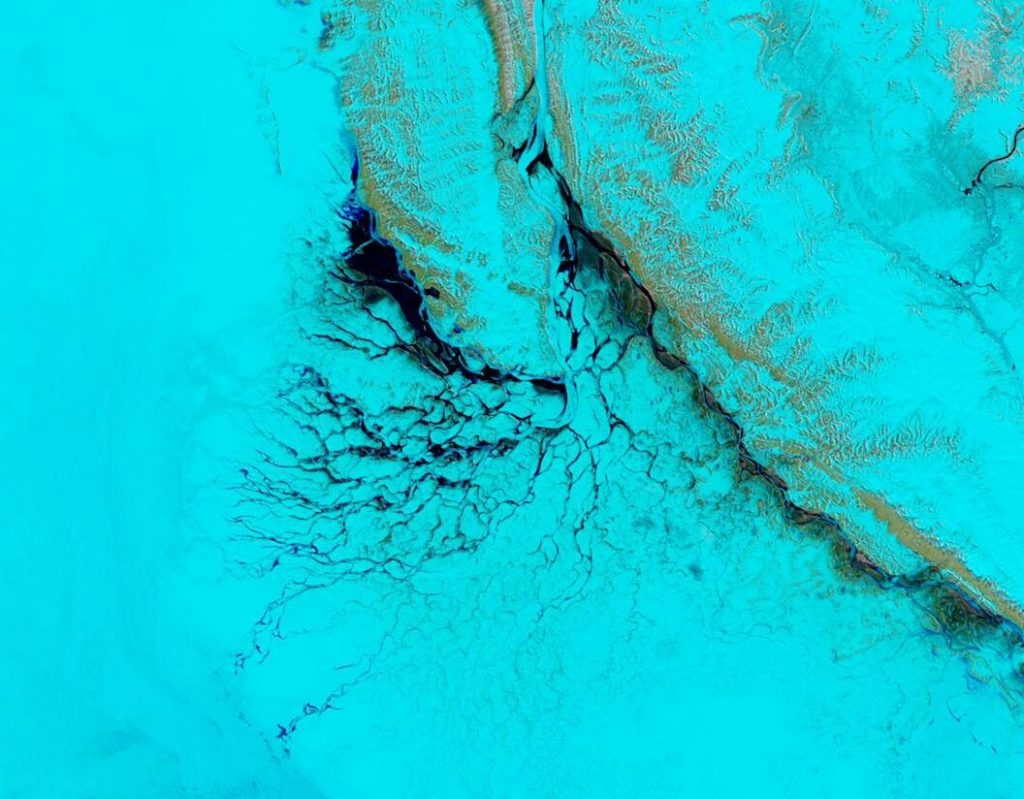
Meanwhile on the Canadian side of the Arctic the fast ice off the Mackenzie Delta is starting to get damp, even though the river itself still looks to be fairly well frozen:
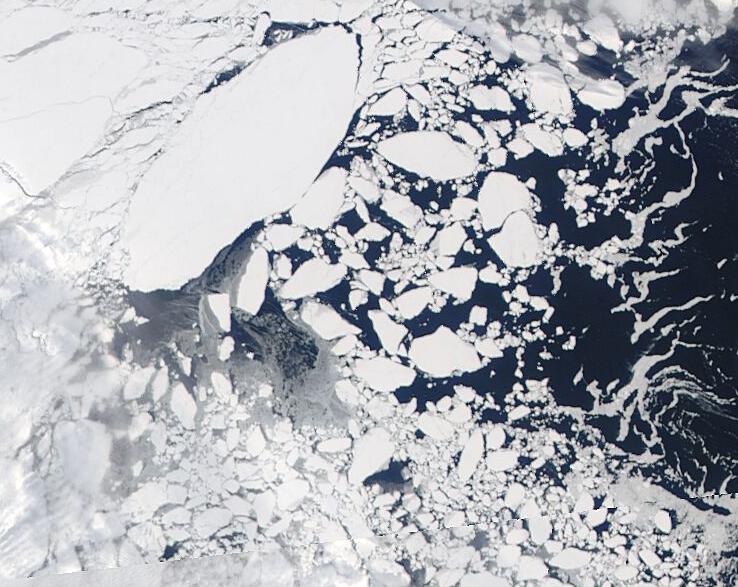
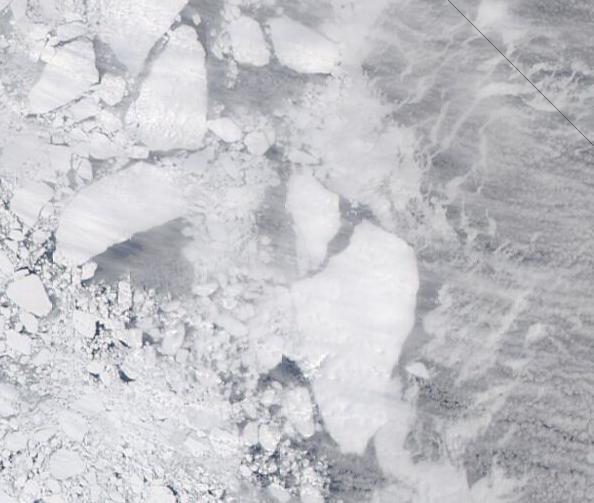
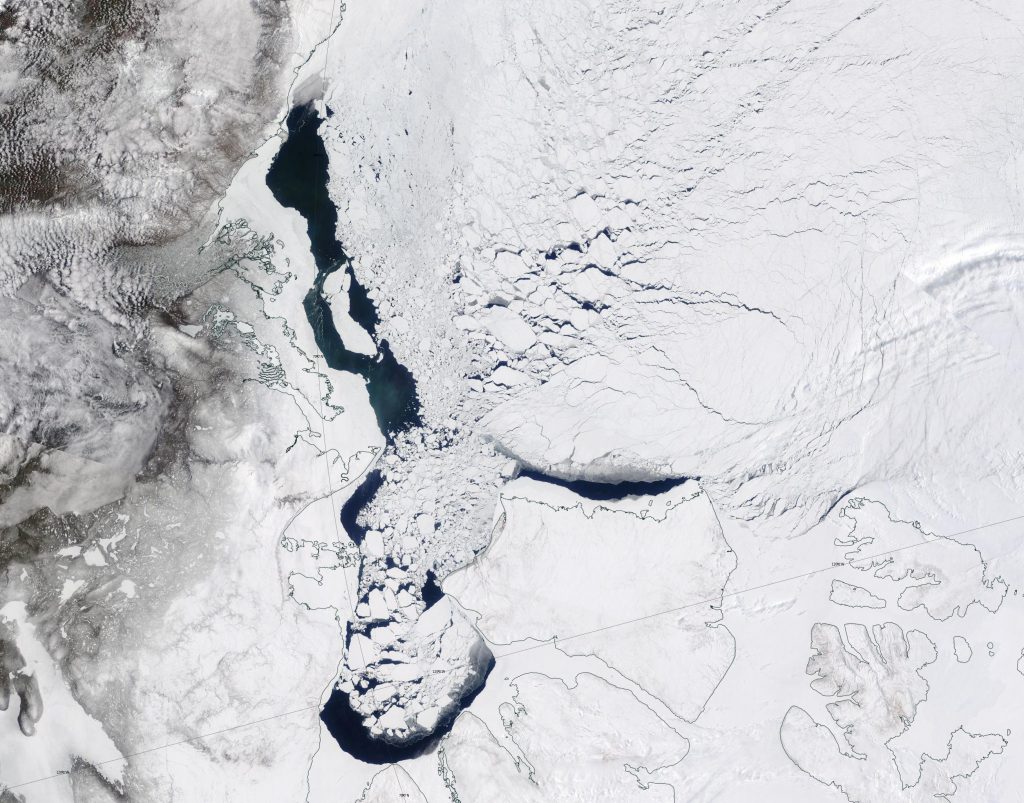
It will also be interesting to follow the progress of this large floe as it heads towards oblivion through the Fram Strait:
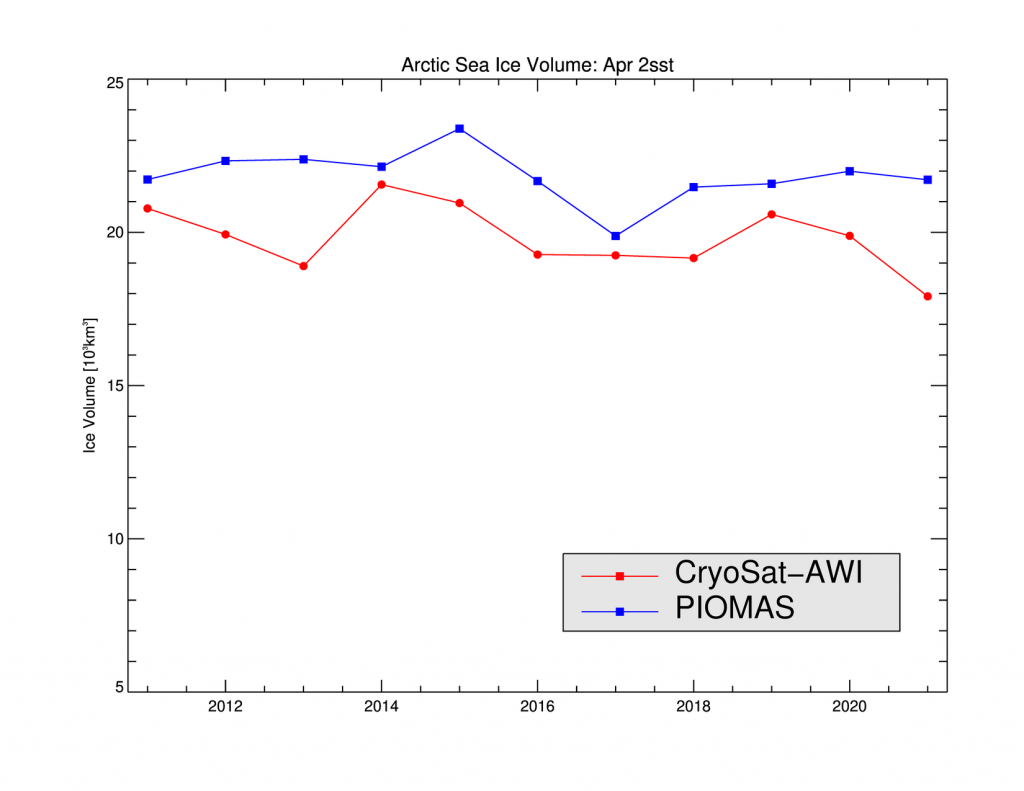
The final reprocessed CryoSat-2/SMOS Arctic sea ice thickness map of the 2020/21 season has just been published by AWI:
Here too is the resulting volume graph:
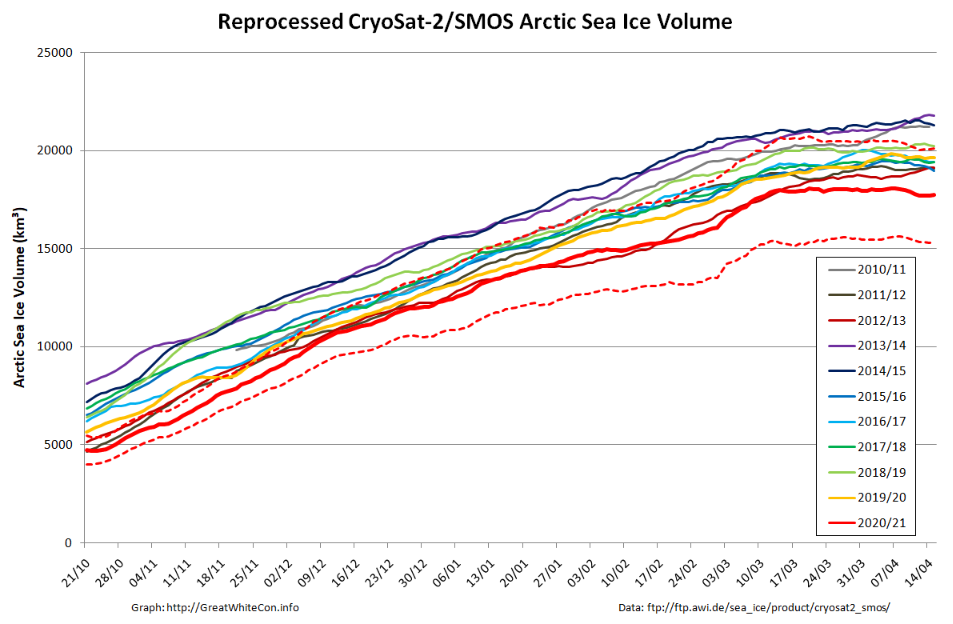
This reveals a maximum volume of 18060.5 km³ on April 7th. That is well below all other maxima in the CS2 record going back to 2010, including 2011/12 which went on to produce the lowest minimum extent in the satellite era.
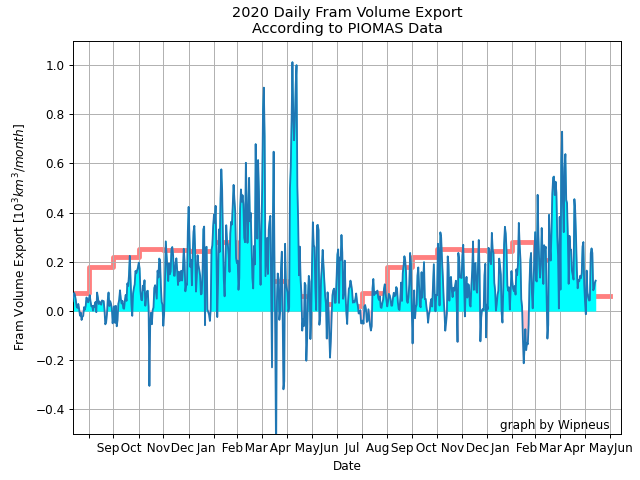
The PIOMAS gridded thickness data for April has been released, and Wipneus has worked his magic. Of particular interest this time around is Fram Strait volume export:
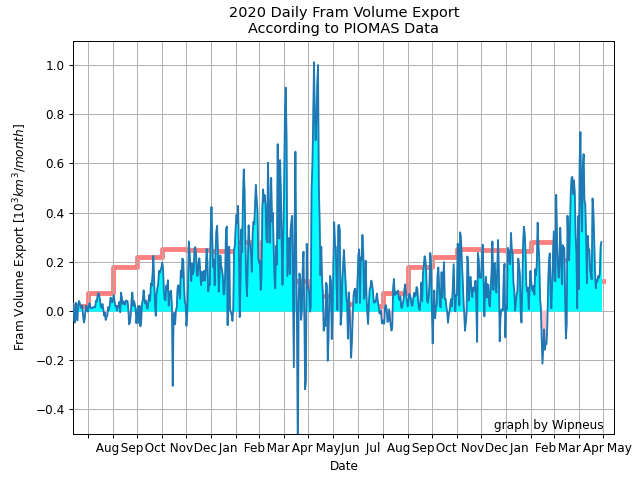
The peak is lower than last year, but export has been continuous throughout April, with not even a single negative day. Moving on here’s the thickness map for April 30th:
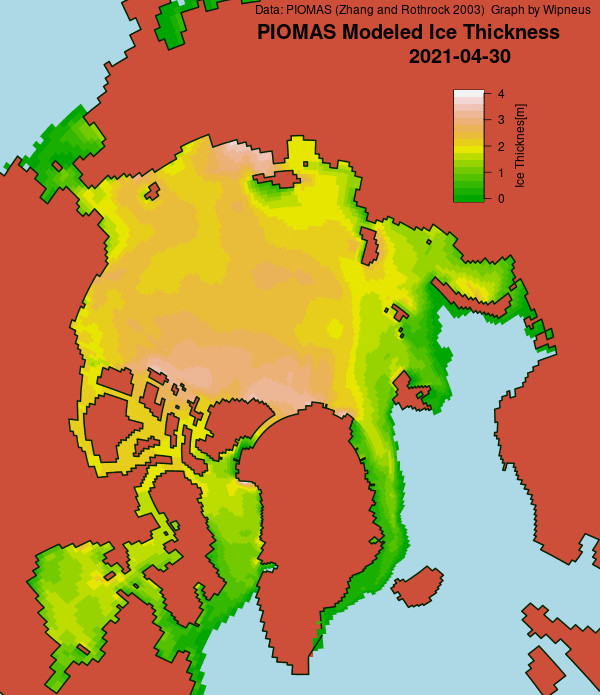
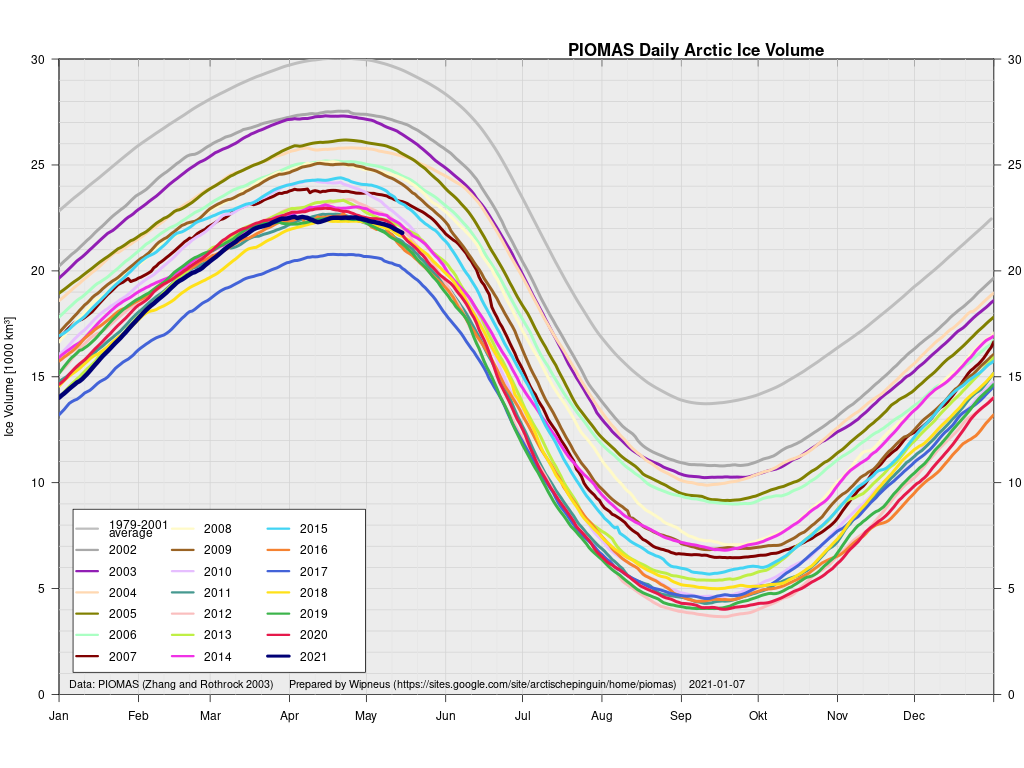
followed by the volume and volume anomaly graphs:
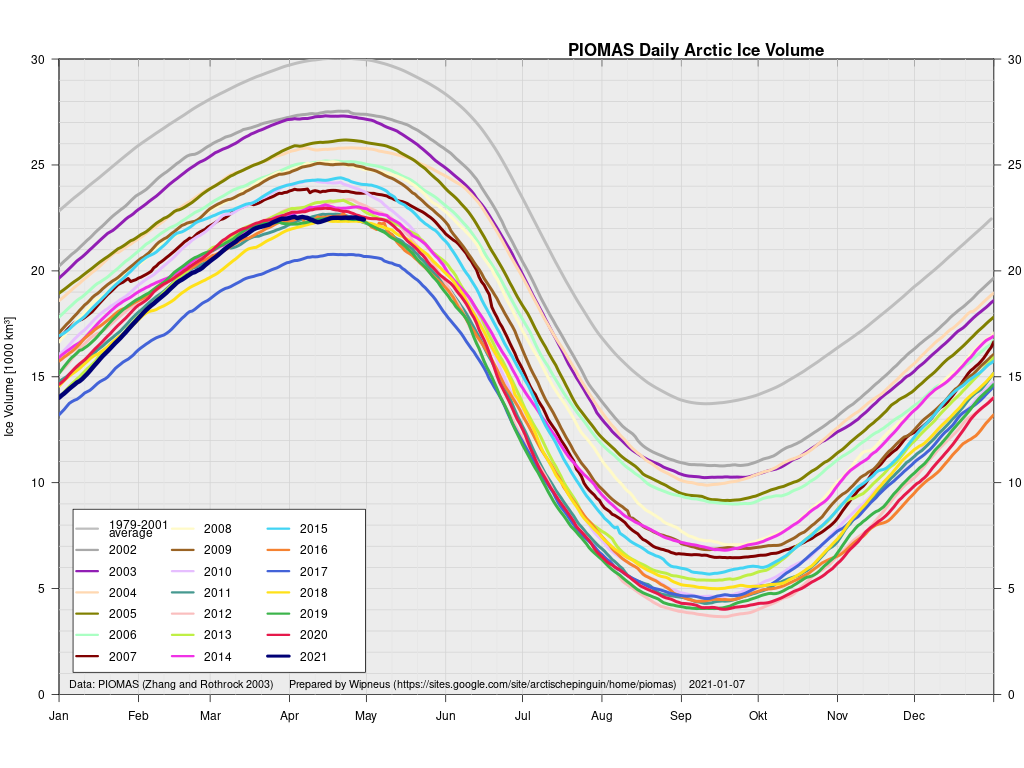
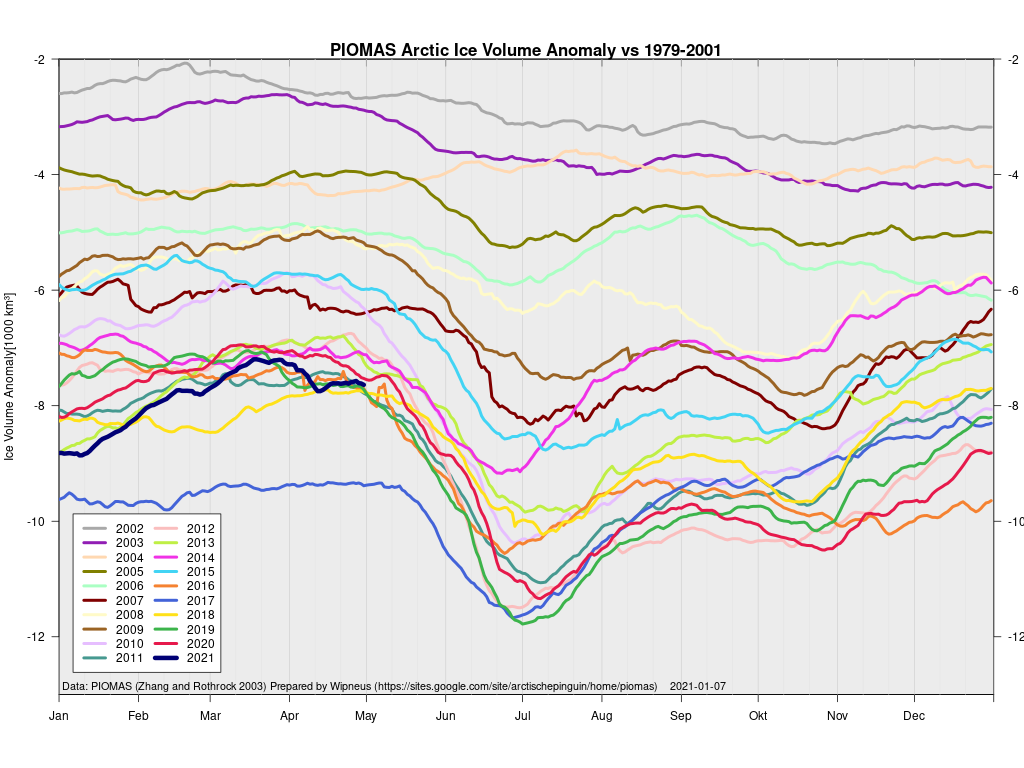
Modelled volume is sixth lowest for the date, but effectively in a “statistical tie” for second lowest, a long way behind 2017.
The National Snow and Ice Data Center have just published the latest edition of Arctic Sea Ice News – “A step in our spring“:
The spring decline in Arctic sea ice extent continued at varying rates through the month of April, highlighted by a mid-month pause. Above average air temperatures and low sea level pressure dominated on the Atlantic side of the Arctic, while near average conditions ruled elsewhere.
Arctic sea ice extent averaged for April 2021 was 13.84 million square kilometers (5.34 million square miles). This was 410,000 square kilometers (158,000 square miles) above the record low for the month set in 2019 and 850,000 square kilometers (328,000 square miles) below the 1981 to 2010 average. The average extent for the month ranks sixth lowest in the passive microwave satellite record. Extent was notably low in the Barents and Bering Seas as well as the Labrador Sea. Elsewhere, extent was close to or somewhat below average (Figure 1). The largest ice loss during April was in the Sea of Okhotsk and the Labrador Sea, with smaller losses along the southern edge of the Bering Sea, and in the eastern Barents Sea near the coast of Novaya Zemlya.
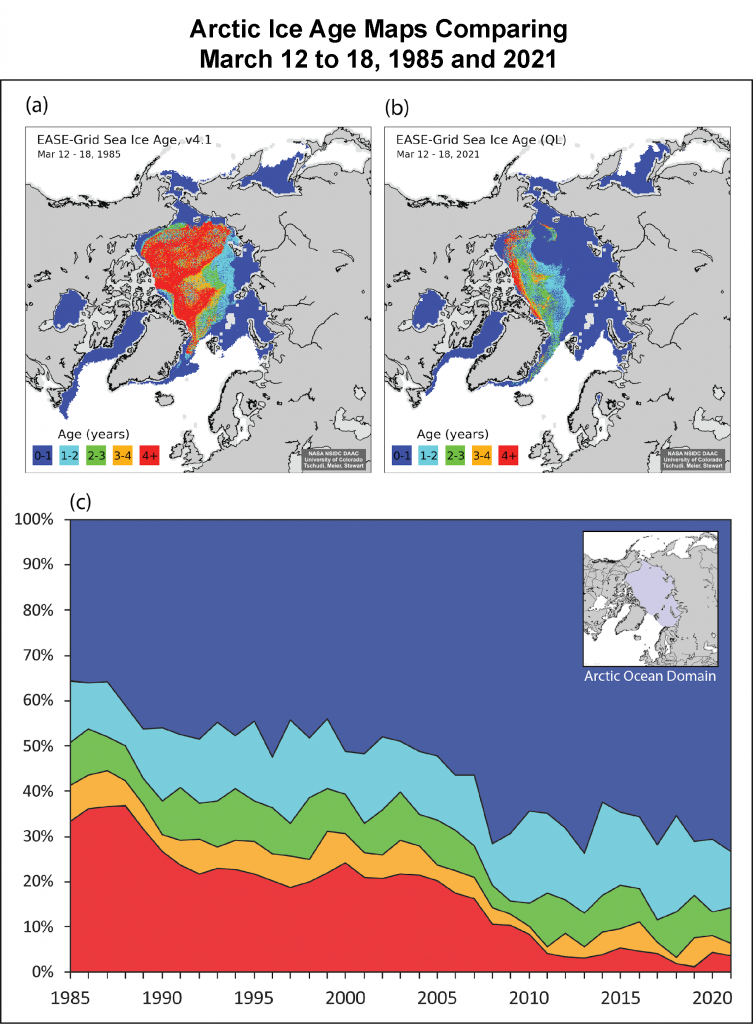
The article also includes an update on Arctic sea ice age:
The sea ice continues to be far younger, and thus thinner, than in the 1980s. There is little change in the age distribution from last year. At the end of the ice growth season in mid-March, 73.3 percent of the Arctic Ocean domain was covered by first-year ice, while 3.5 percent was covered by ice 4+ years old. This compares to 70.6 percent and 4.4 percent respectively in March 2020. In March 1985, near the beginning of the ice age record, the Arctic Ocean region was comprised of nearly equal amounts of first-year ice (39.3 percent) and 4+ year-old ice (30.6 percent).
The snow has gone from the upper Mackenzie valley, and the river ice has also gone in a few places:
The “large floe” mentioned at the top of the page has managed to stay intact as those around it have disintegrated on their way through the Fram Strait. Here’s a somewhat cloudy animation showing the floe’s movement from day to day:
The Polar Science Center has released the April PIOMAS data. No surprises with the volume graph, but their anomaly maps are always of interest, and these days they include comparisons with CryoSat-2:
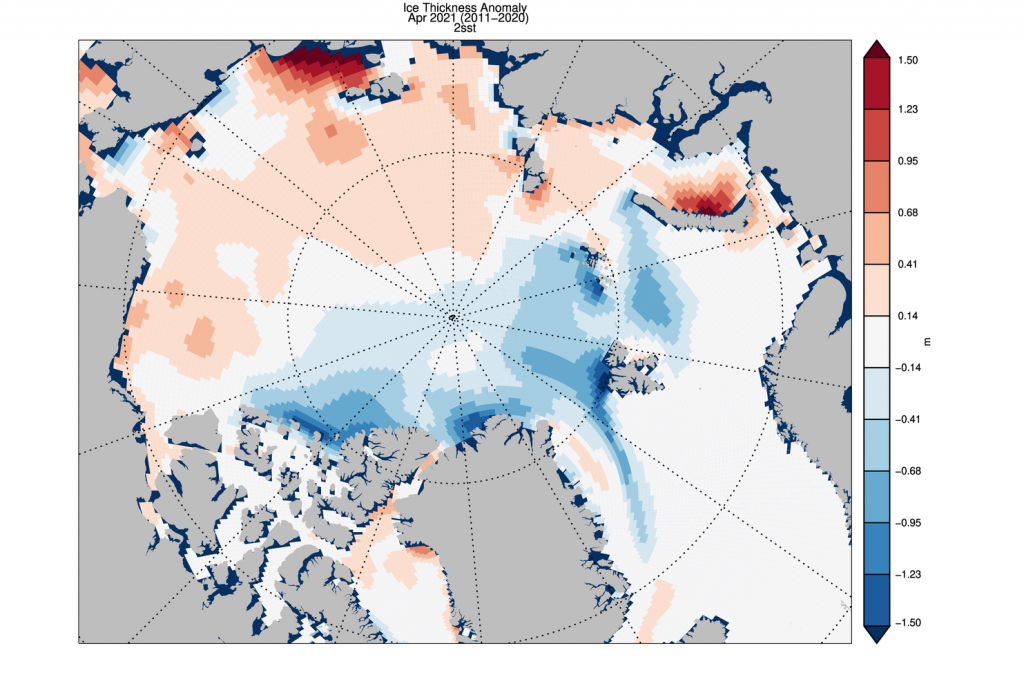
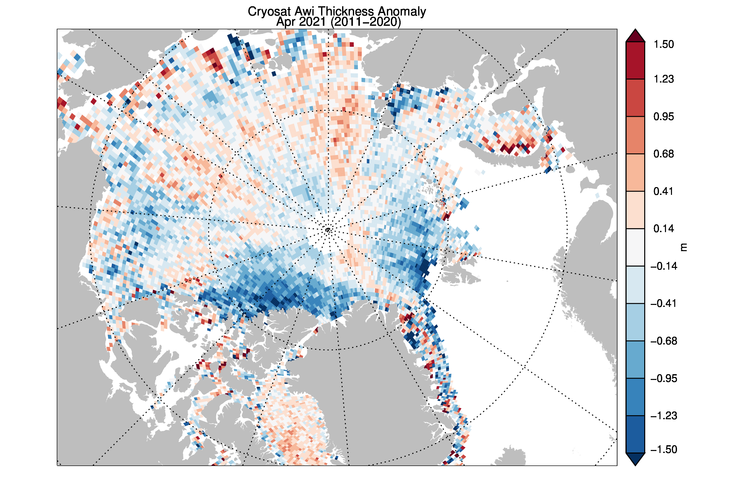
The divergence between PIOMAS and CS2 total volume is apparent once again this month. Despite that the anomaly maps are broadly similar, with positive anomalies on the Siberian side of the Arctic versus negative ones on the Canadian side. There is one obvious difference of opinion however. The majority of the Beaufort Sea is blue for CryoSat-2 but red for PIOMAS.
The “big block” we’ve been watching on its journey through the Fram Strait has started breaking up into smaller pieces under a veil of cloud:
This morning there’s a fairly clear view from the NOAA-20 satellite of the disintegration of the sea ice cover in the Chukchi Sea and thereabouts:
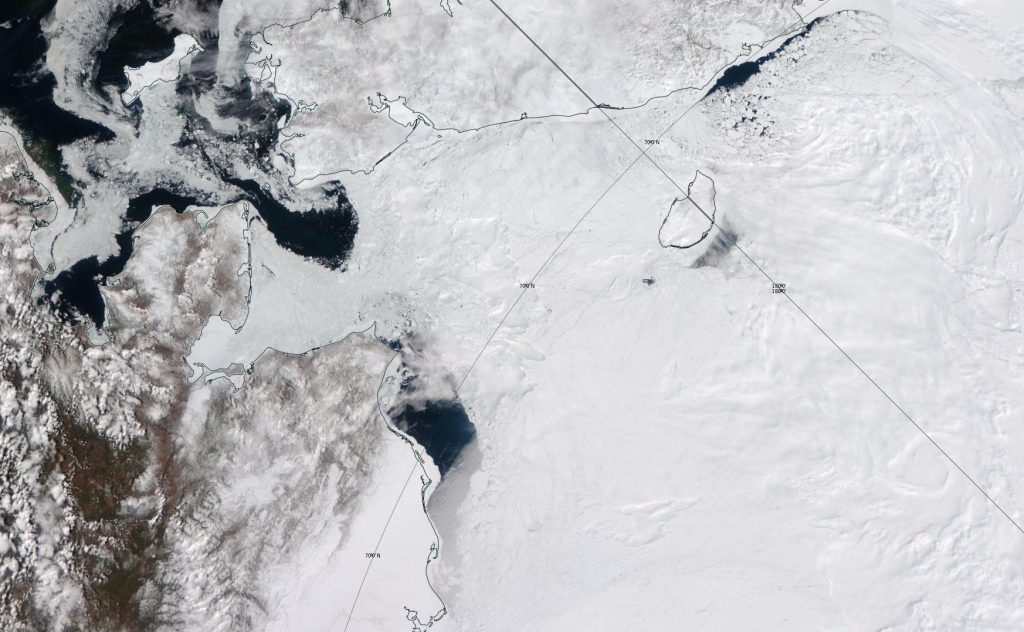
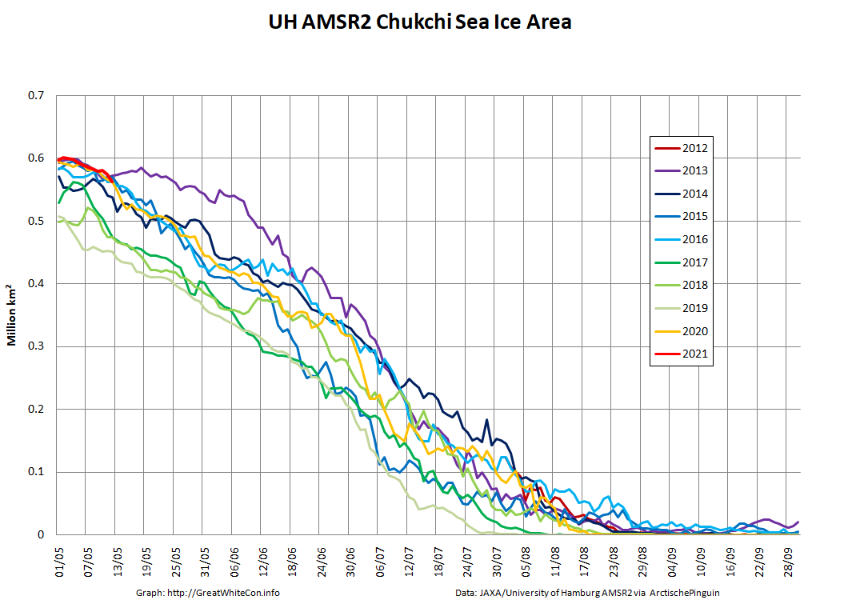
Here’s the current high resolution AMSR2 sea ice area graph for the Chukchi Sea
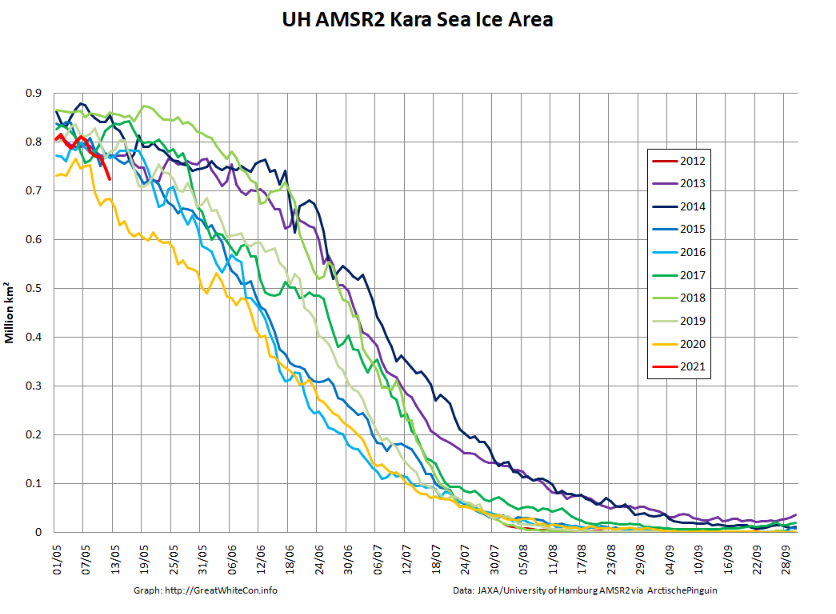
Meanwhile over on the North Atlantic side of the Arctic, sea ice area in the Laptev Sea is now second lowest in the AMSR2 era, behind 2020:
This is the time of year when snow cover over Canada and Siberia becomes very important to the overall albedo of the Arctic. The GFS is also forecasting a persistent anticyclone over the Arctic:
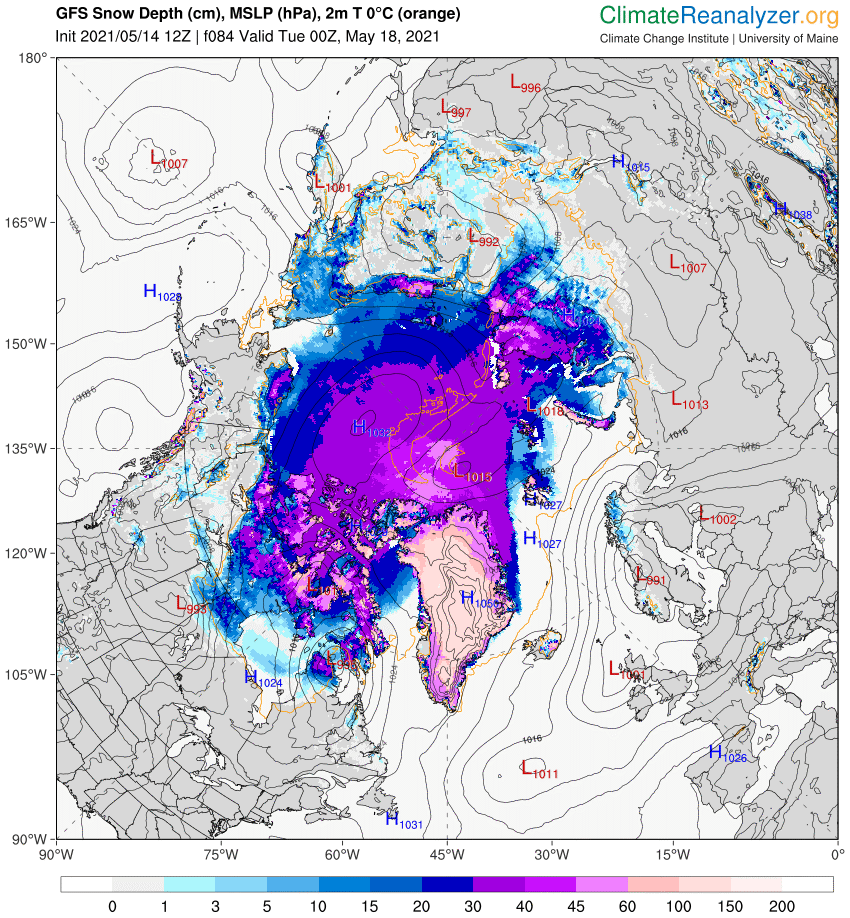
It’s due to start in 3 days, so quite possibly it will verify in the “real world”, which will not be good for the ice since insolation is increasing quickly as midsummer’s day approaches, and high pressure implies few clouds. From now until early August the Arctic receives more energy from the sun than equatorial regions:
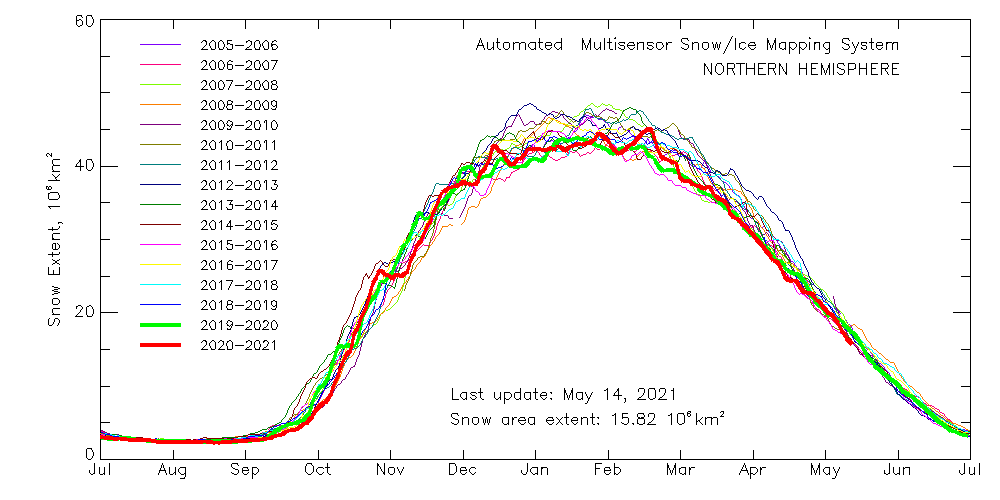
Northern Hemisphere snow extent is already very low for the time of year:
Run the Climate Reanalyzer animation to see what’s predicted to happens to the remaining snow cover over the land surrounding the Arctic Ocean over the next few days.
[Edit – May 18th]The forecast high pressure has arrived and the skies have cleared over the Beaufort Sea:
The fast ice off the Mackenzie Delta is looking decidedly soggy and has started breaking up:
Over on the Siberian side of the Arctic the Lena Delta is starting to look somewhat soggy as well:
The mid month PIOMAS gridded thickness numbers have been released. Starting with Fram export once again:
Next up is thickness animation up to May 15th:
and finally the volume and volume anomaly graphs:

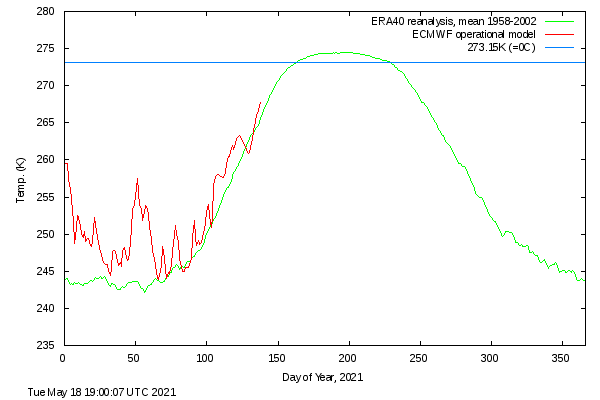
These reflect the comparatively cold spring of 2021, with volume not decreasing as quickly as in recent years. However that has now changed. Here’s the current DMI high Arctic temperature graph for example:
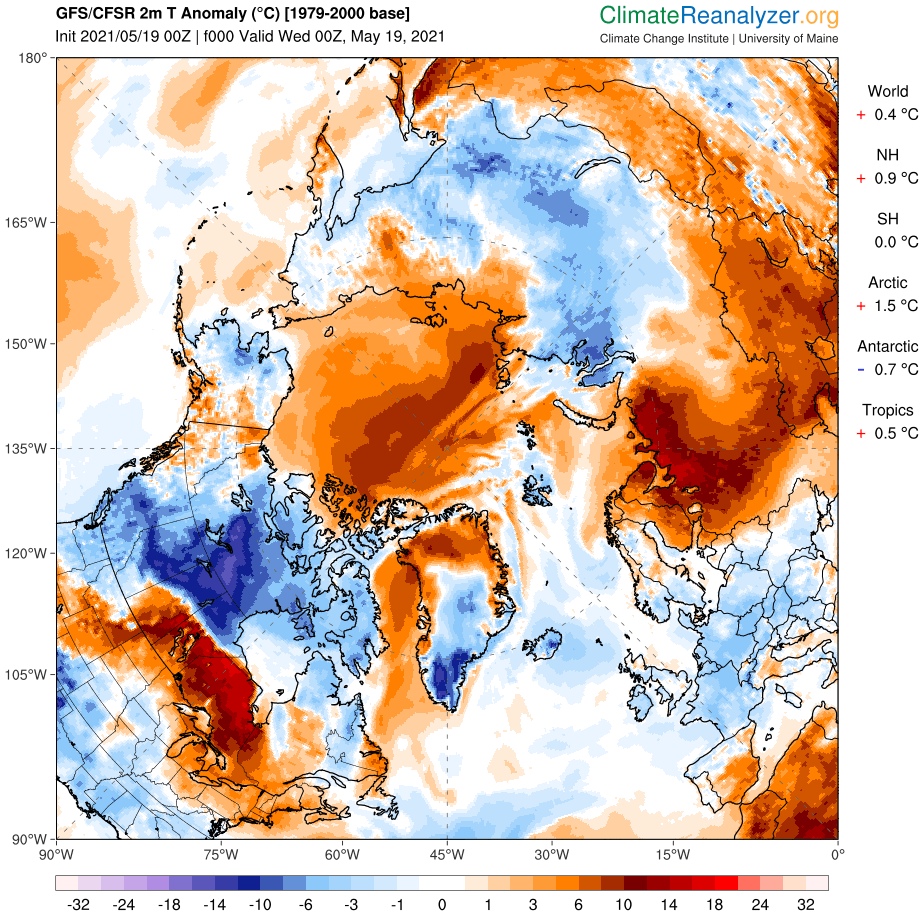
The current GFS temperature anomaly map reveals above average temperatures across the central Arctic, and a pulse of extreme heat on the shores of the Barents Sea:
Compare and contrast this morning’s GFS snow depth forecast for the beginning of June with the mid May equivalent above:
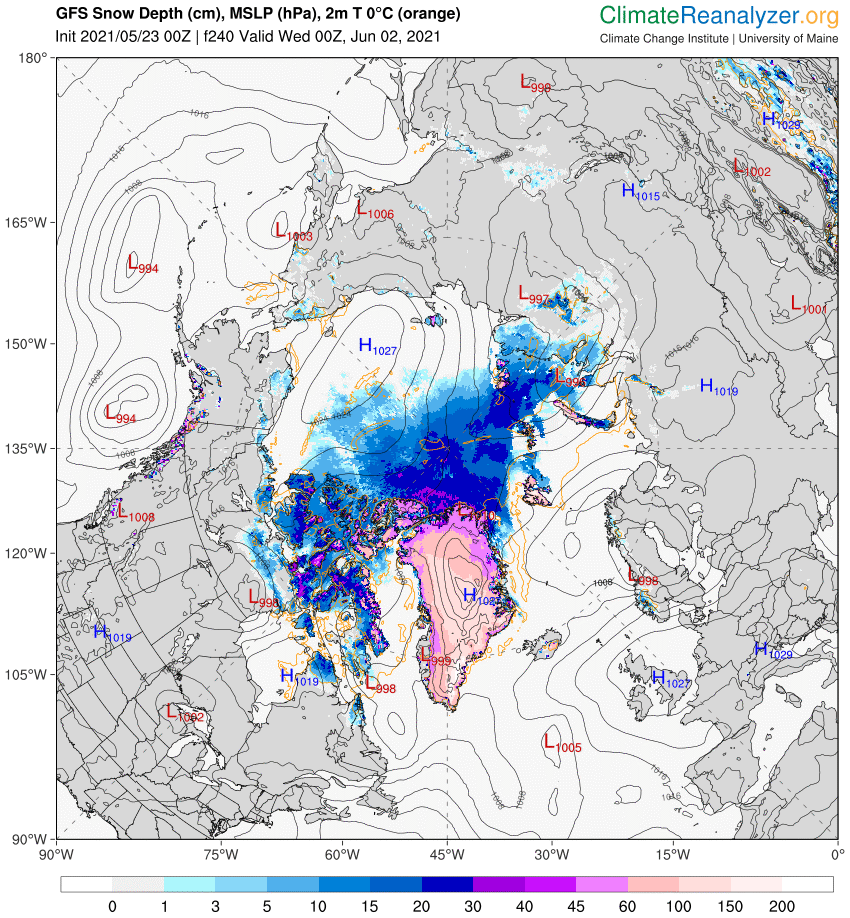
If that “long range” forecast actually verifies there will be a fair few melt ponds between the Beaufort and Laptev Seas by then. That process has already begun, as revealed by these Sentinel 2 “false colour” images of the Mackenzie Delta:
and the Pevek area of Chaunskaya Bay:
A clear “false colour” view of the now liquid Lena Delta is visible from on high today:
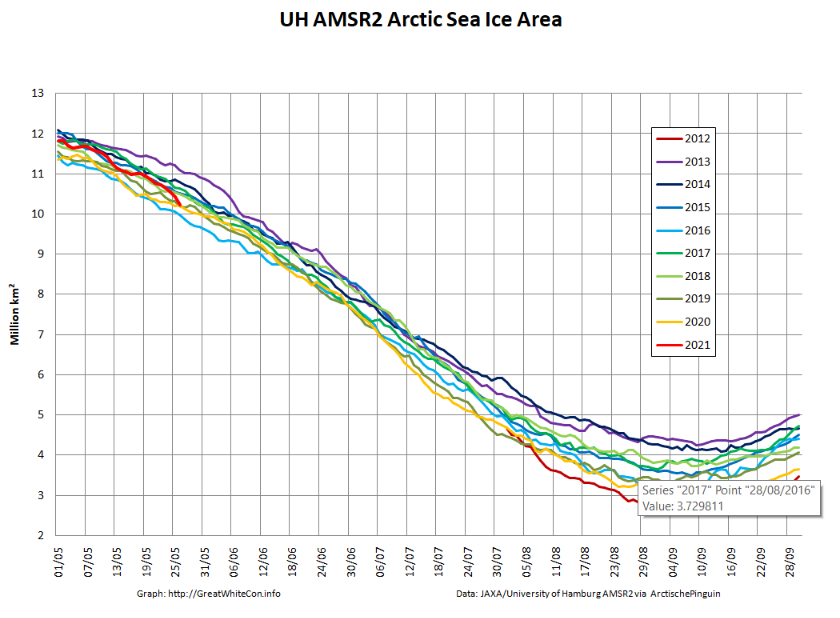
High resolution Arctic sea ice area has taken a tumble over the last couple of days, and is now in a “statistical tie” for second lowest for the date in the AMSR2 record:
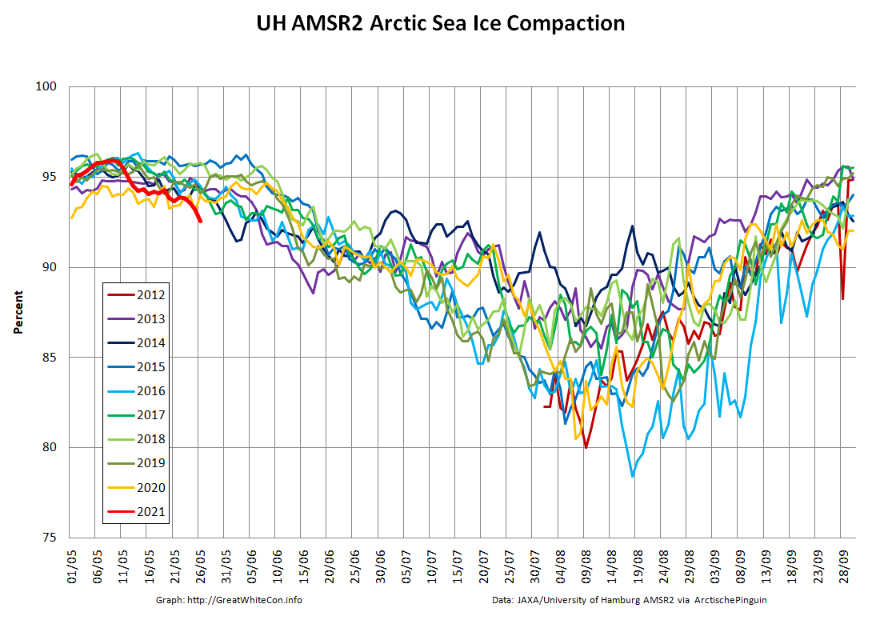
Extent hasn’t been falling as fast, which means that compaction is now in previously uncharted territory:
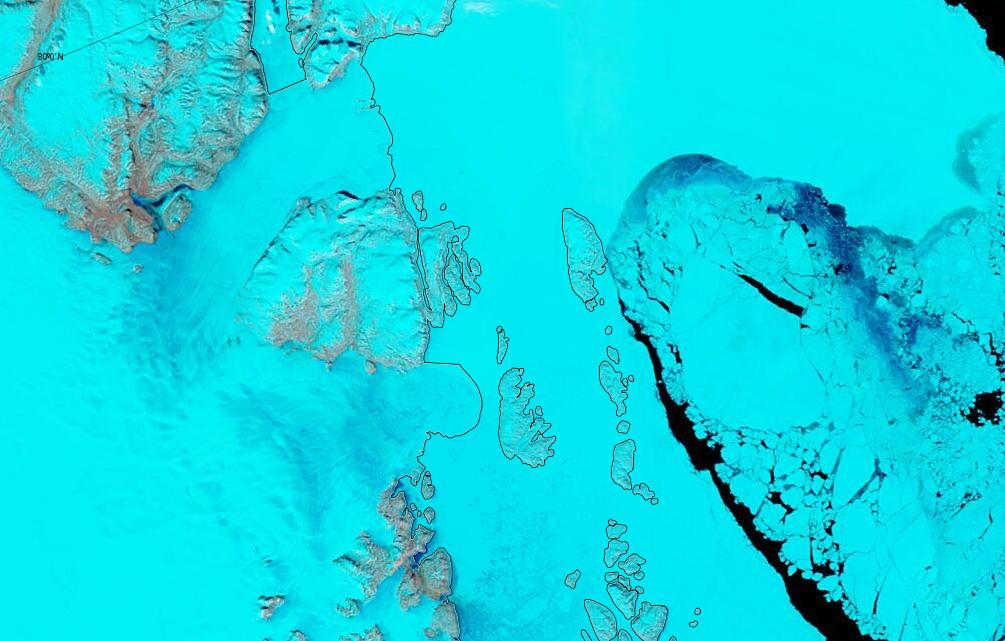
The skies have been clear over North East Greenland, to reveal melt ponds forming on 79 North Glacier:
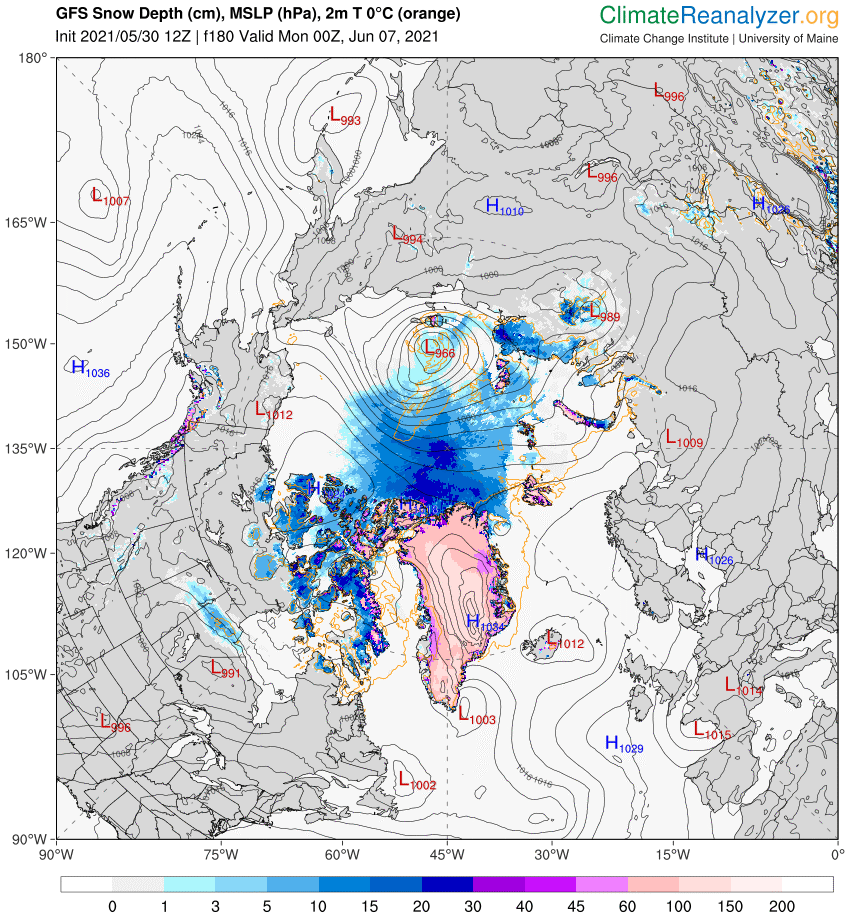
This GFS forecast is a week away, and therefore needs to be taken with a large pinch of Laptev Sea salt, but if it verifies a 966 hPa MSLP cyclone will be spinning in the Central Arctic by then and much of the snow cover will be gone:
The conversation continues as the summer melting season begins:
https://GreatWhiteCon.info/2021/06/facts-about-the-arctic-in-june-2021/
Dmi temp seems consistently warm. I predict mayhem!
The latest updates from the DMI:
I guess “consistently warm” compared to the somewhat ancient climatology covers it?
However I suspect that your predicted “mayhem” will probably take a while to arrive. See e.g.
Further to the snow melt in the Mackenzie valley I have been informed via the Arctic Sea Ice Forum that Fort Simpson has been flooded this year:
https://www.cbc.ca/news/canada/north/fort-simpson-flood-may-14-1.6027111
To complement the AWI CryoSat-2 thickness maps above, see also this A/B comparison with last year from CPOM:
The conversation can be continued on the new June 2021 thread:
https://GreatWhiteCon.info/2021/06/facts-about-the-arctic-in-june-2021/