Shock News! The David and Judy Show took to the road once again last night, aided and abetted by all the usual suspects. We’ll skip the Breitbarts, Hellers and Watts of this world and head straight for the now ex Prof. Judith Curry‘s “Climate Etc.” blog. There we will discover “Climate scientists versus climate data“, a guest post by ex NOAA scientist John Bates. According to John:
The most serious example of a climate scientist not archiving or documenting a critical climate dataset was the study of Tom Karl et al. 2015 (hereafter referred to as the Karl study or K15), purporting to show no ‘hiatus’ in global warming in the 2000s (Federal scientists say there never was any global warming “pause”). The study drew criticism from other climate scientists, who disagreed with K15’s conclusion about the ‘hiatus.’ (Making sense of the early-2000s warming slowdown). The paper also drew the attention of the Chairman of the House Science Committee, Representative Lamar Smith, who questioned the timing of the report, which was issued just prior to the Obama Administration’s Clean Power Plan submission to the Paris Climate Conference in 2015.
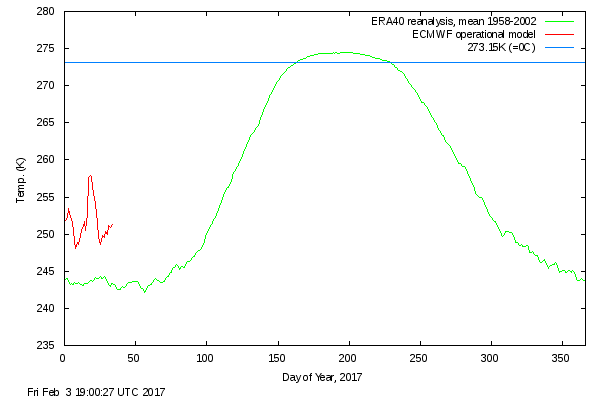
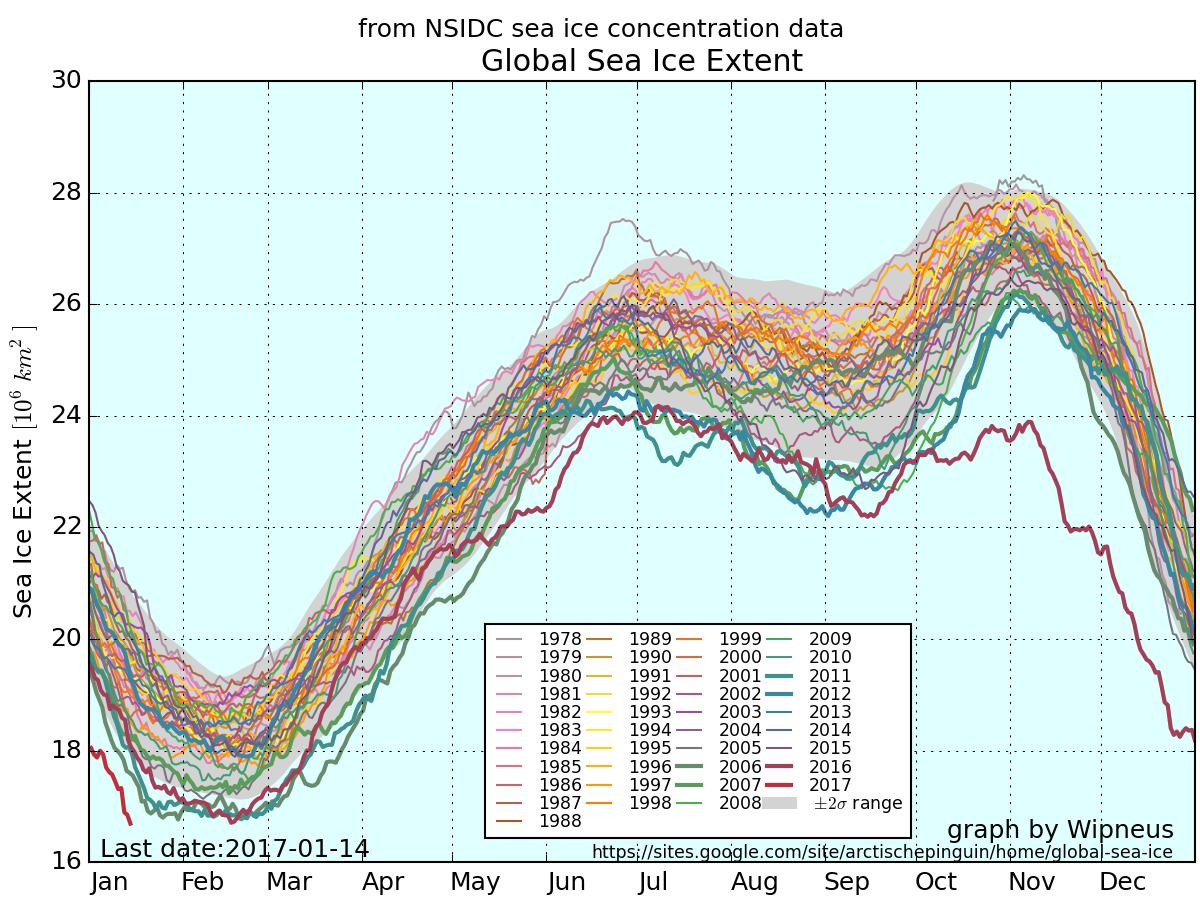
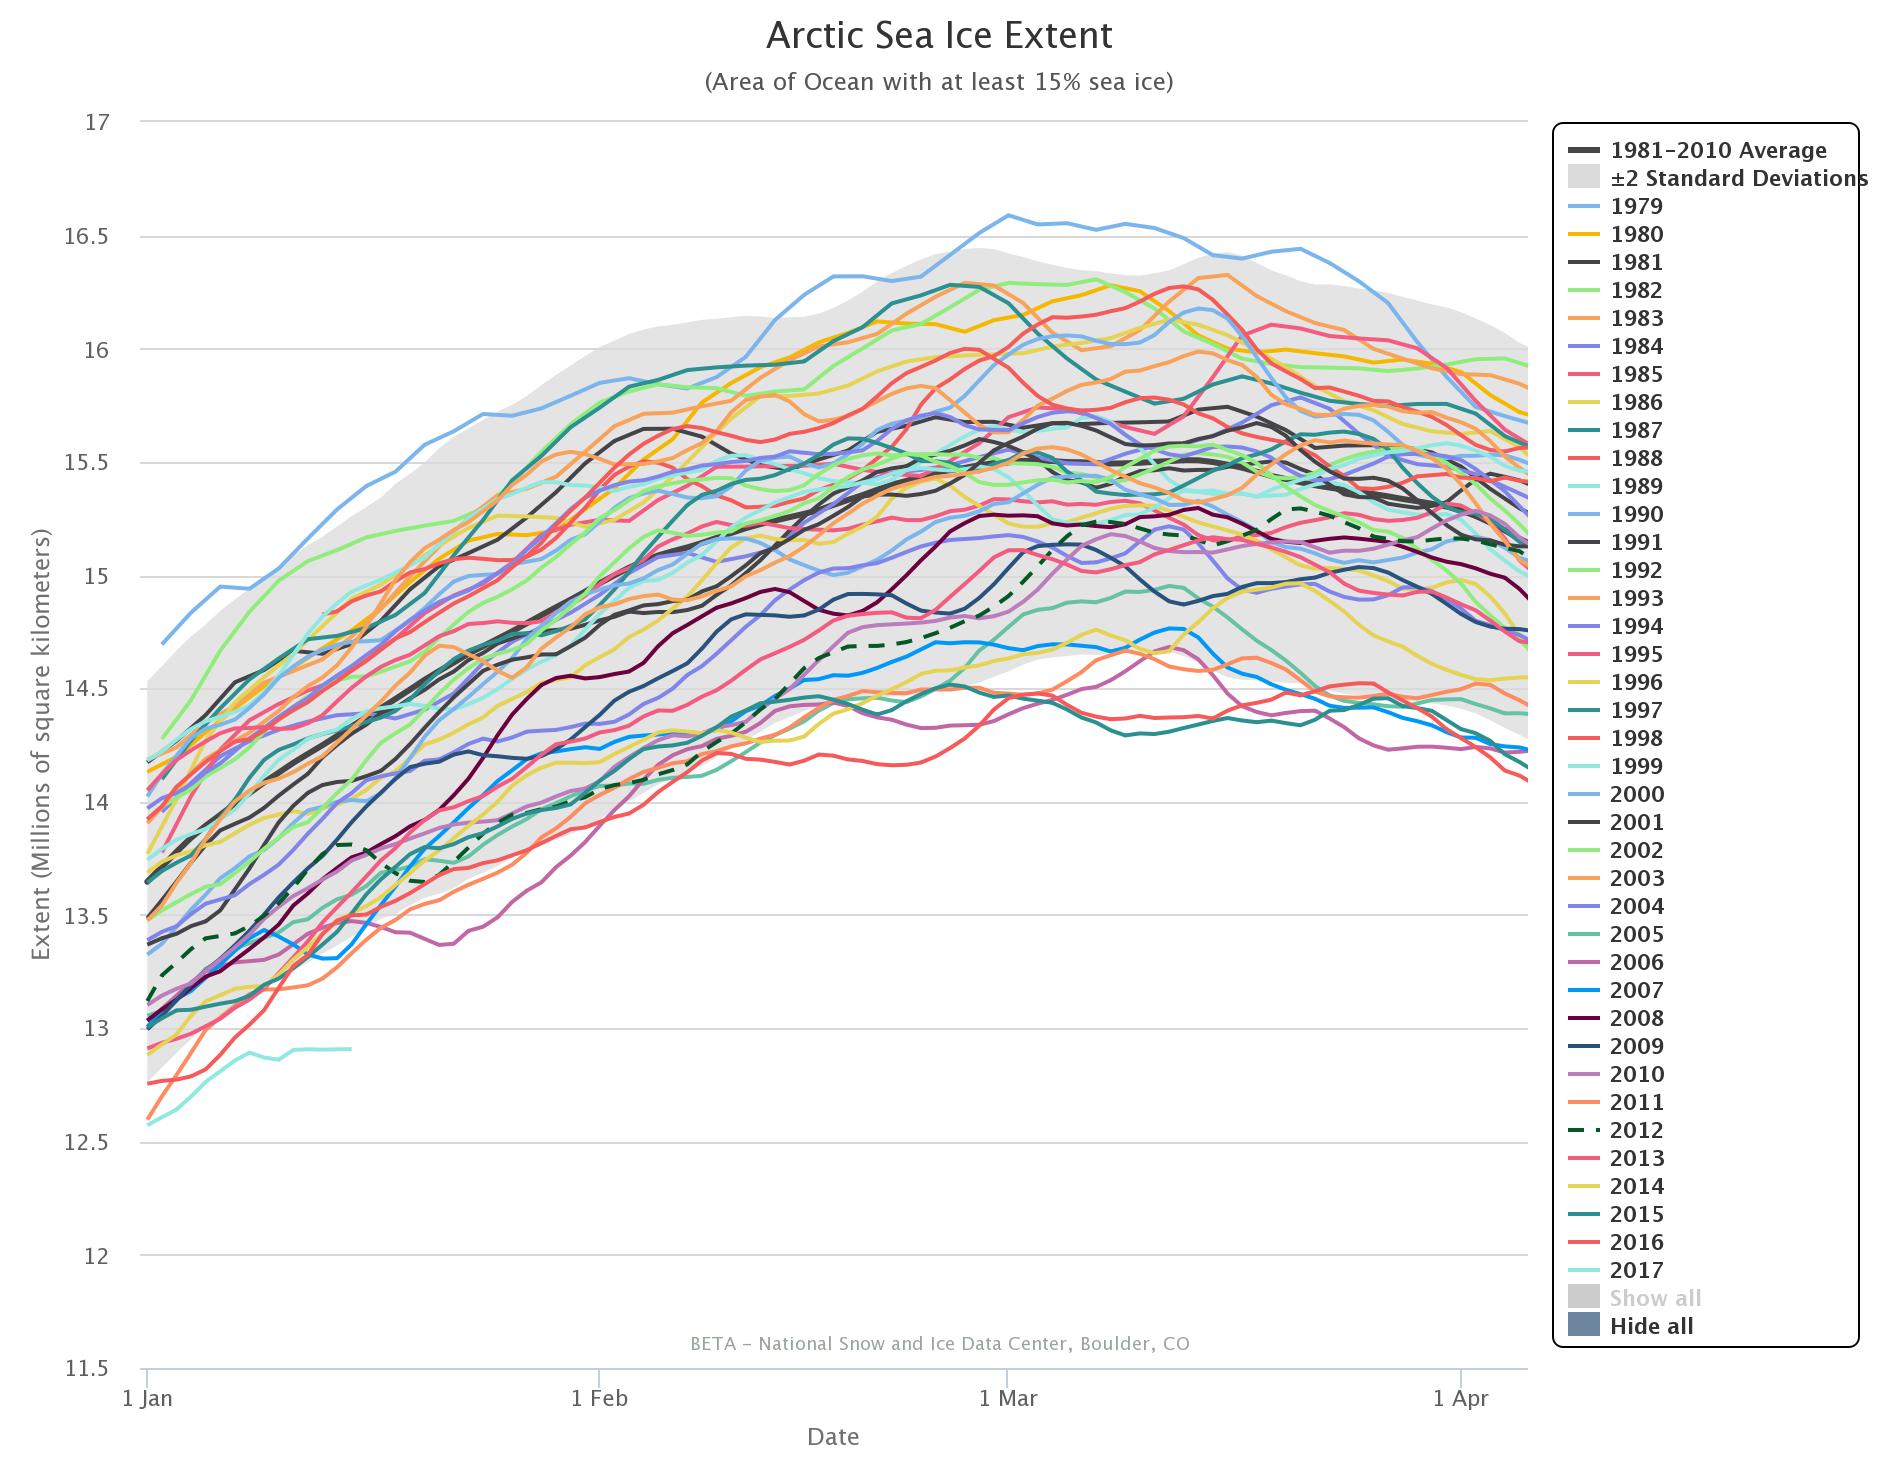
Regular readers of our humble scribblings will be well aware that here in Great White Con Ivory Towers we are firmly of the opinion that there never was a ‘hiatus’. Exhibit 1:
What’s all the fuss about then? Perhaps our old friend David Rose can explain in layperson’s terms? In his latest article for the Mail on Sunday, catchily entitled “Exposed: How world leaders were duped into investing billions over manipulated global warming data”, he assures us that amongst many other things:
The [K15] report claimed that the ‘pause’ or ‘slowdown’ in global warming in the period since 1998 – revealed by UN scientists in 2013 – never existed, and that world temperatures had been rising faster than scientists expected. Launched by NOAA with a public relations fanfare, it was splashed across the world’s media, and cited repeatedly by politicians and policy makers.
But the whistleblower, Dr John Bates, a top NOAA scientist with an impeccable reputation, has shown The Mail on Sunday irrefutable evidence that the paper was based on misleading, ‘unverified’ data.
It was never subjected to NOAA’s rigorous internal evaluation process – which Dr Bates devised.
Now “never subjected to NOAA’s rigorous internal evaluation process” isn’t quite the same thing as “manipulated global warming data”, but Mr. Rose has more!
The misleading ‘pausebuster chart’: The red line shows the current NOAA world temperature graph – which relies on the ‘adjusted’ and unreliable sea data cited in the flawed ‘Pausebuster’ paper. The blue line is the UK Met Office’s independently tested and verified ‘HadCRUT4’ record – showing lower monthly readings and a shallower recent warming trend
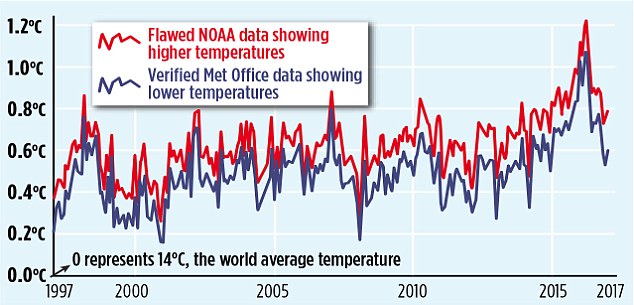
That graph looks convincing enough, doesn’t it? However there is a teensy weensy little upward adjustment in there that Mr. Rose is apparently unaware of, as NASA’s Gavin Schmidt pointed out late last night:
https://twitter.com/ClimateOfGavin/status/828082851585388544
This morning Carbon Brief has published a much longer takedown of the aforementioned purple prose by Zeke Hausfather, who points out amongst other things that:
What [David Rose] fails to mention is that the new NOAA results have been validated by independent data from satellites, buoys and Argo floats and that many other independent groups, including Berkeley Earth and the UK’s Met Office Hadley Centre, get effectively the same results.
As per usual Mr. Rose doesn’t stick to science, however dubious. He also dabbles in politics. On that front we are assured:
Karl’s ‘Pausebuster’ paper was hugely influential in dictating the world agreement in Paris and sweeping US emissions cuts. President Trump, above right, has pledged to scrap both policies – triggering furious claims by Democrats he is a climate ‘denier’ and ‘anti-science’.
Thanks to today’s MoS story, NOAA is set to face an inquiry by the Republican-led House science committee.
We’ll have much more to say on this controversy in the context of our “Alternative Facts” investigation in due course, but for the moment at least it looks to us as though the nth iteration of “Climategate 2” barely made it out of the starting gate. However Mr. Rose’s loyal army of “rebloggers, retweeters, plagiarisers and other assorted acolytes” and that “Republican-led House science committee” may of course have other ideas?
Commentary on Judith Curry’s blog brought to light an article by Peter Thorne. He says, amongst many other things:
I worked for three and a bit years in the NOAA group responsible in the build-up to the Karl et al. paper (although I had left prior to that paper’s preparation and publication). I have been involved in and am a co-author upon all relevant underlying papers to Karl et al., 2015.
The ‘whistle blower’ is John Bates who was not involved in any aspect of the work. NOAA’s process is very stove-piped such that beyond seminars there is little dissemination of information across groups. John Bates never participated in any of the numerous technical meetings on the land or marine data I have participated in at NOAA NCEI either in person or remotely. This shows in his reputed (I am taking the journalist at their word that these are directly attributable quotes) mis-representation of the processes that actually occured. In some cases these mis-representations are publically verifiable.
A “rave from the grave” suggests itself at this juncture:
See if you can spot where Dan & Dan mention the term #Climategate.
It’s been a busy day! Several of my carefully crafted comments have ended up on Judy’s cutting room floor, but this one has eluded the red pencil thus far. I bring you this warming and educational nightcap created by an ad hoc team of celebrity international chefs for “warmists” around the planet:
You have to keep clicking through to the very bottom of the virtual mug in order to experience the full benefit of the beverage.
Thank you and good night from May or May Not Land. I’ll see you all in the morning (UTC).
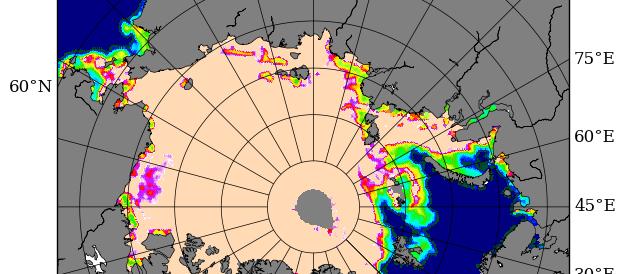
Lot’s of pertinent papers just in from Great White Con guest author Kevin Cowtan of York University. Kevin is part of the by now world famous team of Cowtan & Way, who have long championed the cause of accurate Arctic temperature measurements. Kevin tells us:
The paper by Karl and colleagues corrected two known problems with the temperature observations: poor coverage of the Arctic, and a change from ships to buoys. Both had been known about since 2008:
http://www.realclimate.org/index.php/archives/2008/11/mind-the-gap/
and were further reported in subsequent papers:
http://onlinelibrary.wiley.com/doi/10.1029/2009JD012442/abstract
http://www.metoffice.gov.uk/hadobs/hadsst3/part_2_figinline.pdf
http://onlinelibrary.wiley.com/doi/10.1002/qj.2297/abstract
http://advances.sciencemag.org/content/3/1/e1601207
It took NOAA seven years to produce a paper correcting their temperature data, and even now their monthly updates still omit much of the Arctic. The UKMO temperature record is also missing much of the Arctic and only partially corrects the ship problem. Both lead to an underestimation of recent warming.
The agencies face an impossible dilemma – on one hand they have to slowly and carefully evaluate new results, and on the other they have to provide an up-to-date temperature record. Rather than rushing out corrections, they appear to have been extremely conservative.
So there you have it. For more accurate Arctic temperature metrics turn to Cowtan & Way and/or the Berkeley Earth Surface Temperature study! The long delay in improving the quality of the data published by NOAA and the UK Met Office has led to confusion amongst the public, politicans, and even other scientists. All three groups have been trying to understand a supposed “pause” in warming, which in our (humble?) opinion never actually happened. If you disagree with that assessment please feel free to take a good long look at izen’s animation at the top and then explain to us very slowly where you see a “hiatus”.
You may also wish to take a good long look at another guest post on the topic of “the pause”, this time authored by our very good friend Bill the Frog.
Watch this video to discover how “The Land of the Free” has morphed into “TrumpLand” in a matter of weeks. The “interrogation” of Rush Holt of the AAAS:
A show trial of the American Association for the Advancement of Science? Congressman Lamar Smith presiding!
We like the UK Met Office’s new style. They have taken off the kid gloves, rolled up their sleeves, and they’re extracting the Michael from David Rose on Twitter with great glee:
Hi @DavidRoseUK we updated your graph – hope it helps make your next article OK for Wikipedia 🙂 @ed_hawkins @flimsin @dougmcneall #fixedit pic.twitter.com/g1PZZBiHQ2
— Prof Richard Betts (@richardabetts) February 9, 2017
It looks like we’ve now got a serious contender for our surrealist crown. We’ll have to try and up our game!
I was beginning to think he’d retired, but no such luck for David Rose! Peter Hadfield (AKA Potholer54) is back with avengeance. Essential viewing:
If you have the time take a good long look at Peter’s takedowns of the Good “Lord” Christopher Monckton.