Construction of Ice Camp Barneo 2014 began close to the North Pole at the beginning of April, and now the first scientific data has started flowing from the sea ice near the Pole. The first of three webcams has been successfully installed on the ice, and the slightly noisy initial images are available from the North Pole Environmental Observatory 2014 web site:
NPEO webcam 1 image from April 14th 2014
Data is now also arriving from ice mass balance buoy 2014E, which as you can see if you click on the pushpins on the map below, has been drifting at the rate of 16 km / day during its brief lifetime on the Arctic sea ice so far:
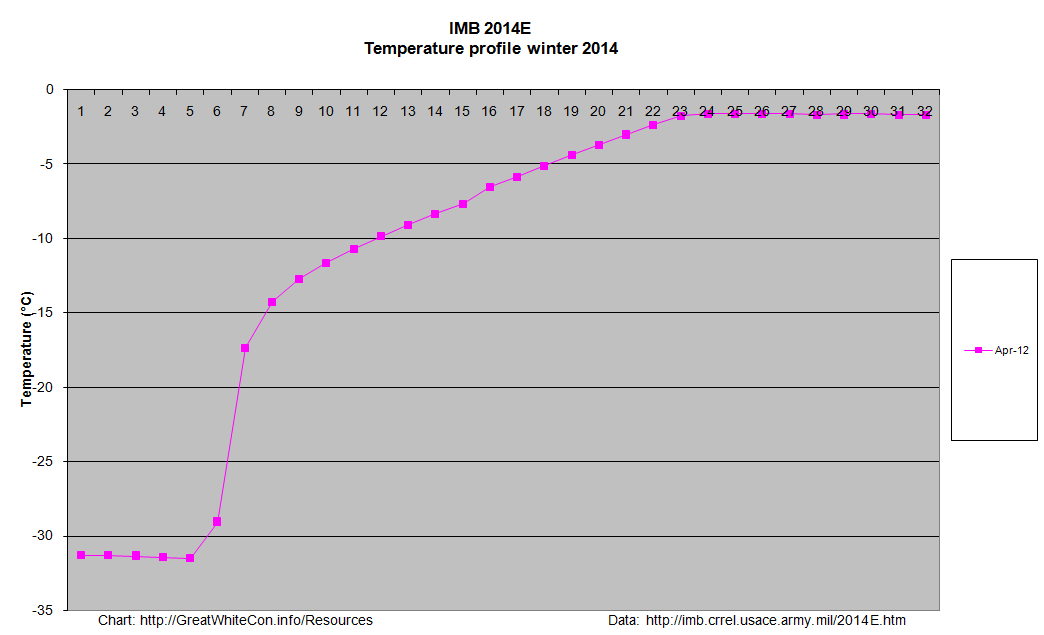
Here’s the initial temperature profile for 2014E:
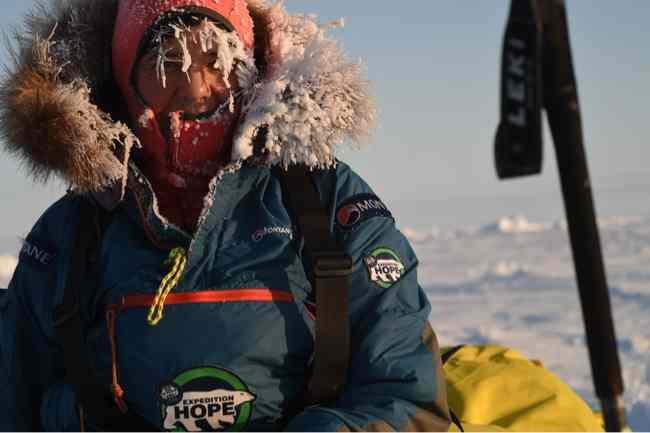
At present the ice on the floe is 1.7 m thick, covered with 19 cm of snow. As you can see, temperatures were a touch chilly when the buoy was installed on April 12th, at around -32 degrees Celsius. A variety of expeditions have already set off from Barneo in various directions. Expedition Hope are heading in the direction of Cape Discovery on Ellesmere Island, and here Bernice Nootenboom illustrates the effects of such low temperatures on the human body:
Bernice Nootenboom near the North Pole. Photo: Martin Hartley
You can also view data from IMB 2014E and the other active ice mass balance buoys on our IMB overview page.
Stung by some unusually constructive criticism from Anthony Watts we have (somewhat hurriedly) added several new pages to the Great White Con “Resources” section of this web site. They contain the sort of information that is rather tricky to update automatically on a daily basis, and concentrate on resources that help the interested searcher after truth get a handle on the thickness and hence volume of the sea ice in the Arctic, on a regional as well as pan Arctic scale.
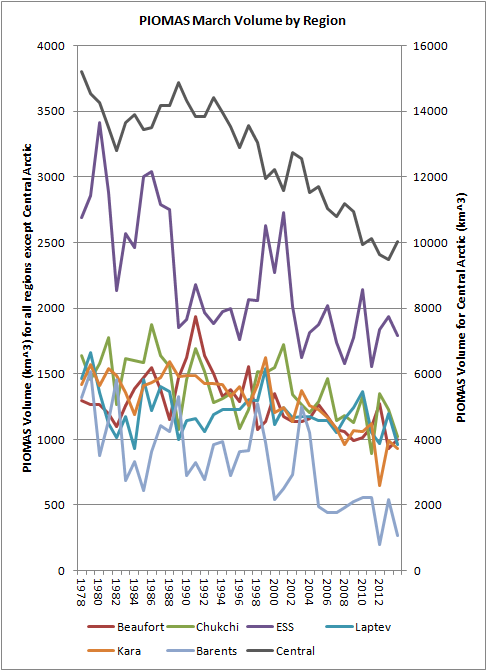
The first section is entitled “Arctic Sea Ice Graphs“, and here’s an example of one graph which reveals the ice volume in various regions of the Arctic, based on the output of the PIOMAS model:
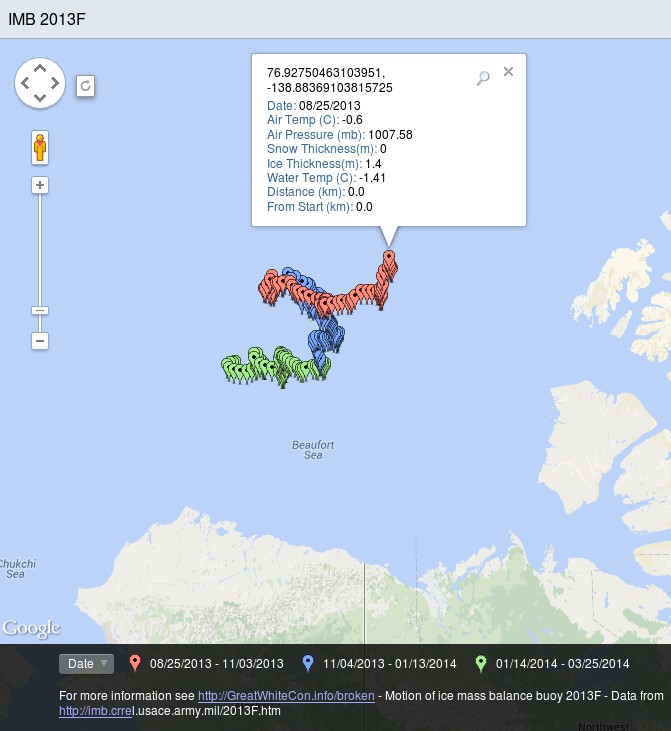
The second section is entitled “Ice Mass Balance Buoys“. As the name hopefully suggests, this section displays data reported by the Cold Regions Research and Engineering Laboratory’s currently active ice mass balance buoys in a variety of novel formats. These buoys are deployed on a regular basis at selected locations across the Arctic, and report on a number of different parameters including snow depth, ice thickness and temperature. By way of example here’s a couple of reports from IMB 2013F, which was originally deployed last August on what was then classified as “first year” ice in the Beaufort Sea. First of all here’s the Google Maps/Earth view that reveals how the buoy has moved around the Arctic since then, and shows how clicking on one of the “pushpins” reveals the values of a variety of interesting metrics on a daily basis:
Google map of the movement of IMB 2013F
As you can see, last August the thickness of the ice floe that the buoy is located upon was 1.4 metres thick. If you click through to the live map and experiment you will discover, amongst a variety of other things, that the ice under the buoy is now 1.68 meters thick, with an additional 49 cm of snow on top of that.
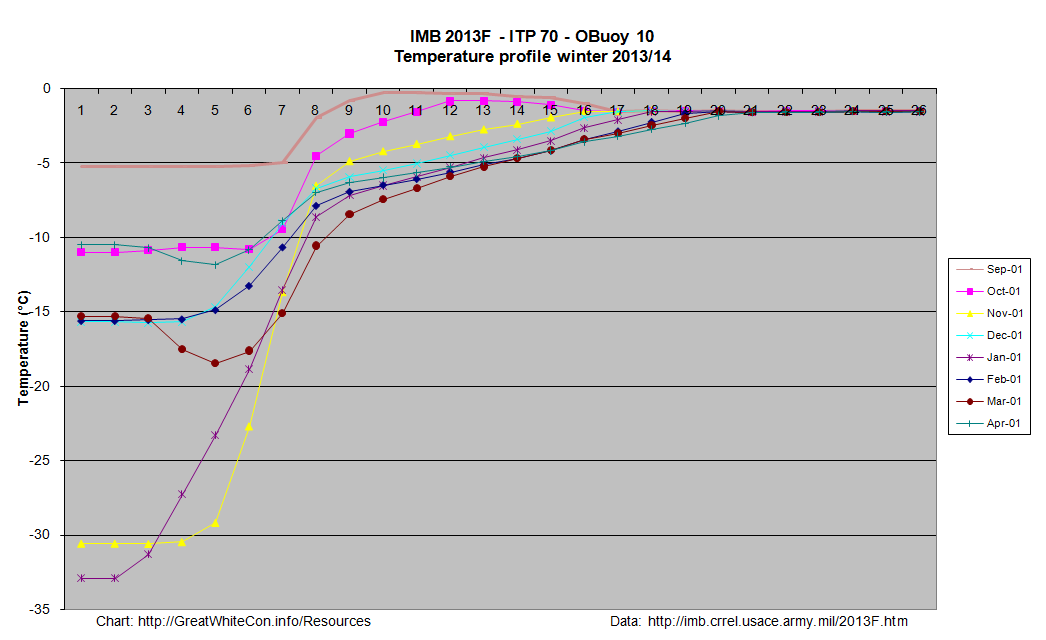
A second set of images shows graphs revealing the temperature above, below and within the ice, currently on a monthly basis:
Click on the graph to view a larger version. This one requires a certain amount of interpretation, but the first thing to note is that the numbers across the top represent the position of thermistors spaced 10 cm apart on a pole that is mounted vertically through the ice floe. Number 1 is in the air above the floe, the rightmost side of the graph (number 26 in this case) is in the water below the ice floe, and somewhere in between those extremes the temperature sensors can also be in the midst of either ice or snow.
At the end of March the interface between ice and snow in this case was somewhere between sensors 8 and 9, and hence at a temperature of around – 7 degrees Celsius, by which time the buoy had moved from the Canadian waters where it started into the area of the Beaufort Sea north of Alaska.
For further discussion about the interpretation of our new resources please use the comment section on the “About Our Arctic Sea Ice Resources” page. For technical observations and suggestions for improvements feel free to comment below!
This website uses cookies to improve your experience. We'll assume you're ok with this, but you can opt-out if you wish. Cookie settingsACCEPT
Privacy & Cookies Policy
Privacy Overview
This website uses cookies to improve your experience while you navigate through the website. Out of these, the cookies that are categorized as necessary are stored on your browser as they are essential for the working of basic functionalities of the website. We also use third-party cookies that help us analyze and understand how you use this website. These cookies will be stored in your browser only with your consent. You also have the option to opt-out of these cookies. But opting out of some of these cookies may affect your browsing experience.
Necessary cookies are absolutely essential for the website to function properly. This category only includes cookies that ensures basic functionalities and security features of the website. These cookies do not store any personal information.
Any cookies that may not be particularly necessary for the website to function and is used specifically to collect user personal data via analytics, ads, other embedded contents are termed as non-necessary cookies. It is mandatory to procure user consent prior to running these cookies on your website.

 At present the ice on the floe is 1.7 m thick, covered with 19 cm of snow. As you can see, temperatures were a touch chilly when the buoy was installed on April 12th, at around -32 degrees Celsius. A variety of expeditions have already set off from Barneo in various directions. Expedition Hope are heading in the direction of Cape Discovery on Ellesmere Island, and here Bernice Nootenboom illustrates the effects of such low temperatures on the human body: