Christmas is coming, and Santa’s secret summer swimming pool has frozen over once again. However the same can’t be said for the Chukchi Sea! More on that in due course, but first let’s take a look at the PIOMAS volume graph at the end of November, courtesy of the wondrous Wipneus on the Arctic Sea Ice Forum:
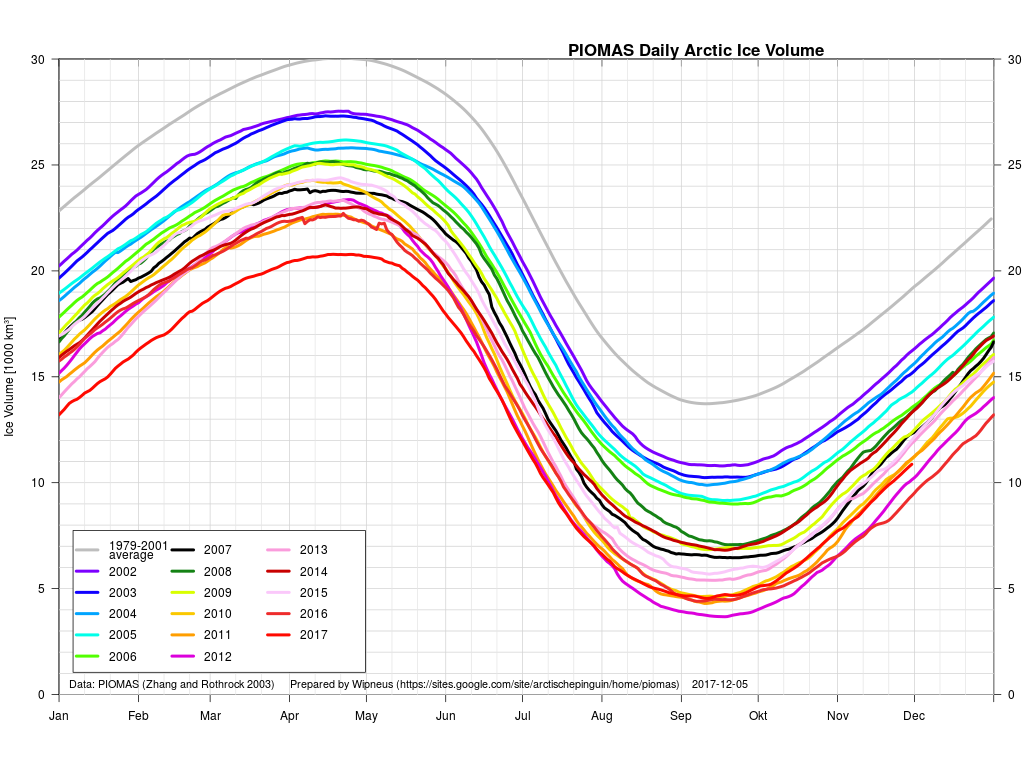
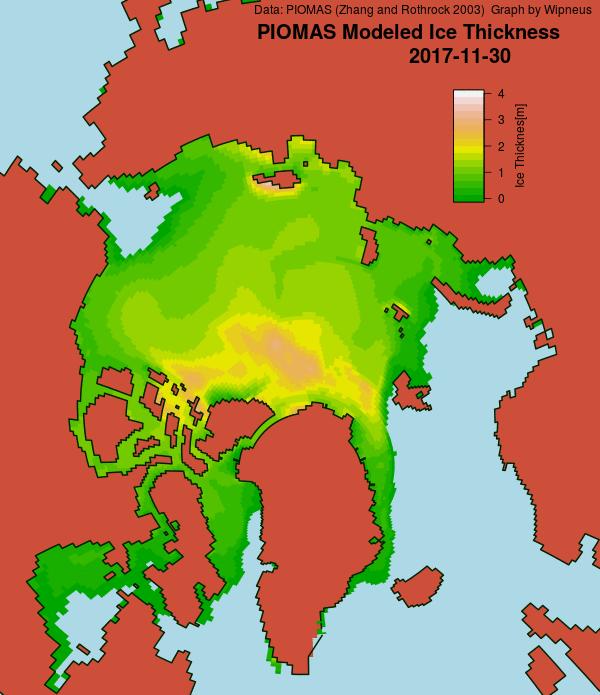
2017 is currently third lowest, behind 2012 and 2016. Next let’s take a look at Wipneus’ PIOMAS Arctic sea ice thickness map:
followed by the University of Bremen’s SMOS Arctic sea ice thickness map:
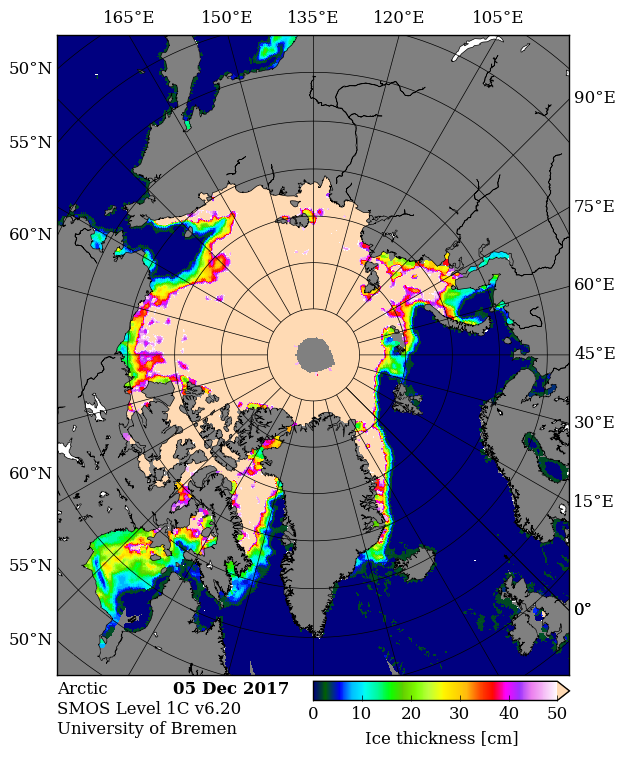
Note the large area of pale blue open ocean still visible in the Chukchi Sea towards the top left of both maps.
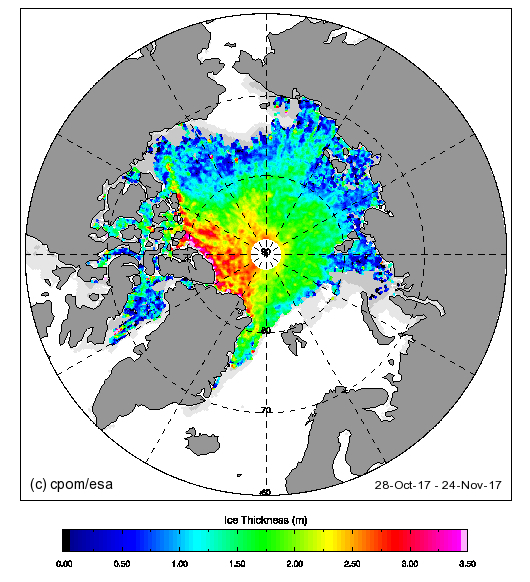
For another perspective on Arctic sea ice thickness here’s the latest Cryosat-2 map, which currently is based on the month up to November 24th:
Finally, for the moment at least, here’s our very own Arctic Freezing Degree Days graph based on the DMI’s >80N data:
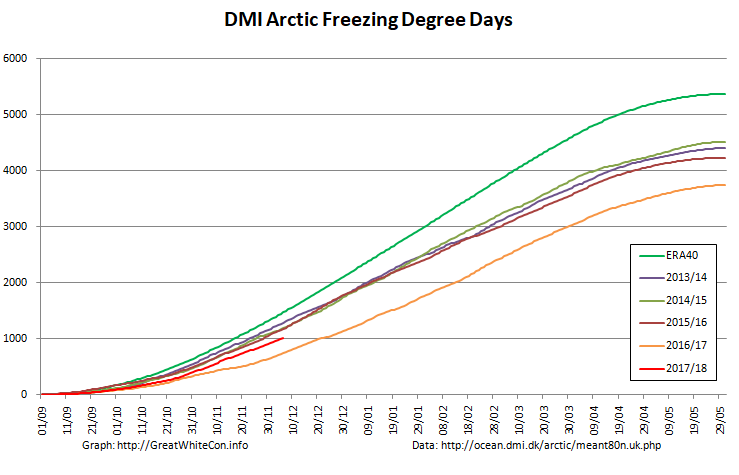
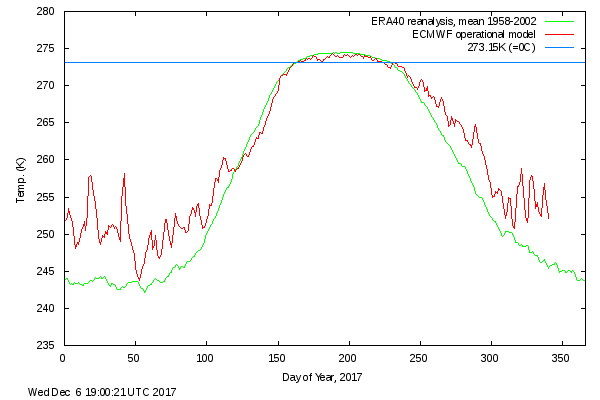
2017 is currently occupying the wide open space between the astonishingly low numbers last year and all previous years in DMI’s record. Here’s their graph for 2017 so far:
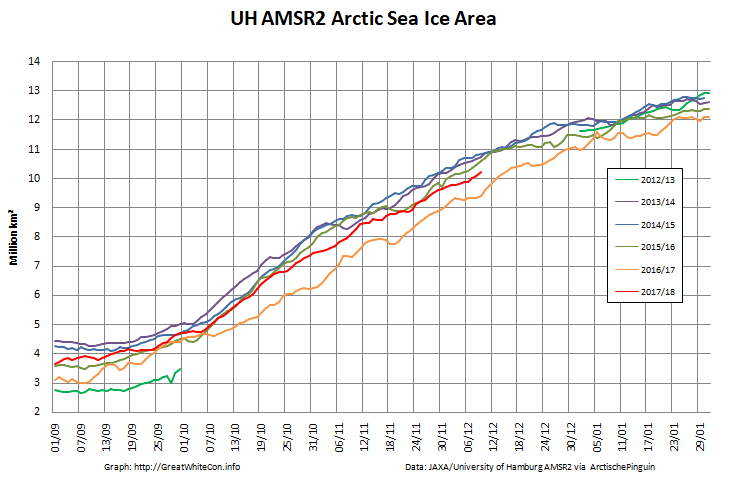
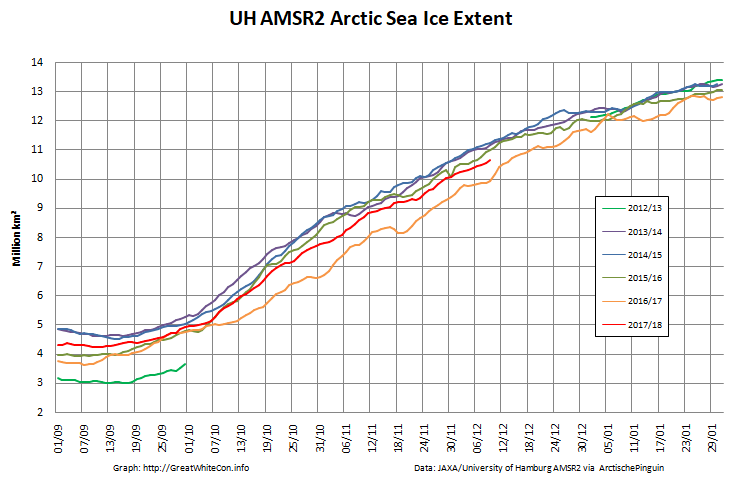
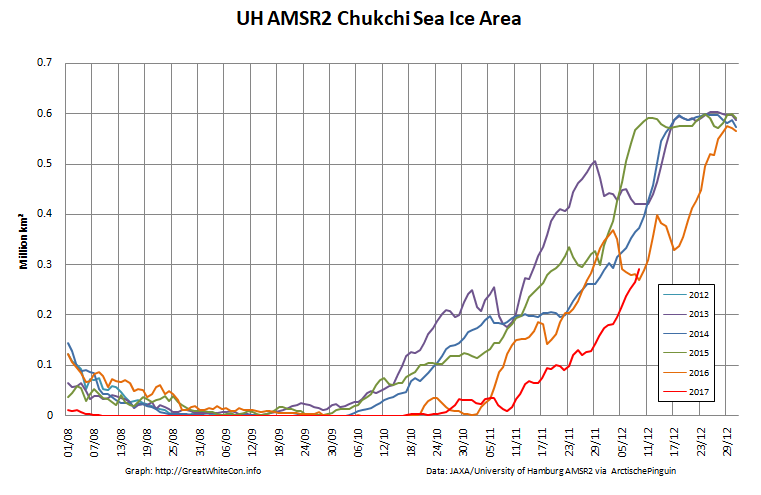
Current Arctic sea ice area and extent derived from the University of Hamburg’s high resolution AMSR2 data:
Plus the latest update on the Chukchi Sea situation:
Wipneus has released his mid month PIOMAS update for December:

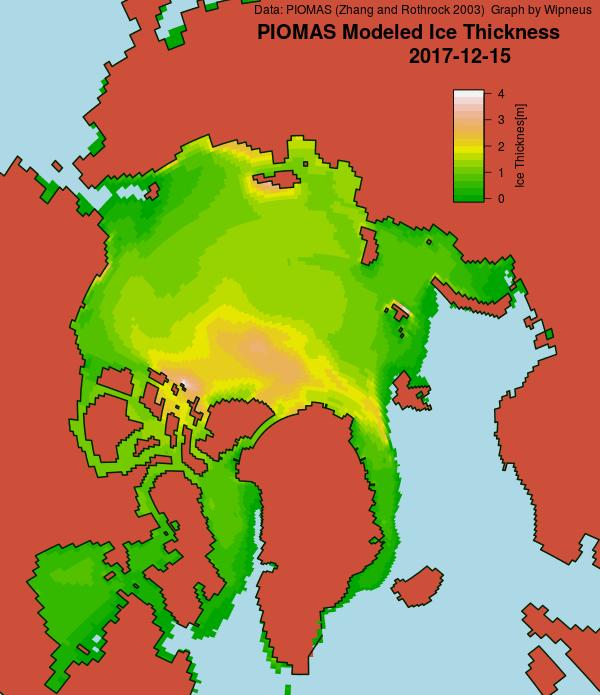
The Chukchi Sea is now mostly covered in sea ice, as is the Kara Sea. Volume is still 3rd lowest behind 2016 and 2012.
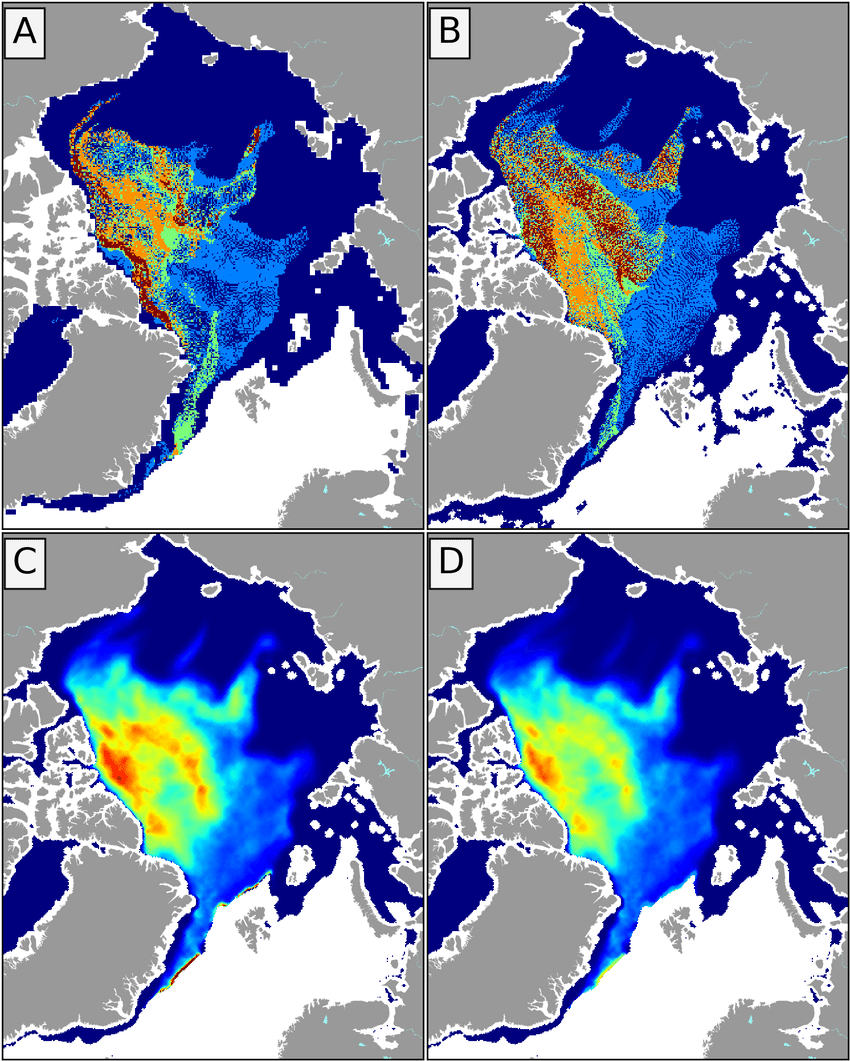
Whilst on the subject of sea ice thickness a related subject is sea ice age. Here’s a new paper on that topic:
“A new tracking algorithm for sea ice age distribution estimation”
Note that these assorted sea ice age maps are all for January 1st 2016!
Watch this space!