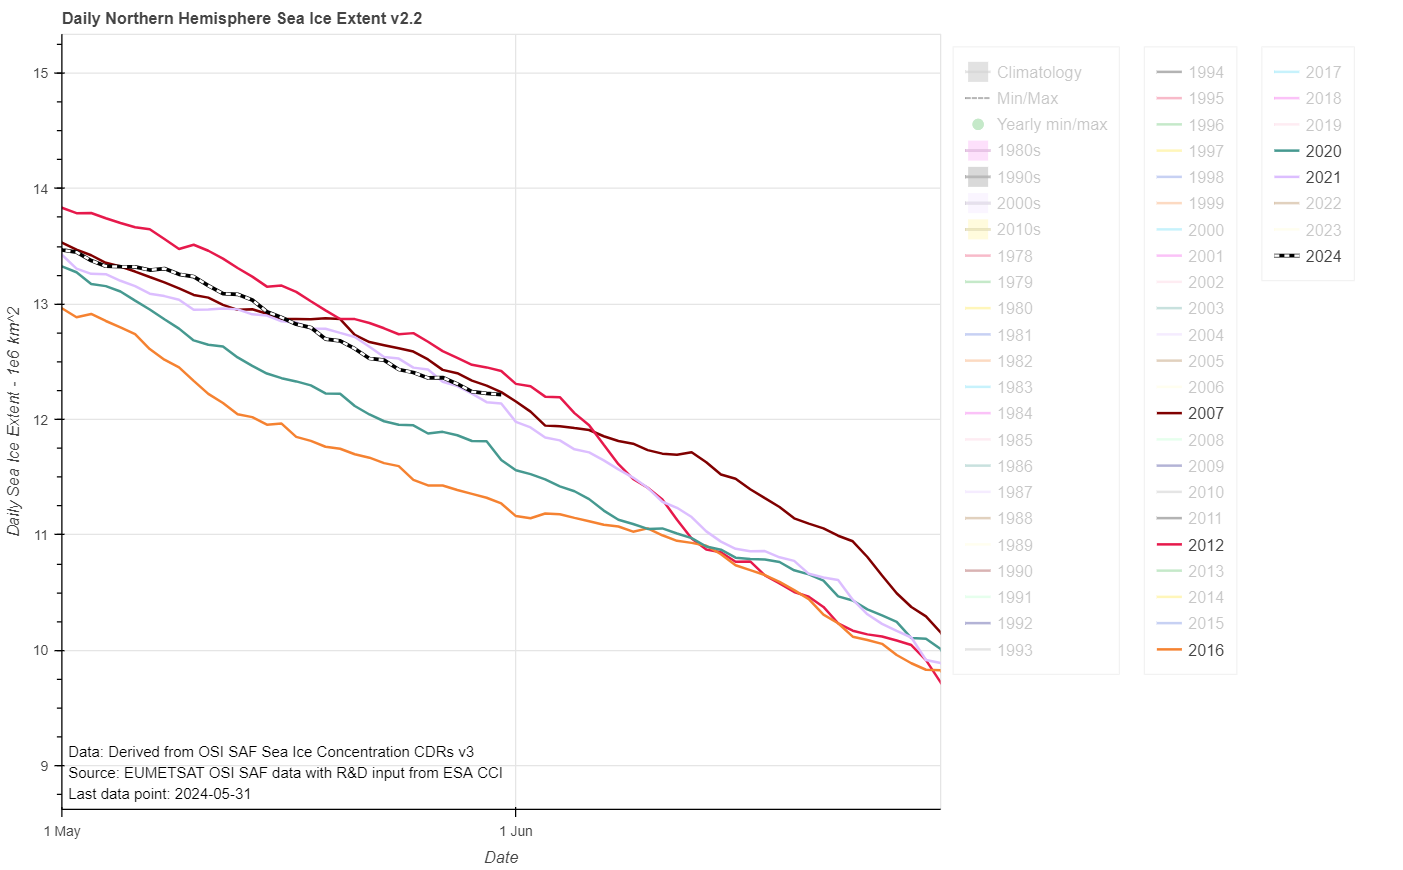
The JAXA/ViSHOP web site is currently down, so here is the current OSI SAF extent graph for the end of May:
2012’s “June cliff” is almost upon us, and if 2024’s current trajectory continues extent will cross above 2012 for the first time since February in a week or so.
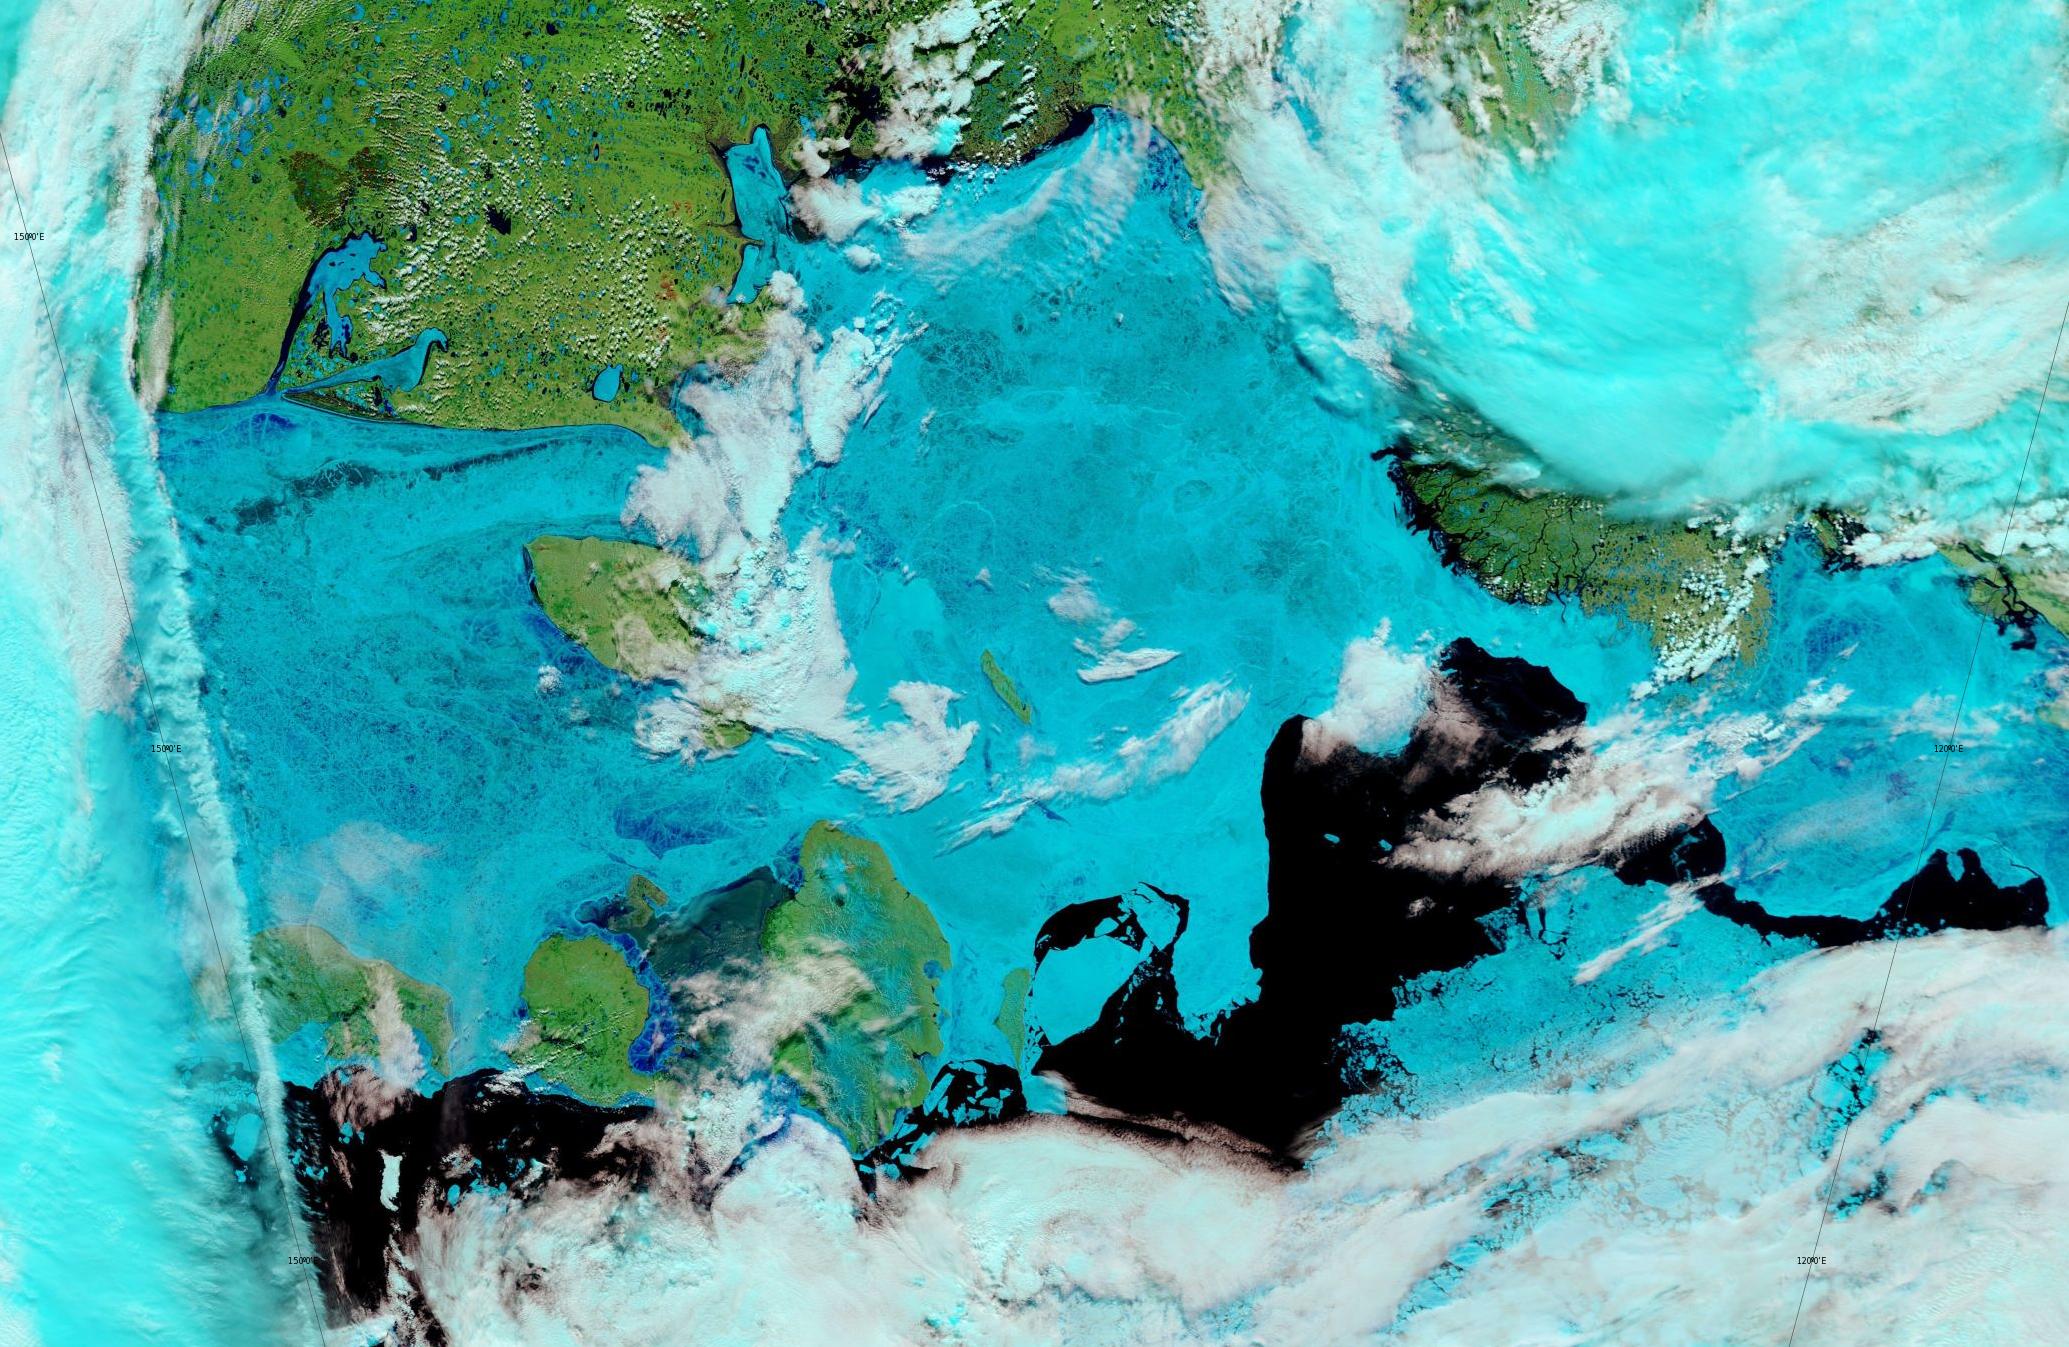
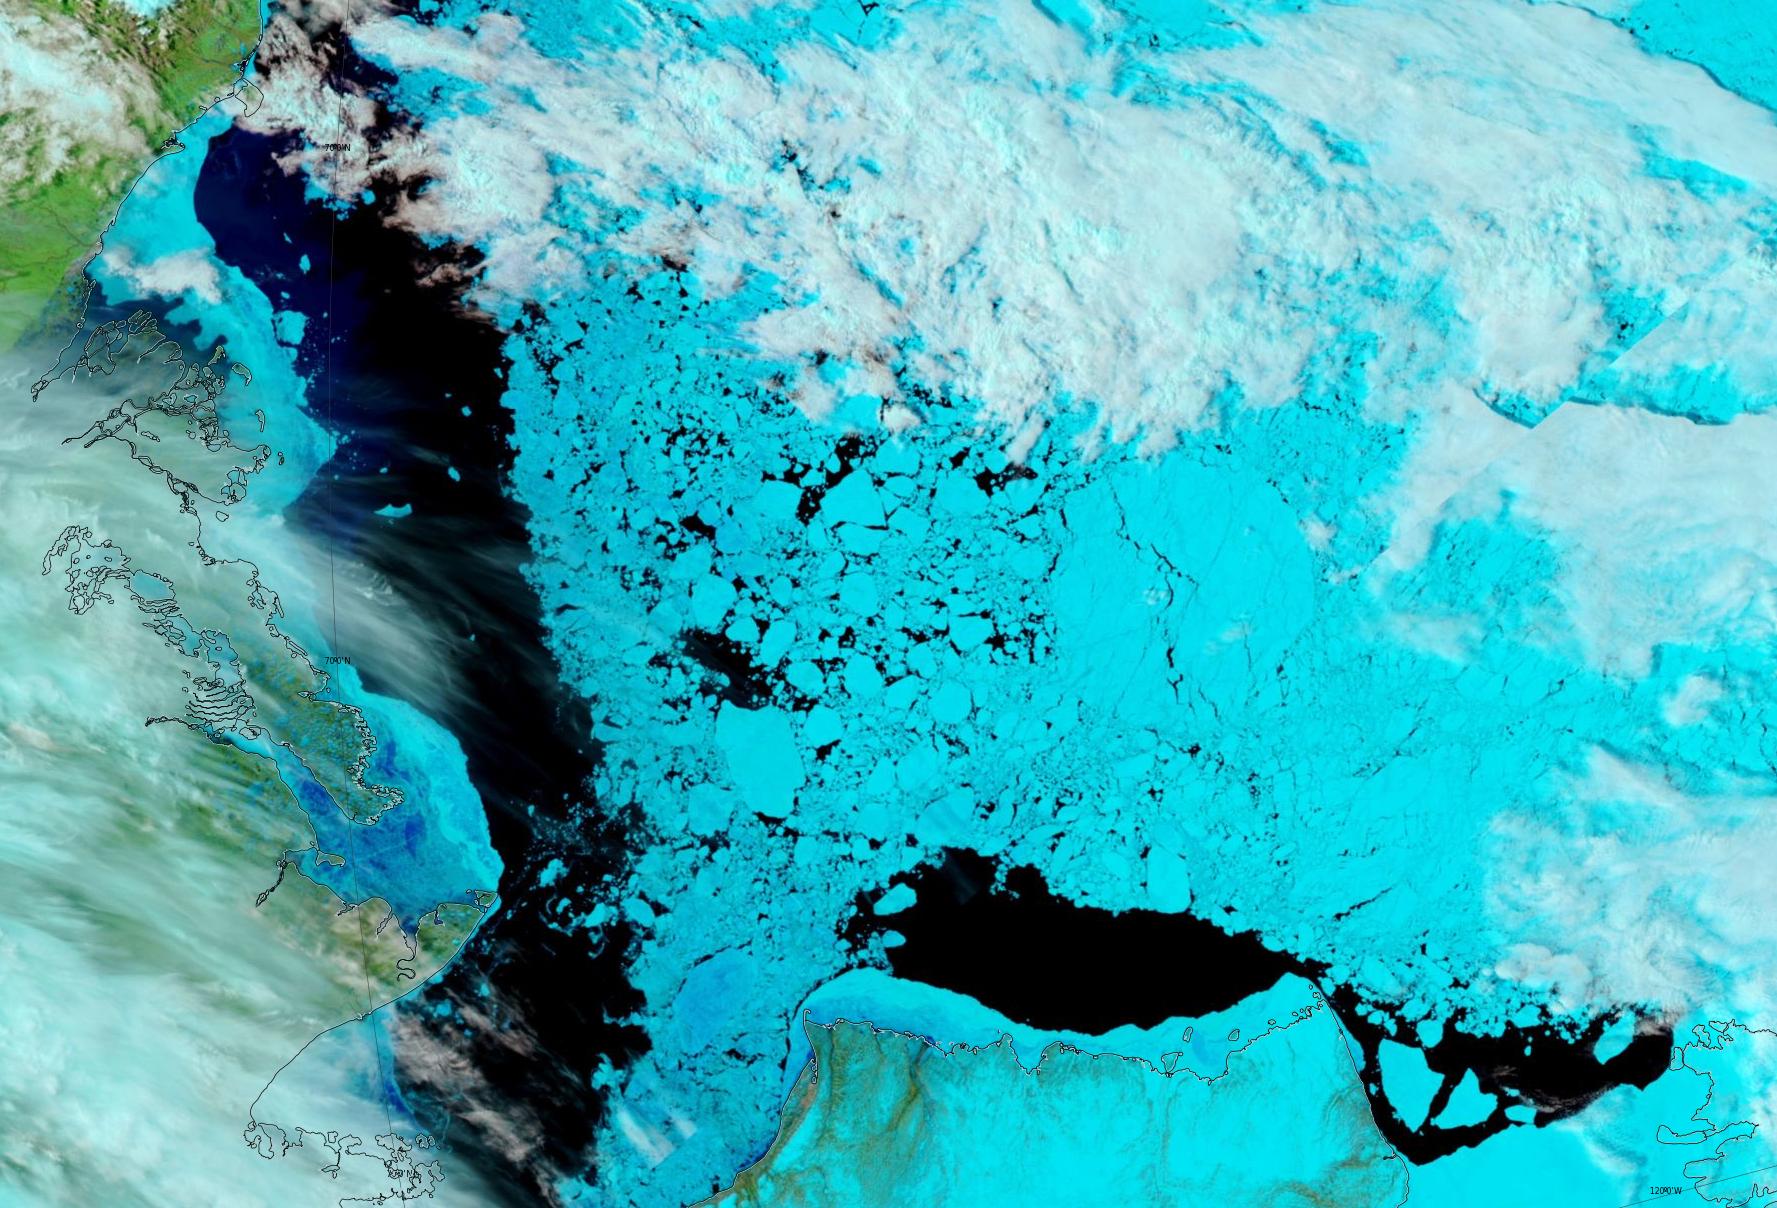
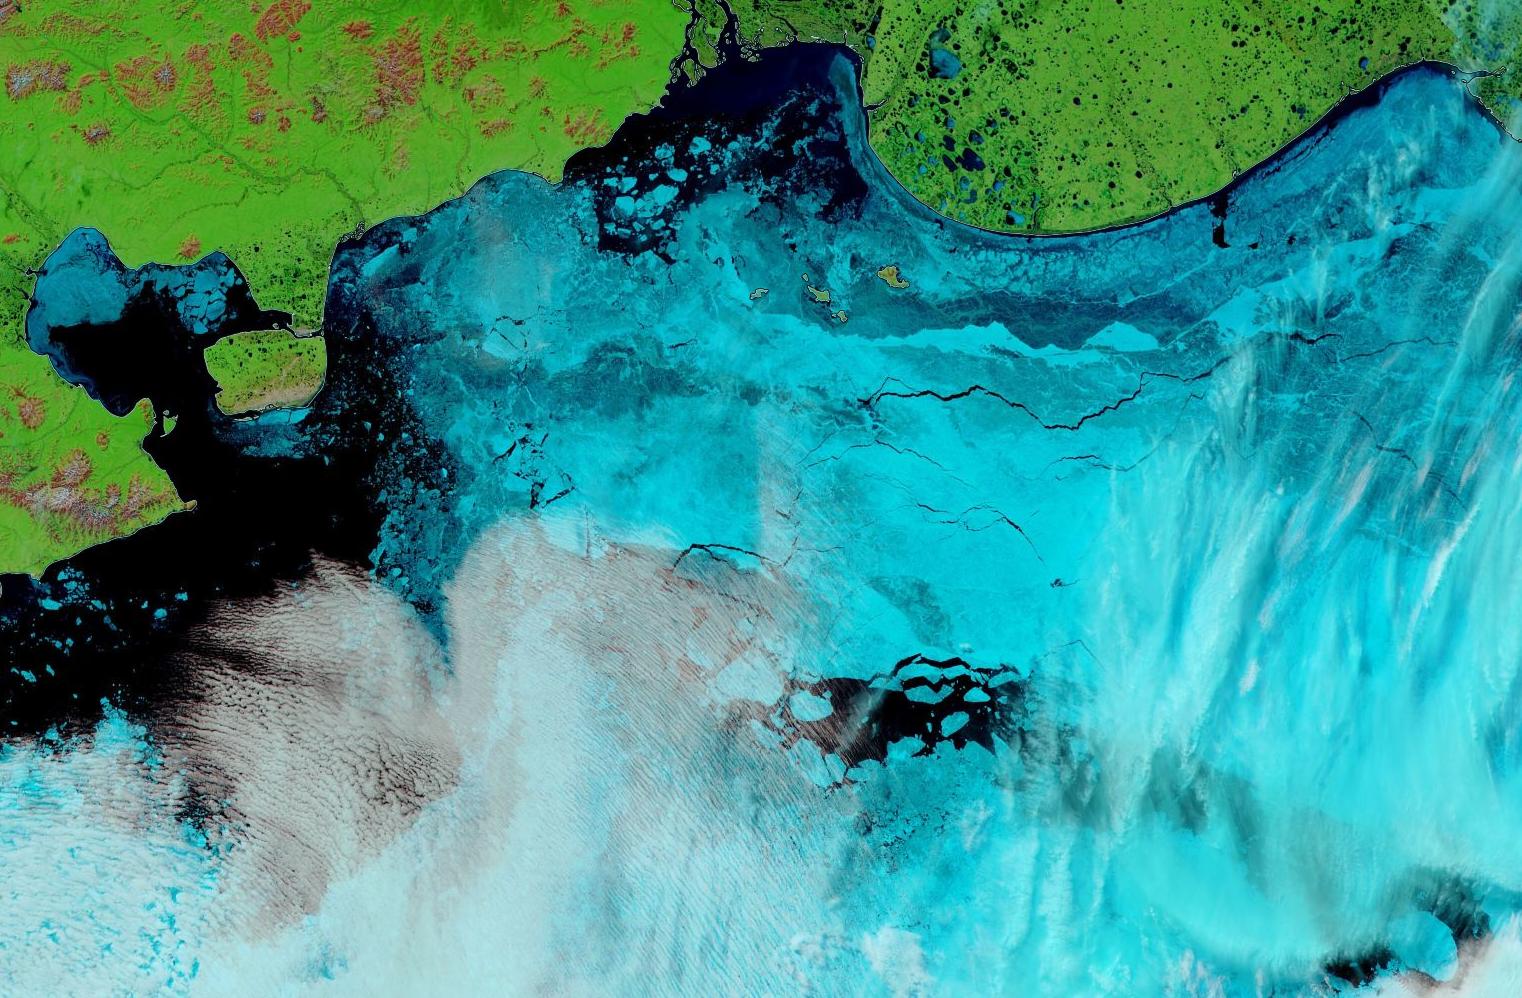
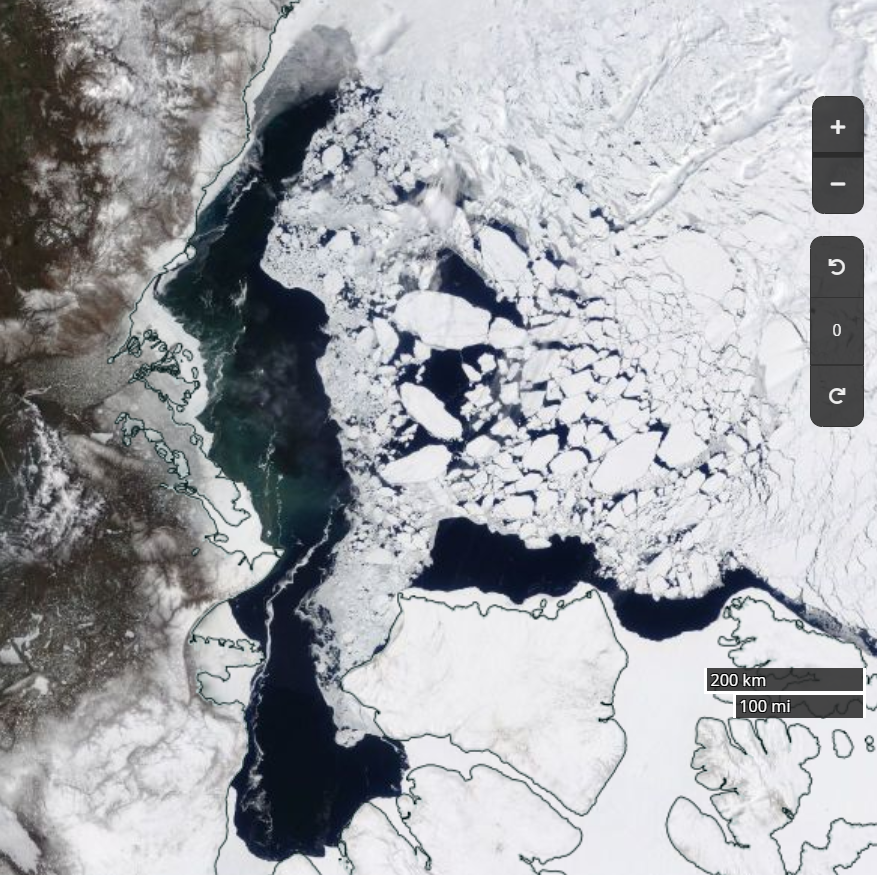
Let’s begin the month with a “true colour” image from the Terra satellite of the Laptev Sea and thereabouts:
The blueish tinge indicates the appearance of melt ponds almost everywhere over the land-fast ice currently covering the majority of the Laptev Sea.
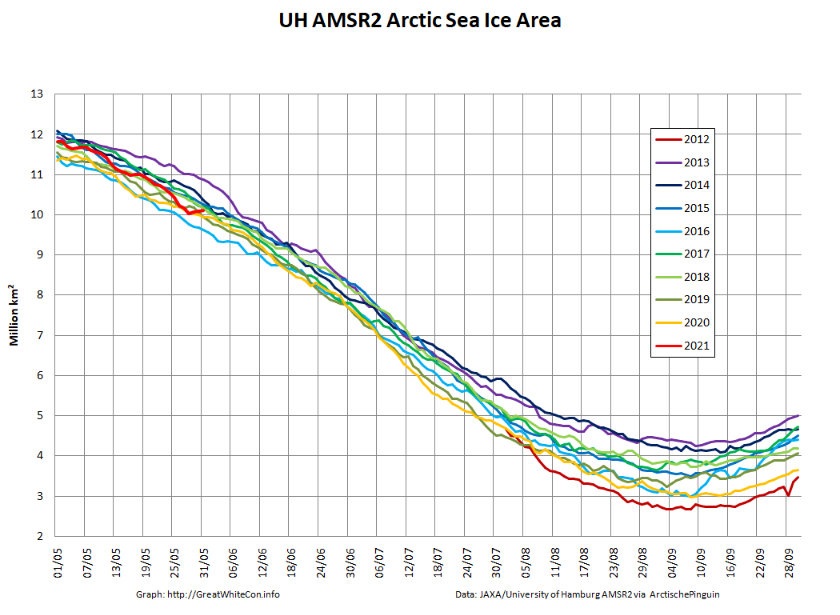
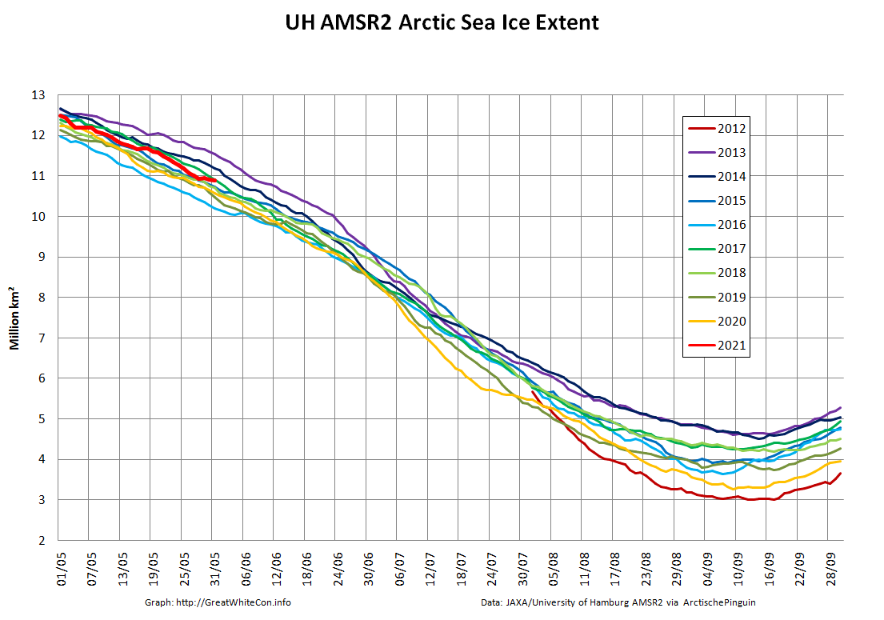
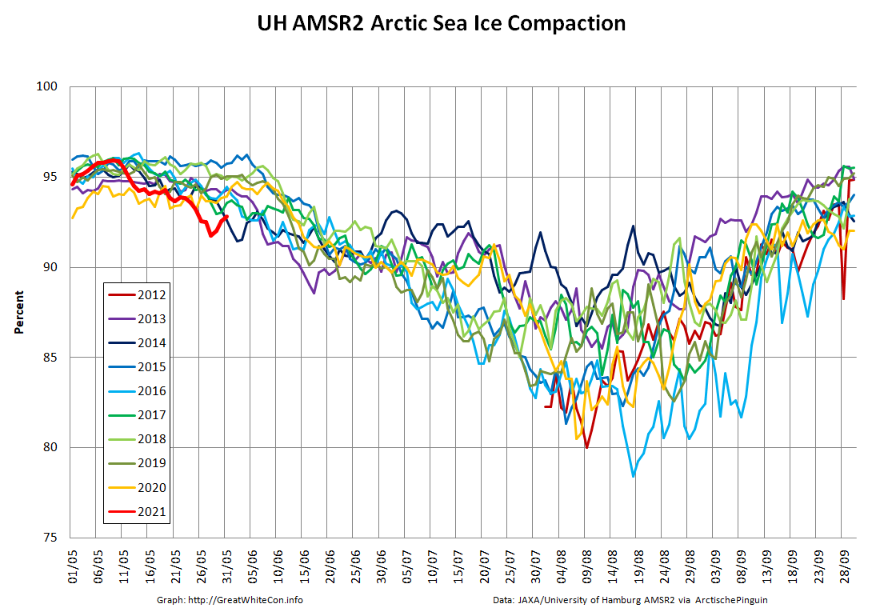
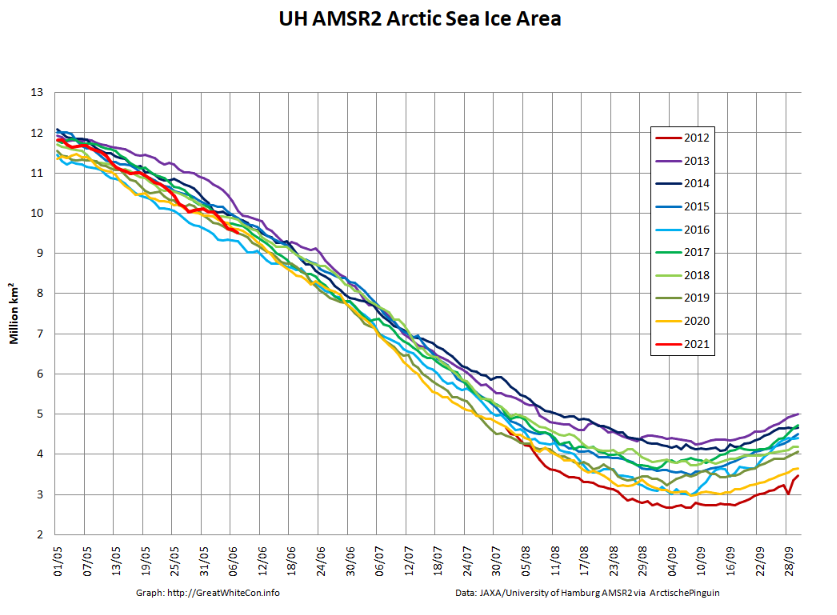
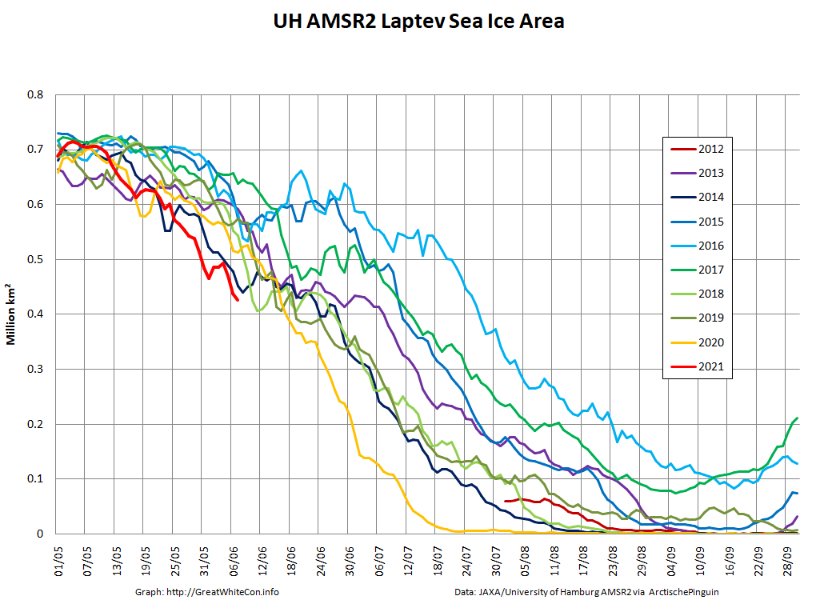
Let’s also take a look at the high resolution AMSR2 metrics for the end of May 2021:
Thanks to the recent “brief hiatus” in areal decline, Arctic wide compaction is no longer in record territory:
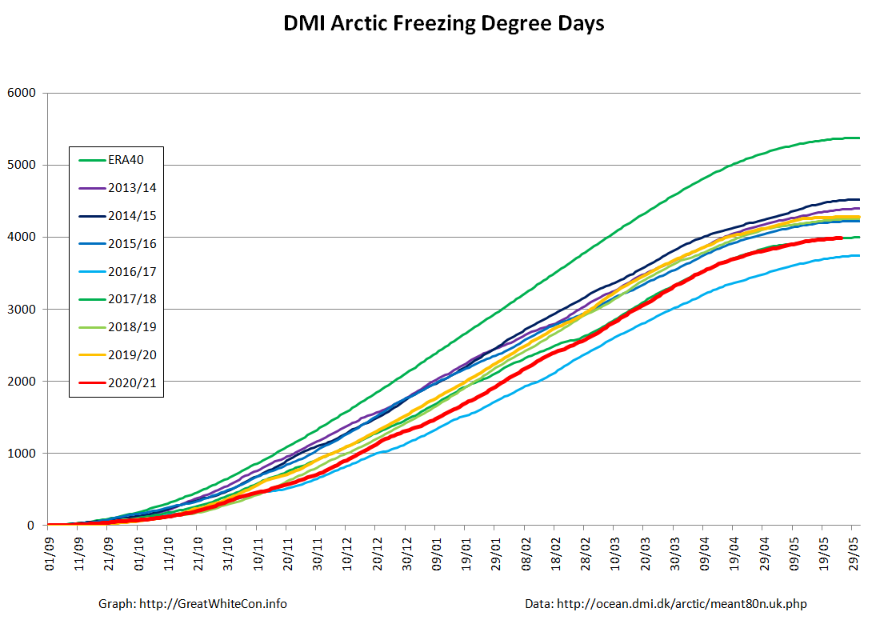
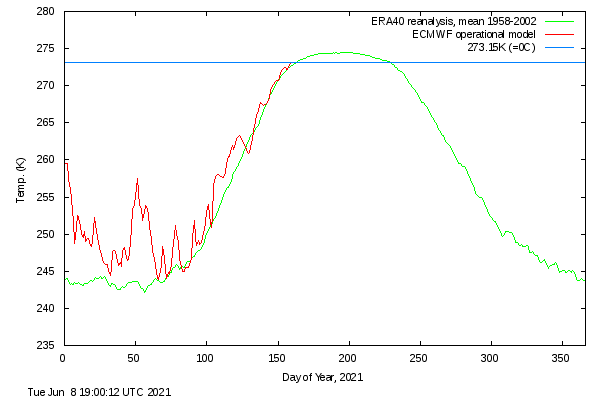
Finally, for the moment at least, here is the Danish Meteorological Institute’s high Arctic temperature data in the form of a graph of freezing degree days:
For some reason the data file still doesn’t include data to the end of May, but things won’t change much by then. Over the winter as a whole only 2016/17 was significantly warmer.
Let the 2021 Arctic sea ice summer melting season officially begin!
[Edit – June 4th]
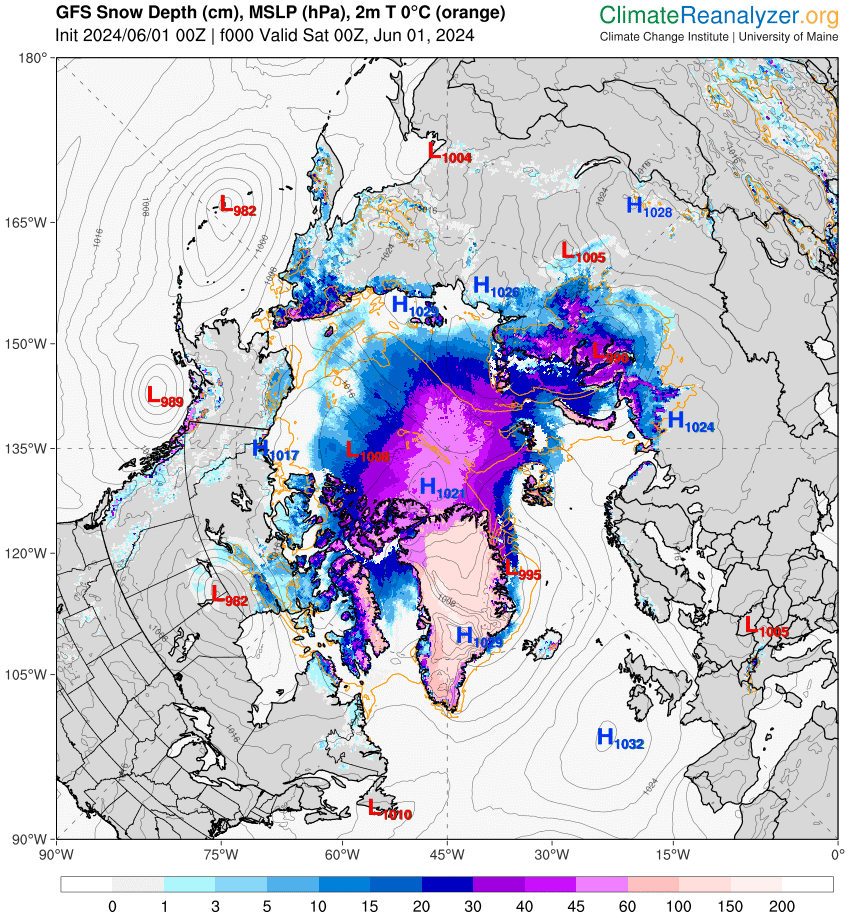
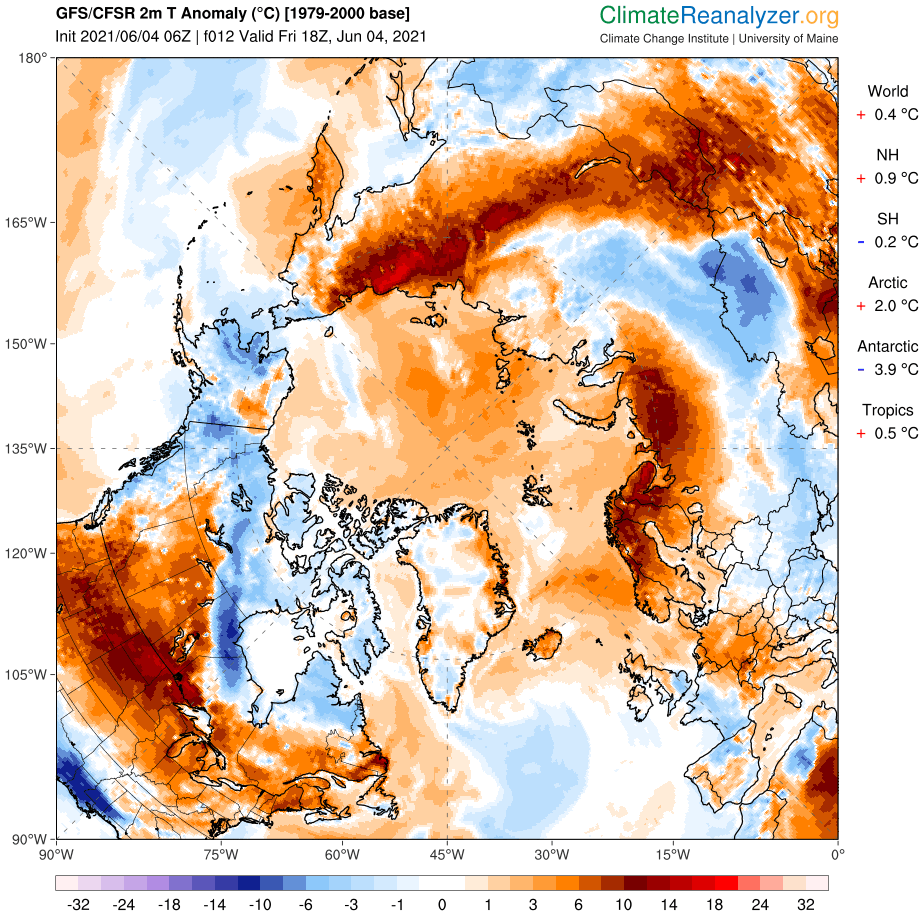
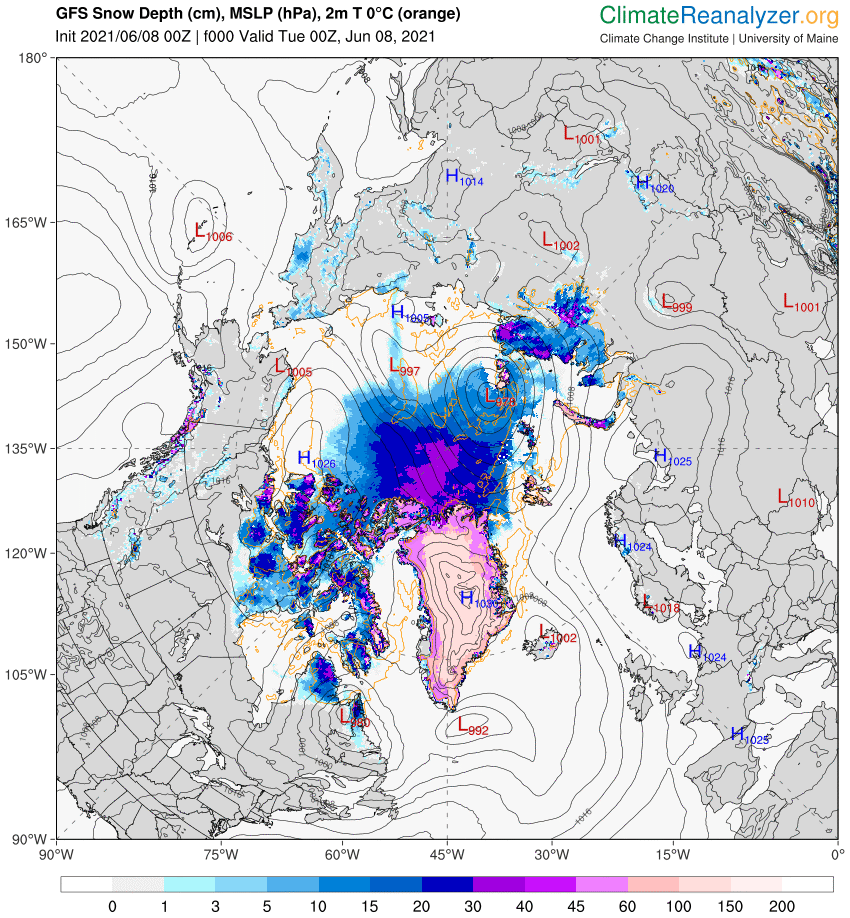
Perhaps unsurprisingly the GFS forecast from four days ago hasn’t quite worked out as predicted. The Arctic as a whole is certainly on the warm side, with a +2 C anomaly at this moment:
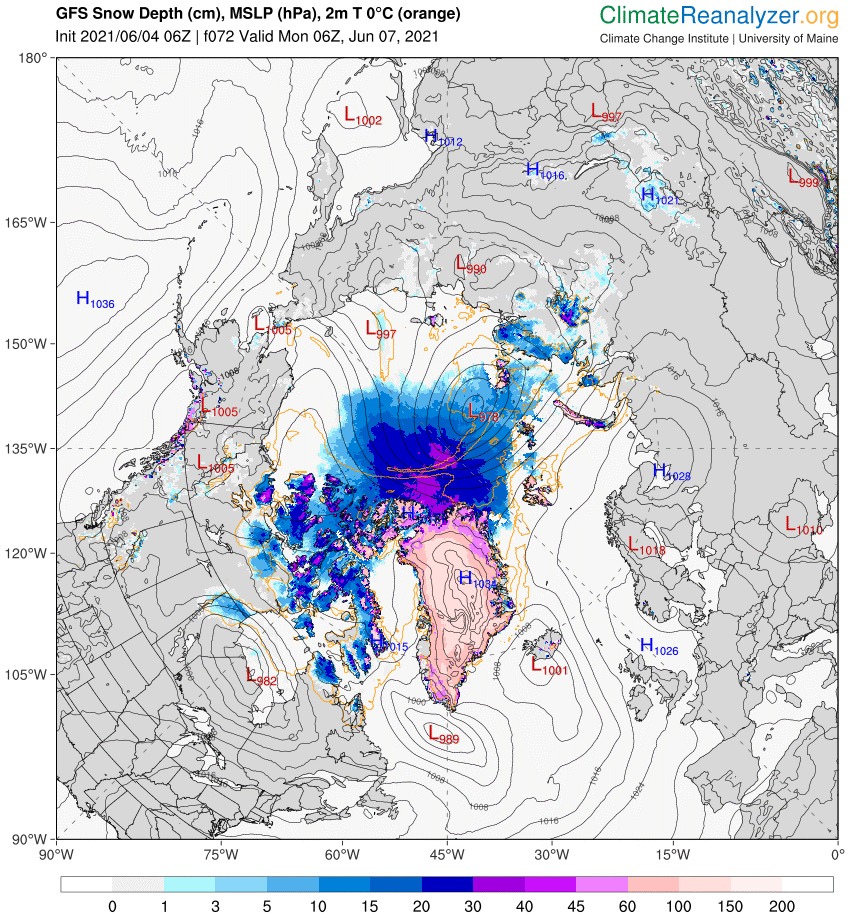
However the 966 hPa MSLP cyclone predicted for Monday is now forecast to be a mere 978 hPa:
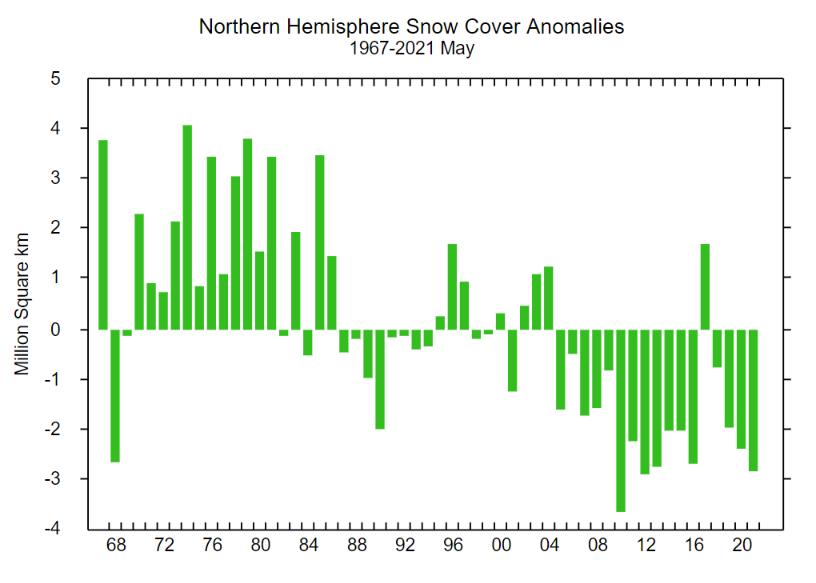
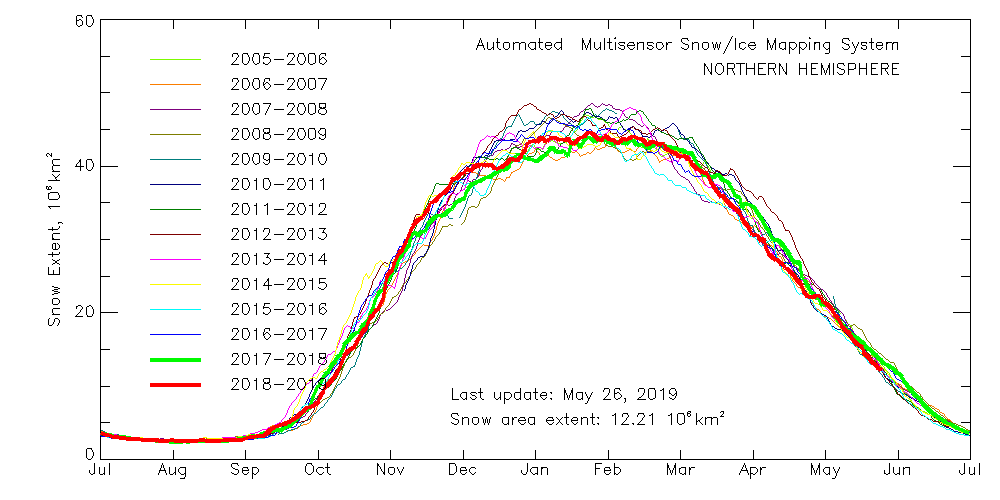
With 3 days to go there is a reasonable chance of it verifying in the “New Arctic” of 2021. As you can see from the map above a large area of the Central Arctic has now lost its snow cover. This is confirmed by the Rutgers Snow Lab northern hemisphere data for May:
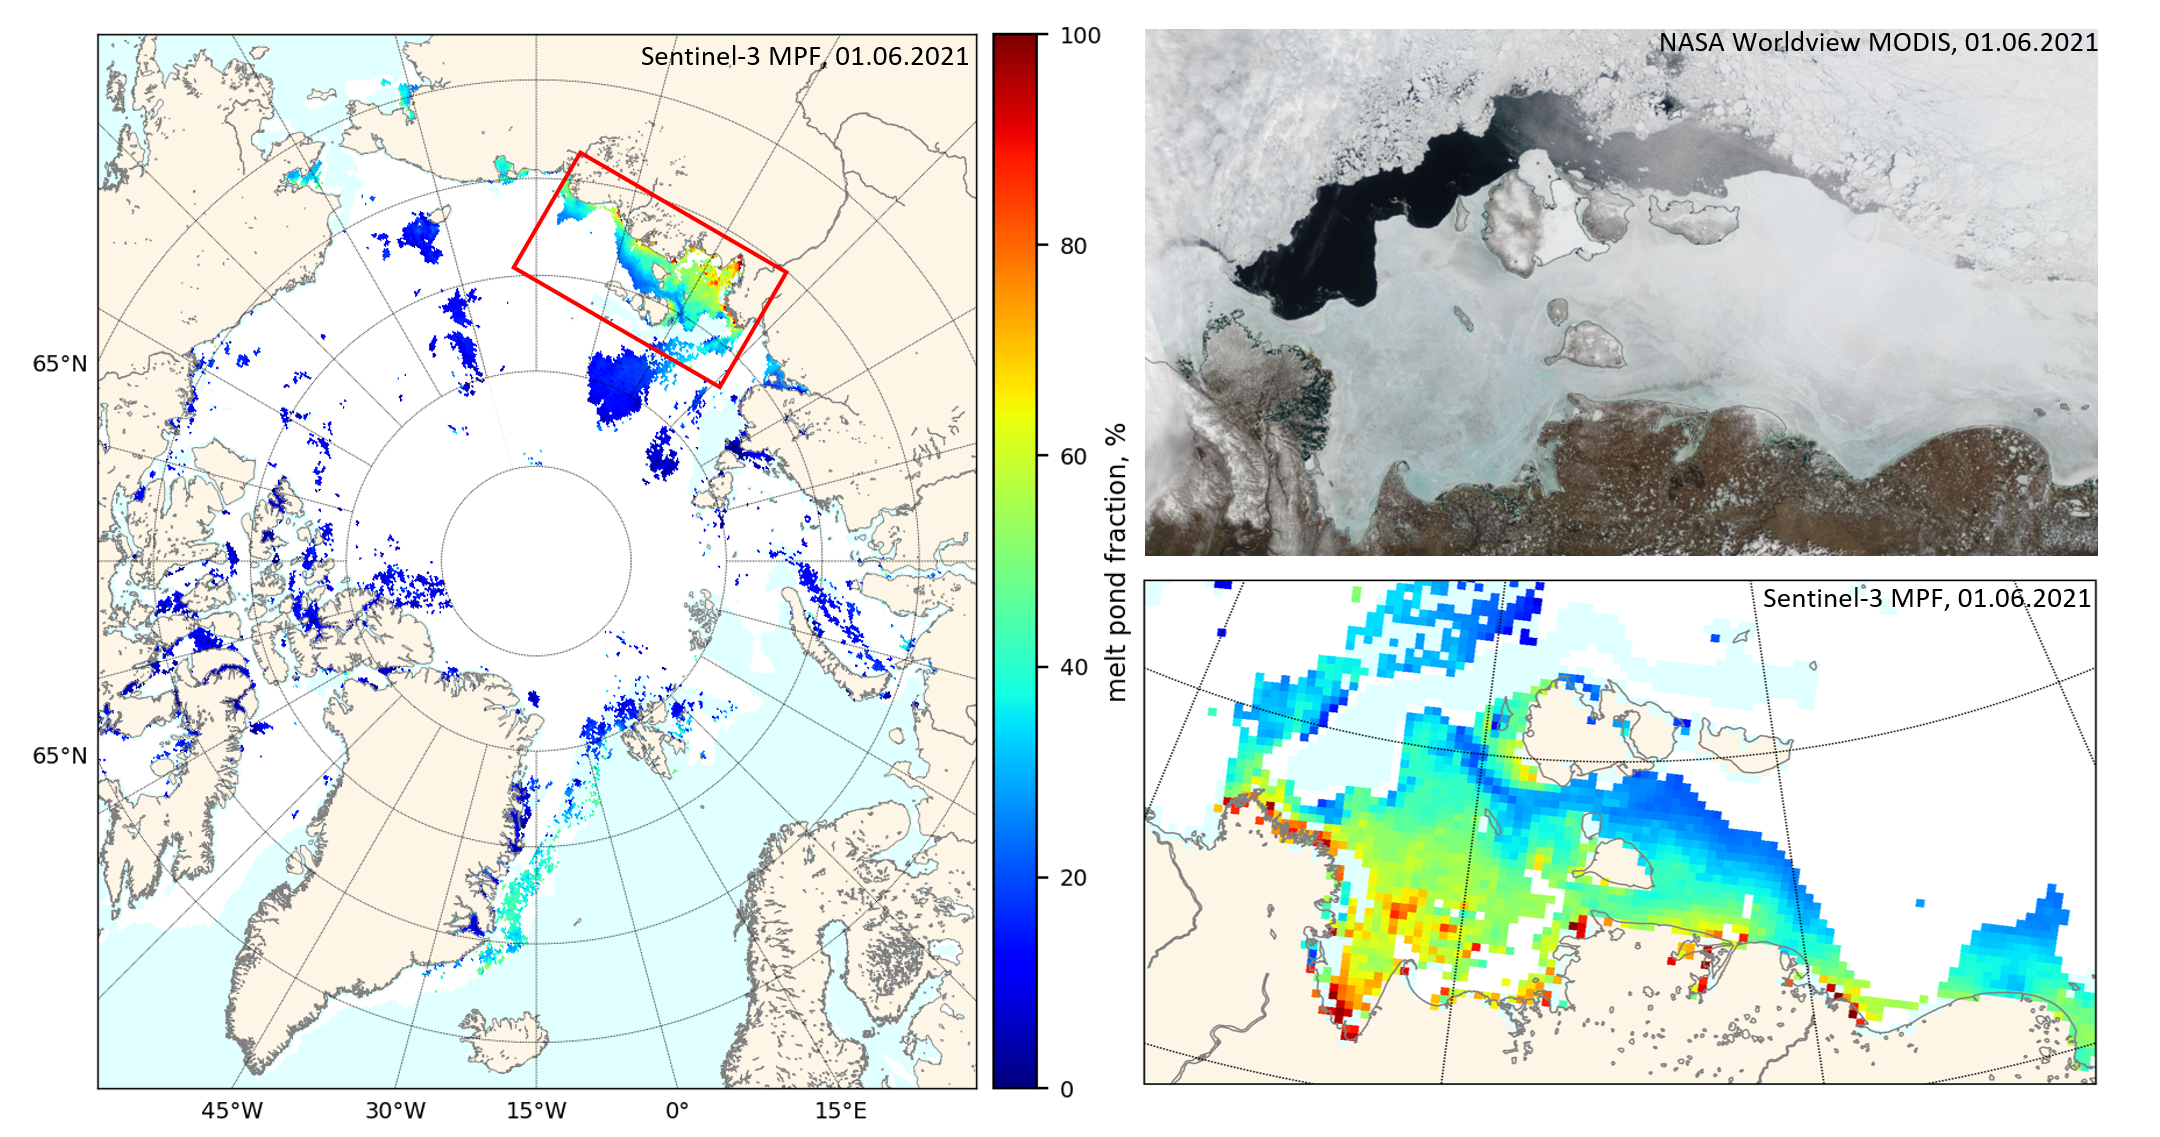
A new Sentinel 3 melt pond fraction product from the University of Bremen confirms that on the fast ice in the Laptev & East Siberian Seas snow cover has departed and melt ponds have arrived:
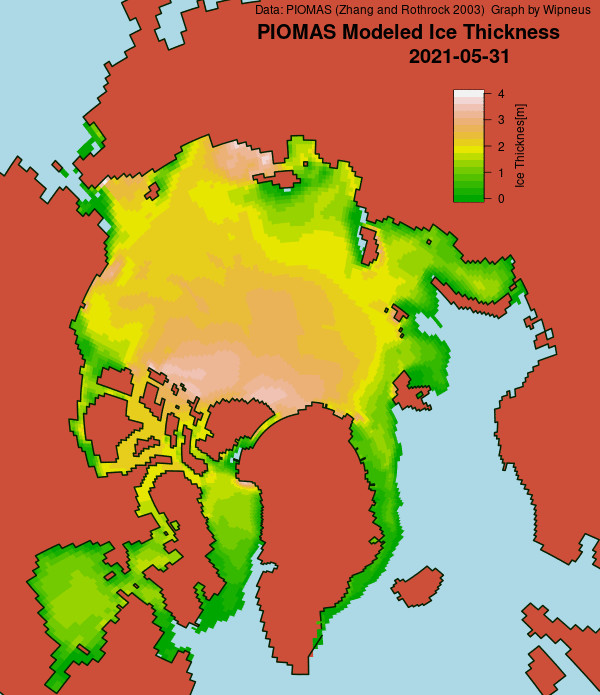
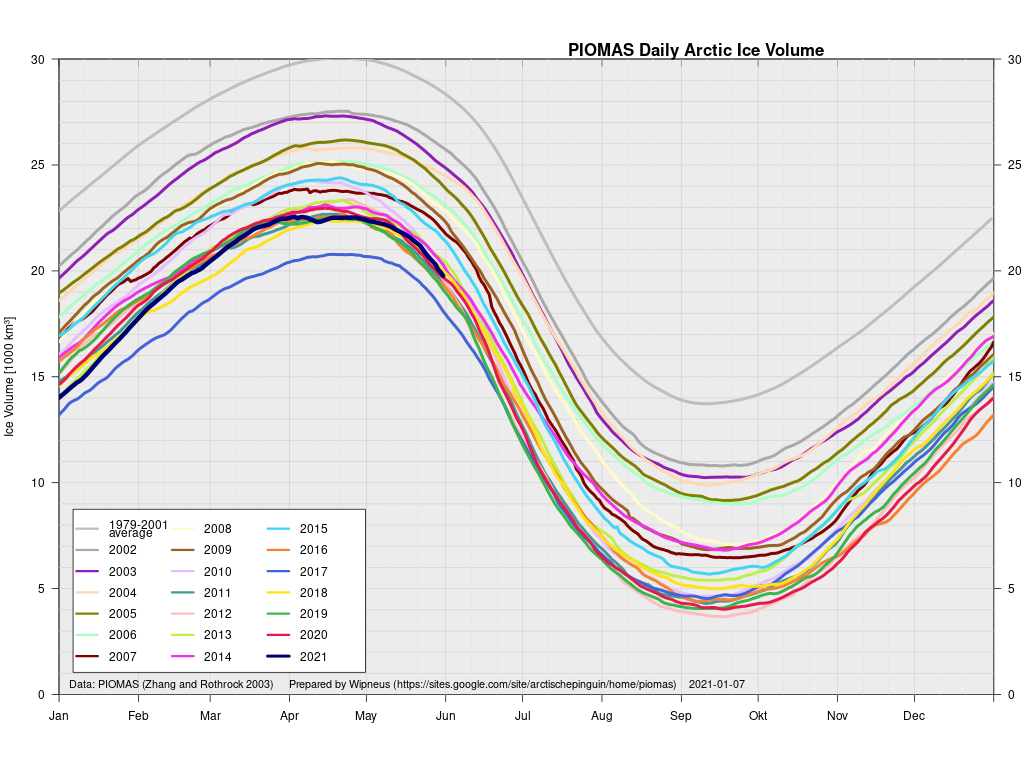
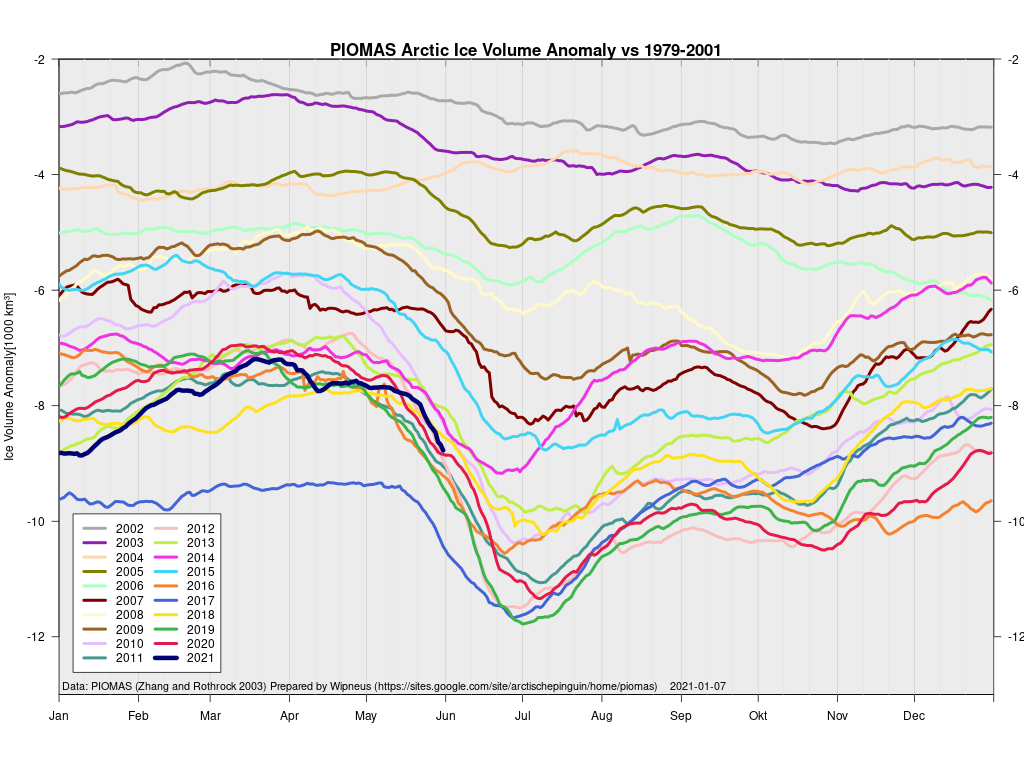
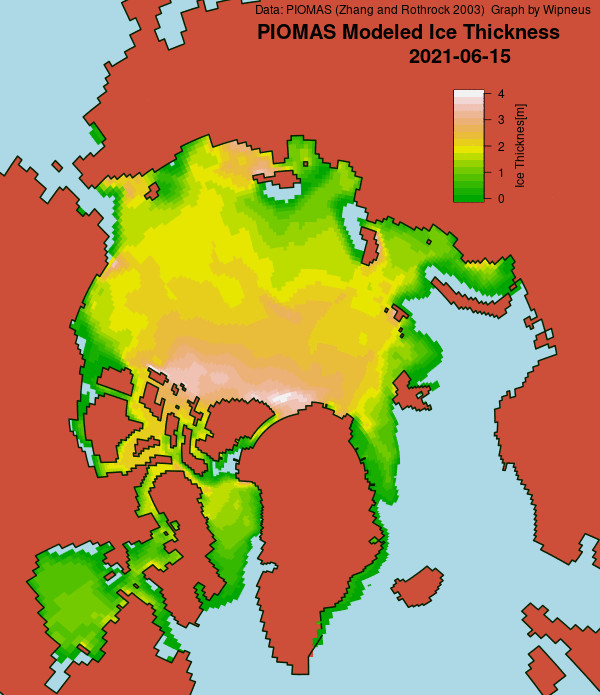
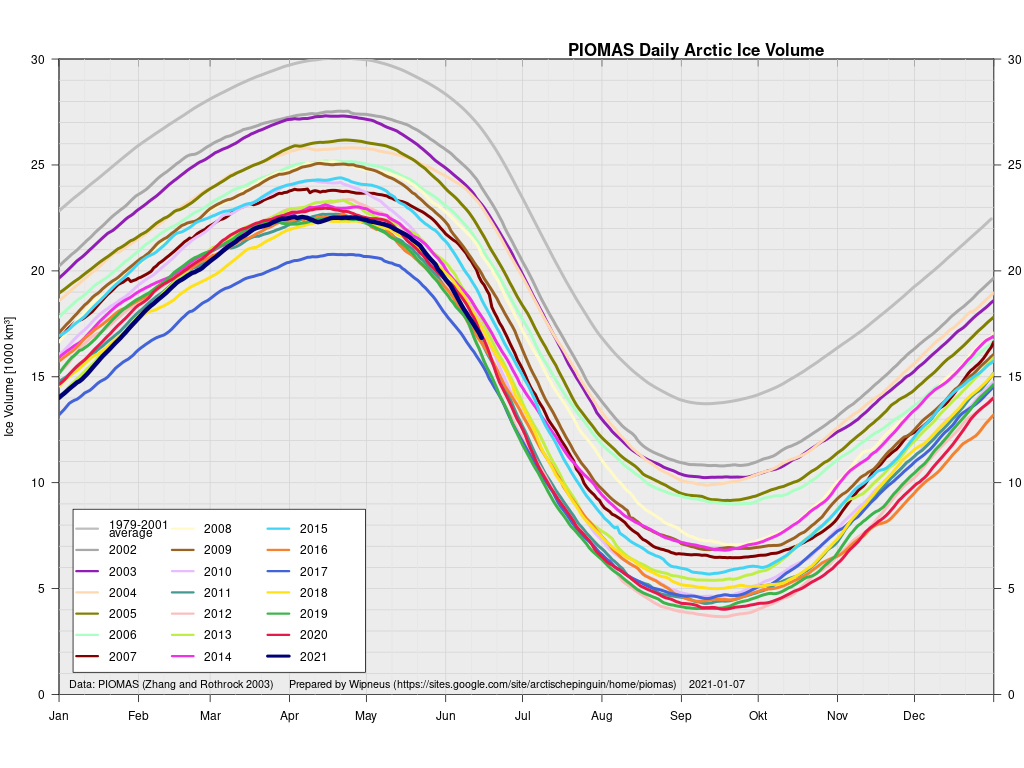
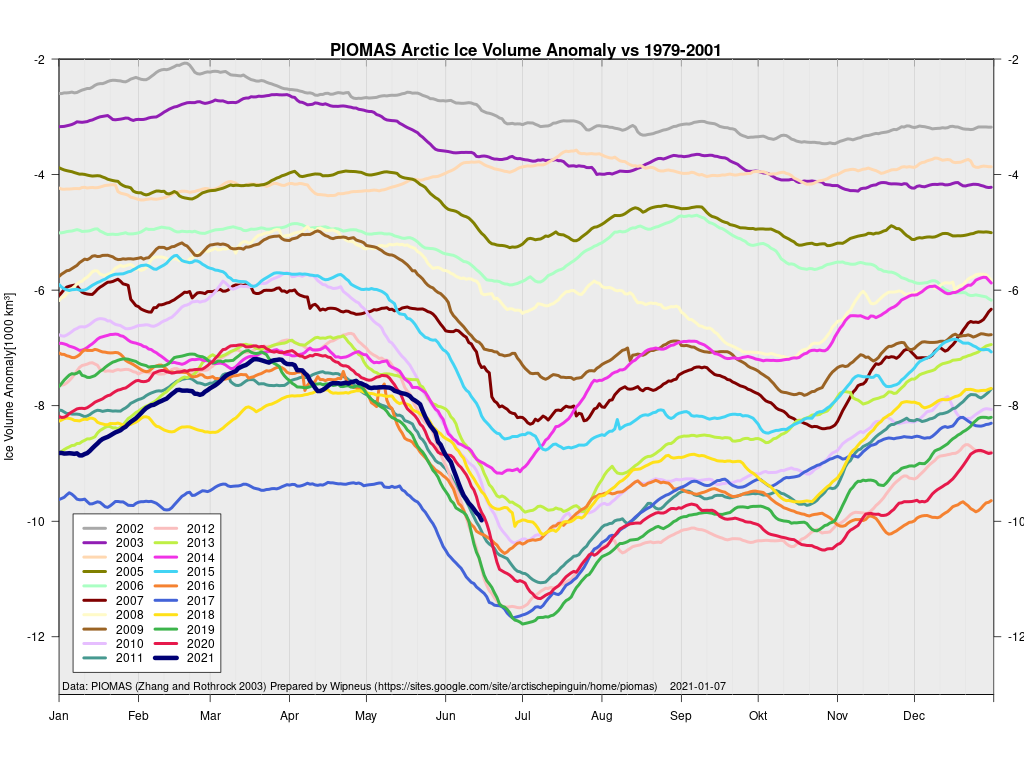
In other news Wipneus has released the latest PIOMAS gridded thickness and volume data on the Arctic Sea Ice Forum:
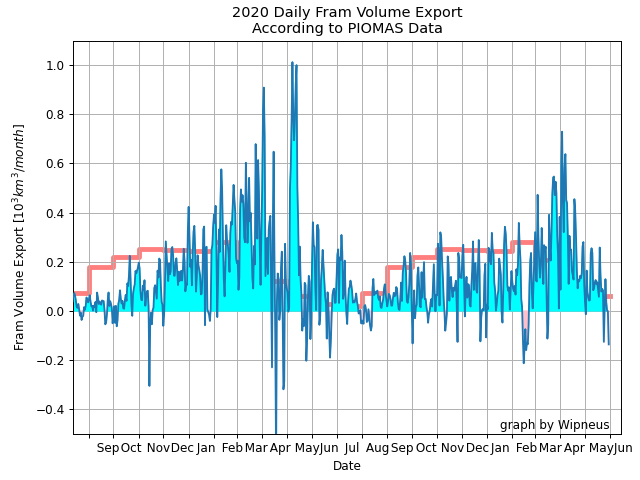
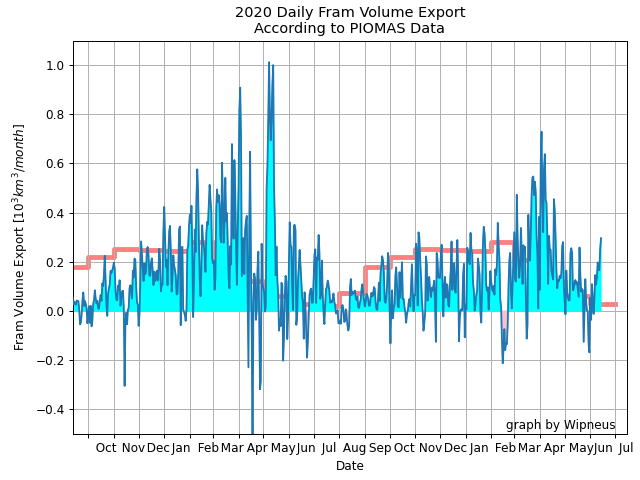
For some strange reason 2021 volume at the end of May is almost identical to 2012 and 2020! Plus of course there’s the modelled volume export from the Central Arctic via the Fram Strait:
[Edit – June 6th]
This “false colour” image reveals that there’s virtually no snow cover left on land, and this “false colour” image reveals that the land-fast ice in the East Siberian Sea is now awash with melt ponds:
[Edit – June 8th]
The forecast low pressure area appears to have bottomed out near the Severnaya Zemlya islands with a 978 hPa MSLP:
High resolution AMSR2 Arctic sea ice area is now 2nd lowest for the date after 2016:
Laptev sea ice area is still lowest for the data, and looks as though it will retain that position for a while:
[Edit – June 9th]
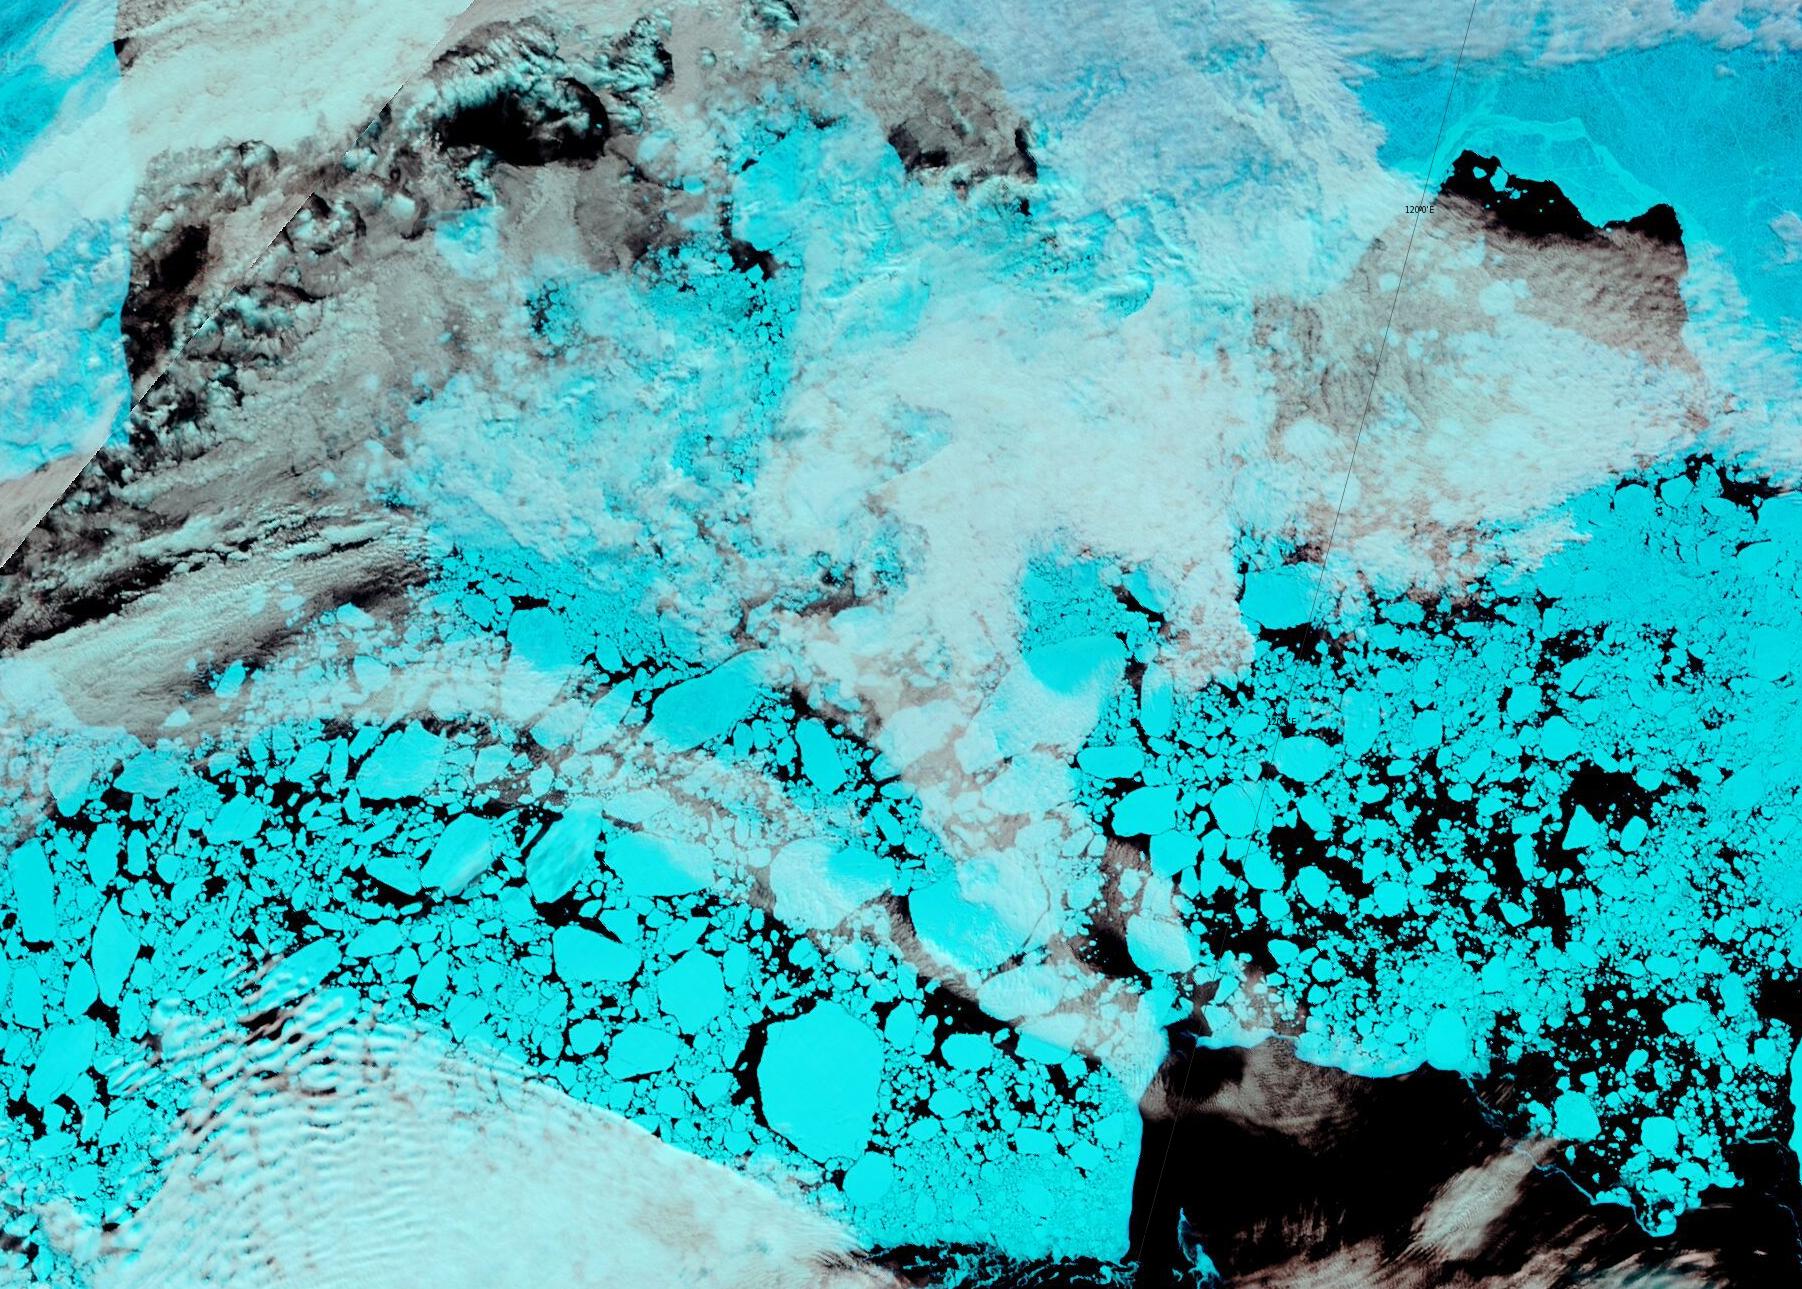
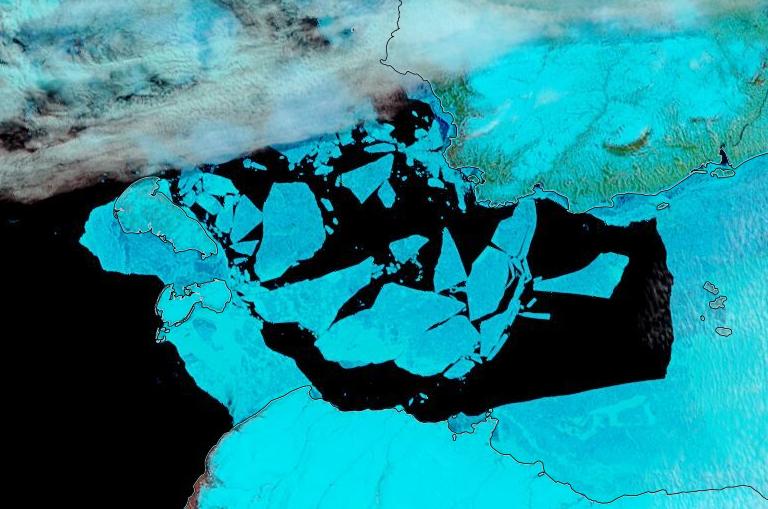
The effect of the recent heat and wind on the remaining sea ice in the Laptev Sea is now all too apparent:
It’s also evident in the DMI >80N temperature graph, which has now reached sea ice “melting point” ahead of the climatology:
Note that the blue line is actually above the “freezing point” of salty Arctic sea water.
[Edit – June 13th]
Fairly clear skies over the Laptev Sea and the western East Siberian Sea, revealing wall to wall melt ponds and the land-fast ice starting to break up near the coast as well as on the edge of the now open ocean:
Plus yesterday’s view of the Beaufort Sea, revealing fast ice breaking up in the western entrance to the McClure Strait:
[Edit – June 18th]
A clearish view of the Laptev Sea today, revealing assorted cracks in a variety of locations:
[Edit – June 20th]
The latest mid-month PIOMAS thickness/volume numbers have been released:
[Edit – June 23rd]
The skies over the Vilkitsky Strait have been cloudy for a few days. However a fairly clear view yesterday reveals that breakup is well under way in what is usually one the last areas along the Northern Sea Route to become navigable:
[Edit – June 26th]
The land-fast ice in the East Siberian Sea has started to disintegrate en masse:
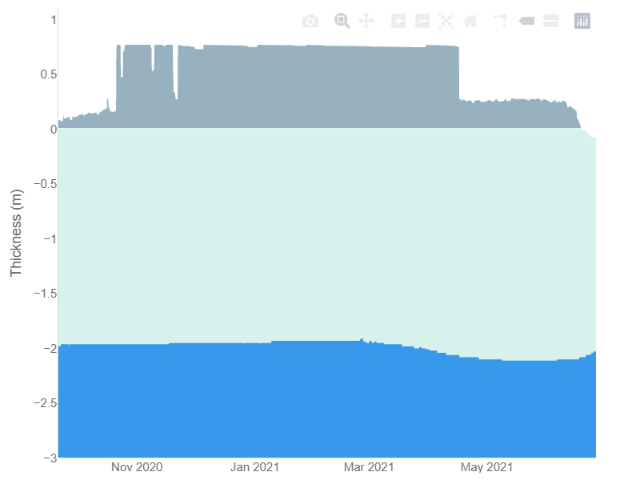
Data from ice mass balance buoy 441910, currently located at 76.1 N, 151.1 W in the Beaufort Sea, reveals the onset of both surface and bottom melt:
Our title today is shamelessly plagiarised from the “Watts Up With That” blog of our old friend Anthony Watts. However daring to be different we have redacted the initial word “Claim -“.
The Last Interglacial (LIG), a warmer period 130,000–116,000 years before present, is a potential analogue for future climate change. Stronger LIG summertime insolation at high northern latitudes drove Arctic land summer temperatures 4–5 °C higher than in the pre-industrial era. Climate model simulations have previously failed to capture these elevated temperatures, possibly because they were unable to correctly capture LIG sea-ice changes. Here, we show that the latest version of the fully coupled UK Hadley Center climate model (HadGEM3) simulates a more accurate Arctic LIG climate, including elevated temperatures. Improved model physics, including a sophisticated sea-ice melt-pond scheme, result in a complete simulated loss of Arctic sea ice in summer during the LIG, which has yet to be simulated in past generations of models. This ice-free Arctic yields a compelling solution to the long-standing puzzle of what drove LIG Arctic warmth and supports a fast retreat of future Arctic summer sea ice.
There’s no mention of “2035” in there, so let’s look instead at yesterday’s press release from the British Antarctic Survey:
A couple of years ago I was asked to provide “a handful of things [you] will be keeping an eye on over the next few months to judge how ‘good’ or ‘bad’ the melt is going?”
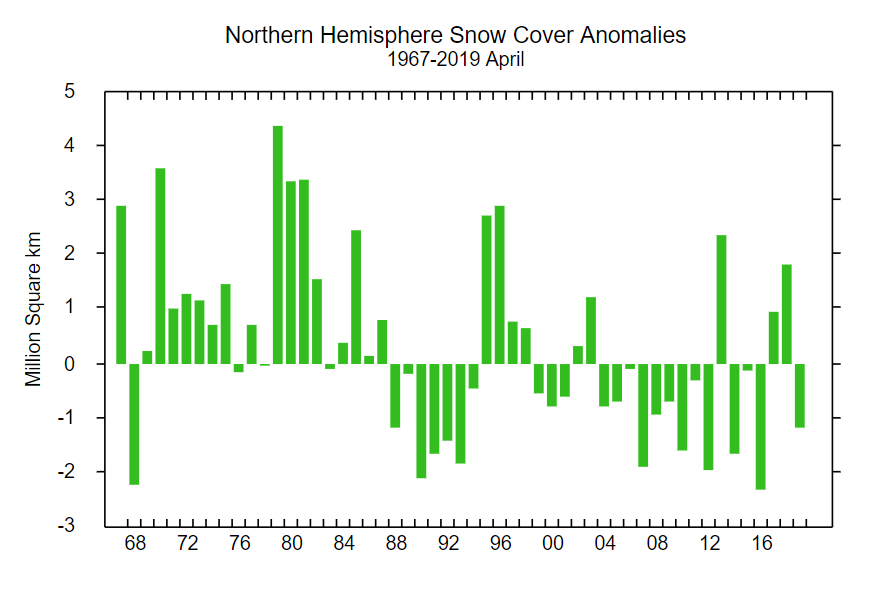
That suggests snow cover over land is close to recent lows, which is confirmed by the Rutgers University snow cover anomaly graph for April:
This year is anomalously low, but not by as much as 2012 and 2016. For completeness, here also is the current US National Ice Center snow cover map:
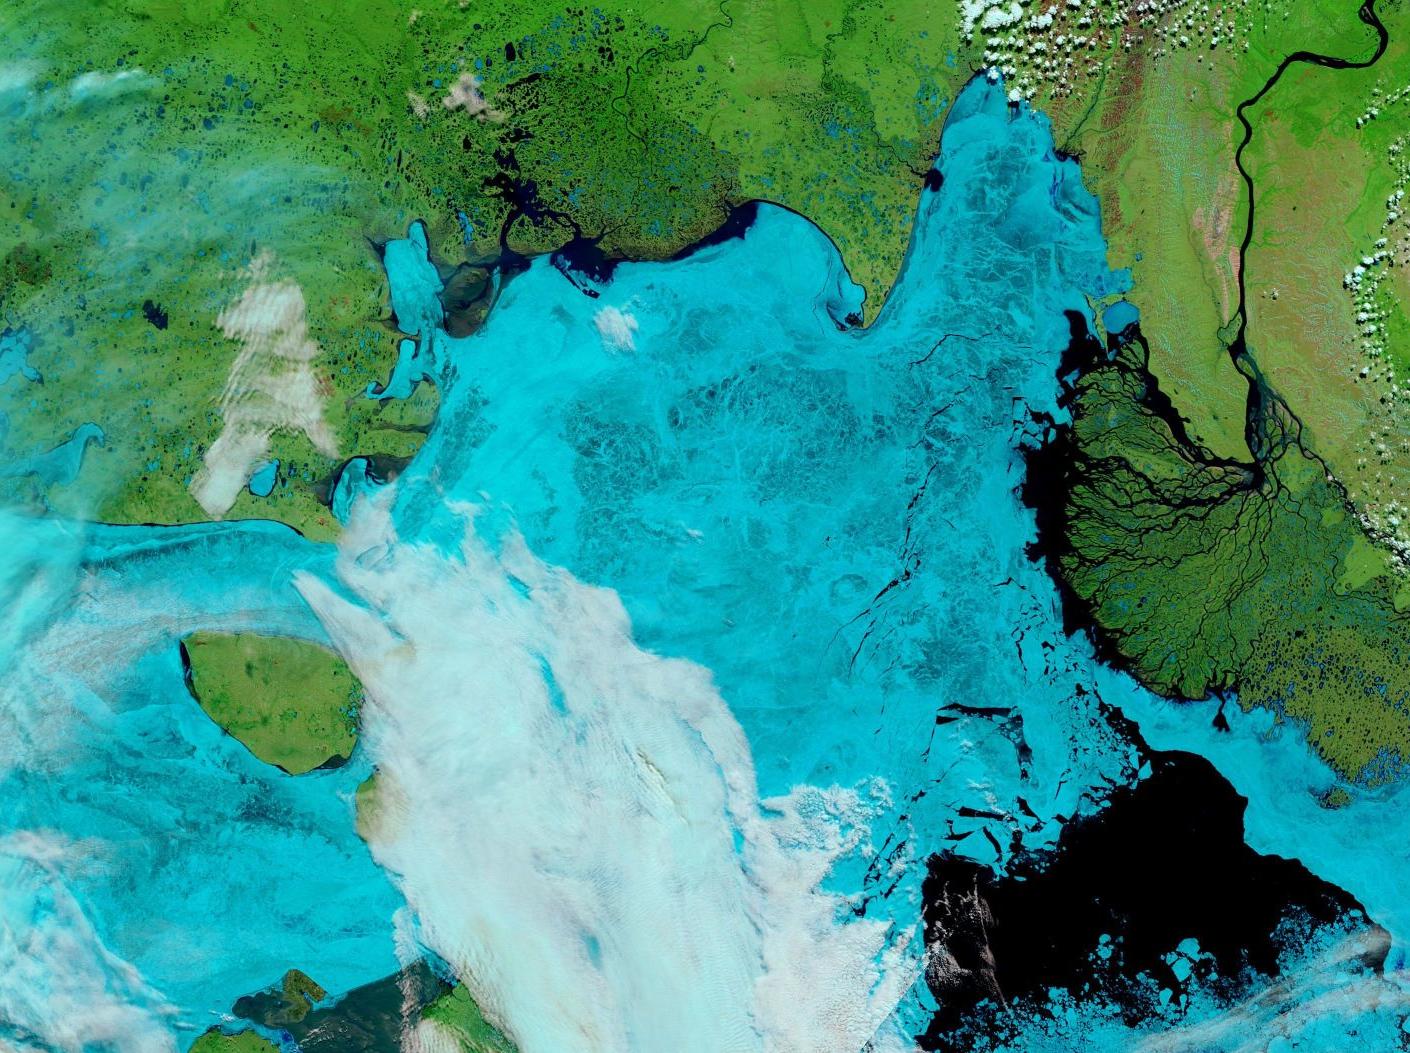
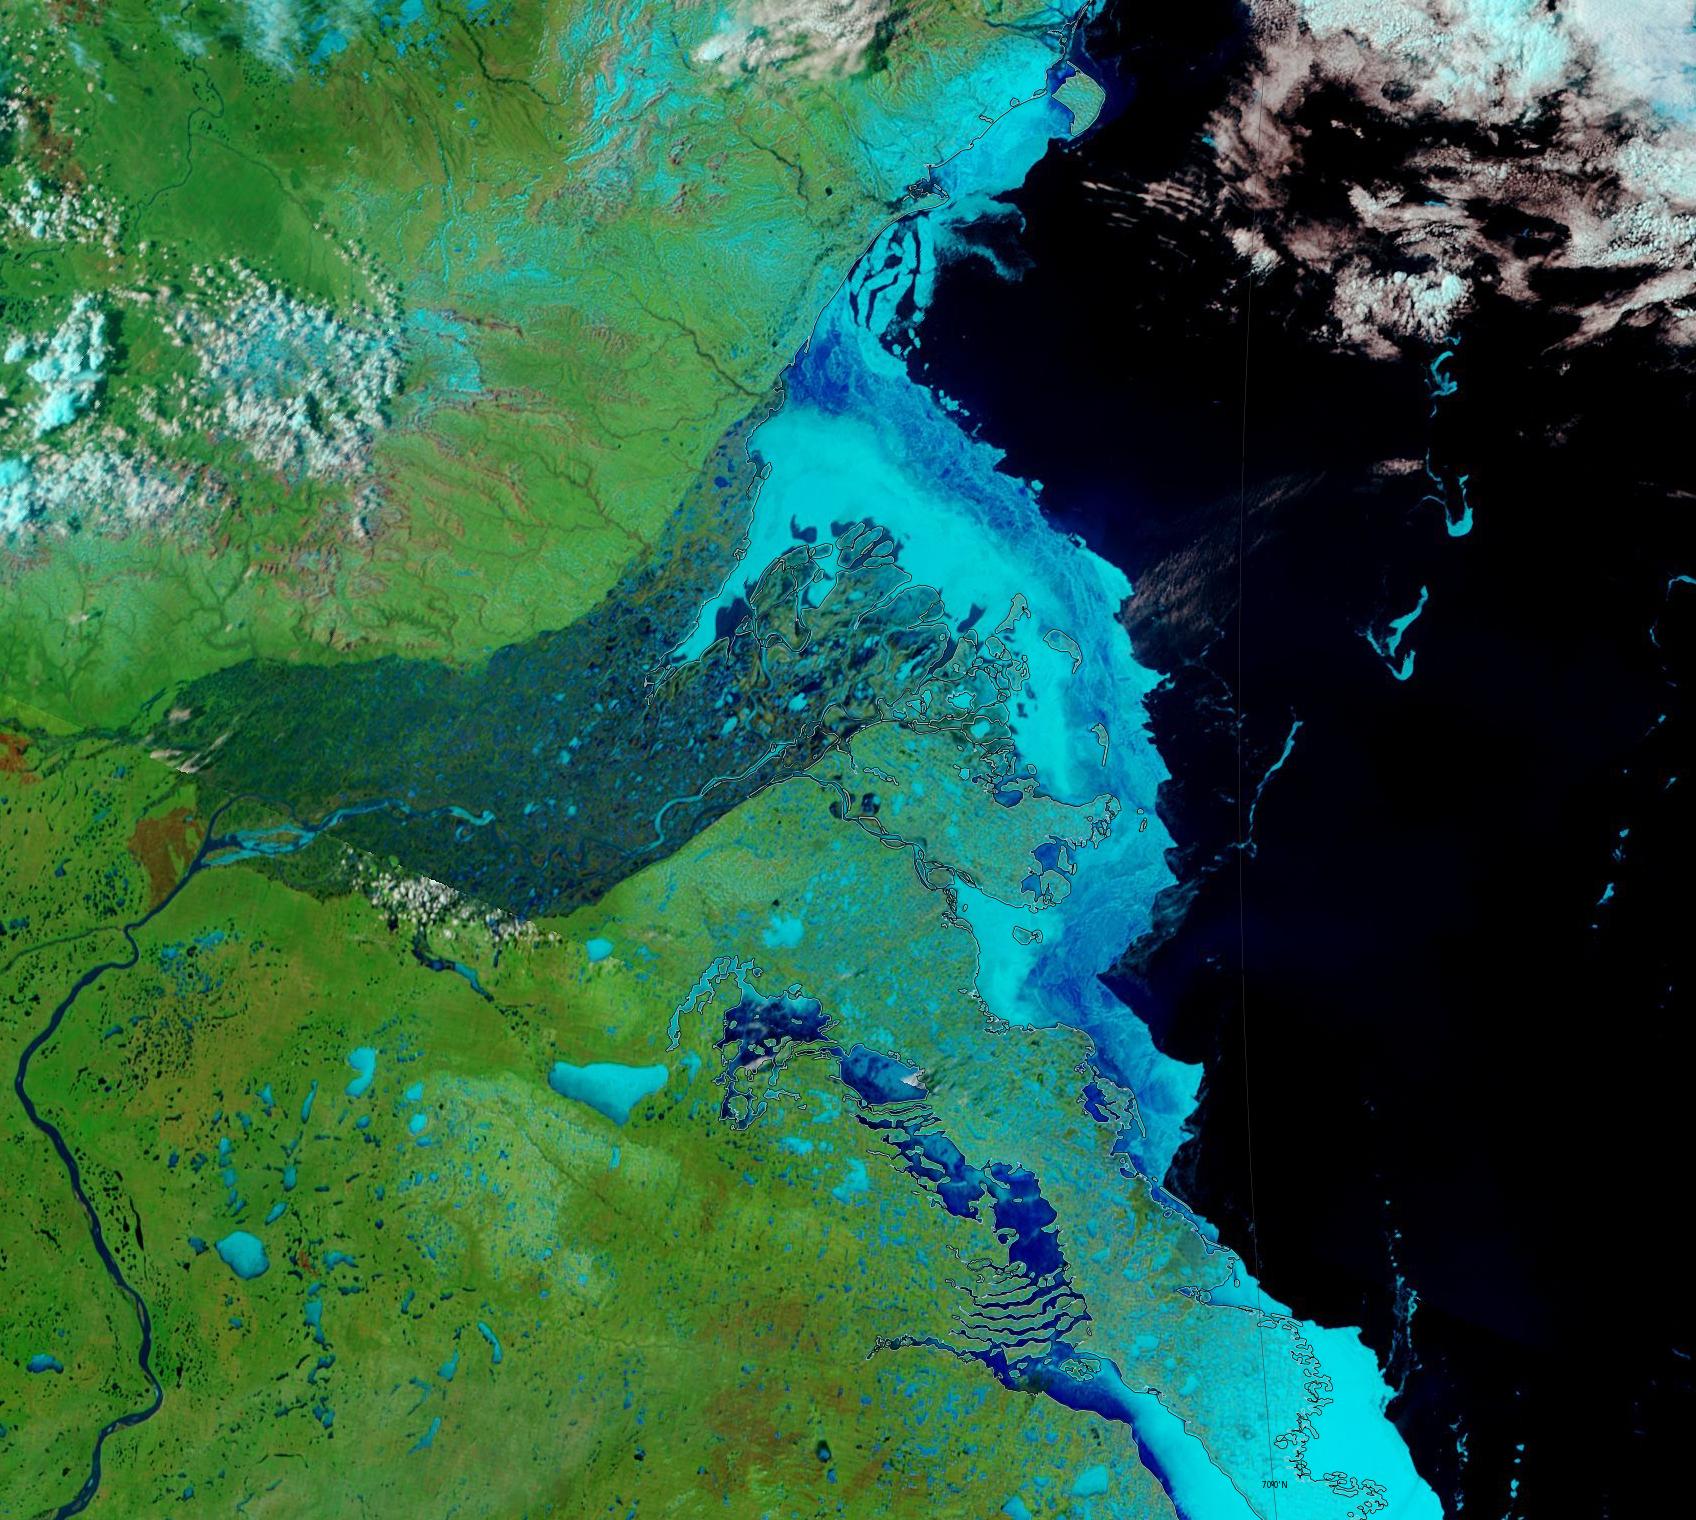
Moving on to melt ponds, there are plenty to be seen on the fast ice around the Mackenzie river delta:
NASA Worldview “false-color” image of the Mackenzie Delta on May 24th 2019, derived from the MODIS sensor on the Terra satellite
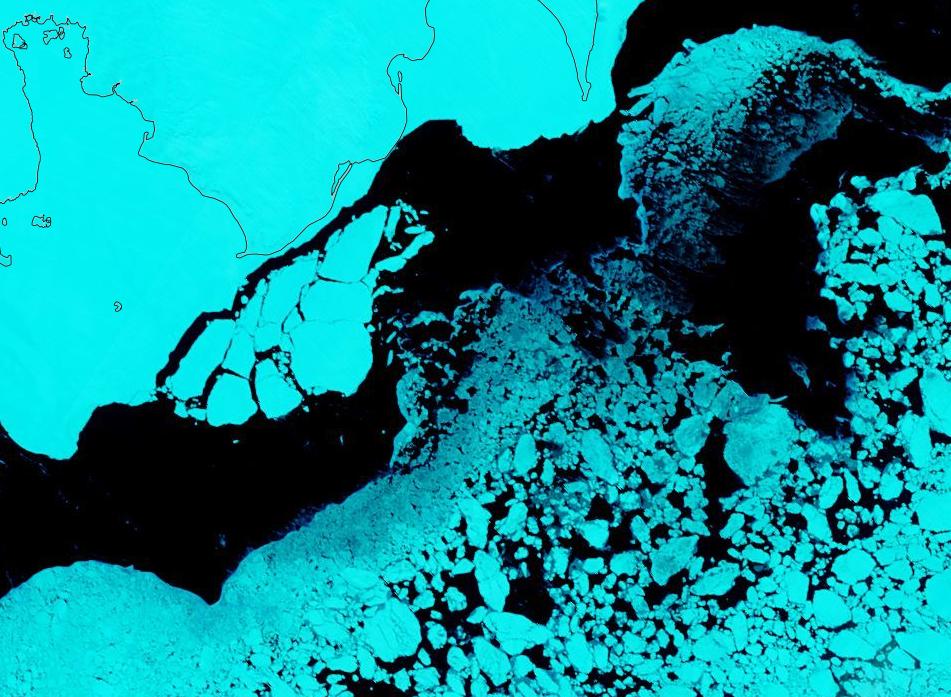
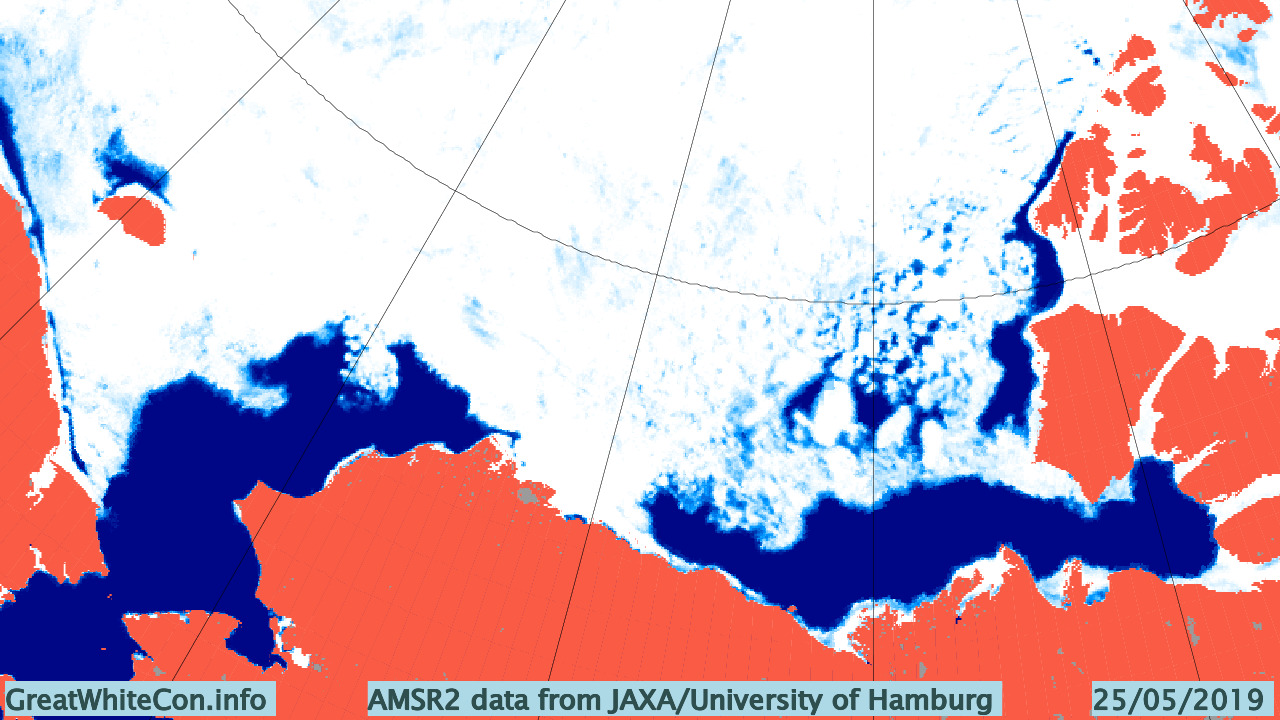
There also seem to be signs of some at a higher latitude off Ostrov Kotelny in the New Siberian Islands:
NASA Worldview “false-color” image of the Laptev Sea on May 23rd 2019, derived from the MODIS sensor on the Terra satellite
This year there is also a lot of open water in the Chukchi Sea, and almost no sea ice left in the Bering Sea:
Compared with 2016 at the same time of year I am compelled to say that with June 1st just around the corner the 2019 summer melting season is primed to progress more quickly.
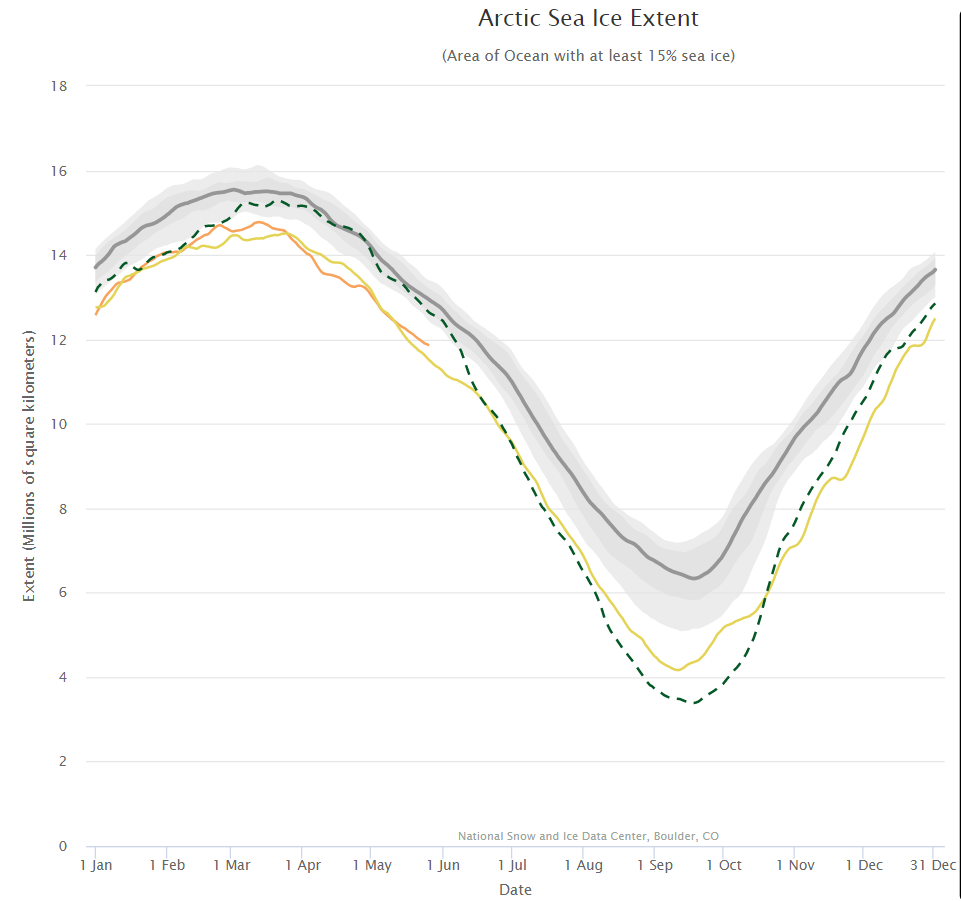
The next obvious comparison to make is with the (in)famous year of 2012, which resulted in the lowest ever minimum extent in the satellite record. Firstly let’s look at the National Snow and Ice Data Center’s graph of Arctic sea ice extent:
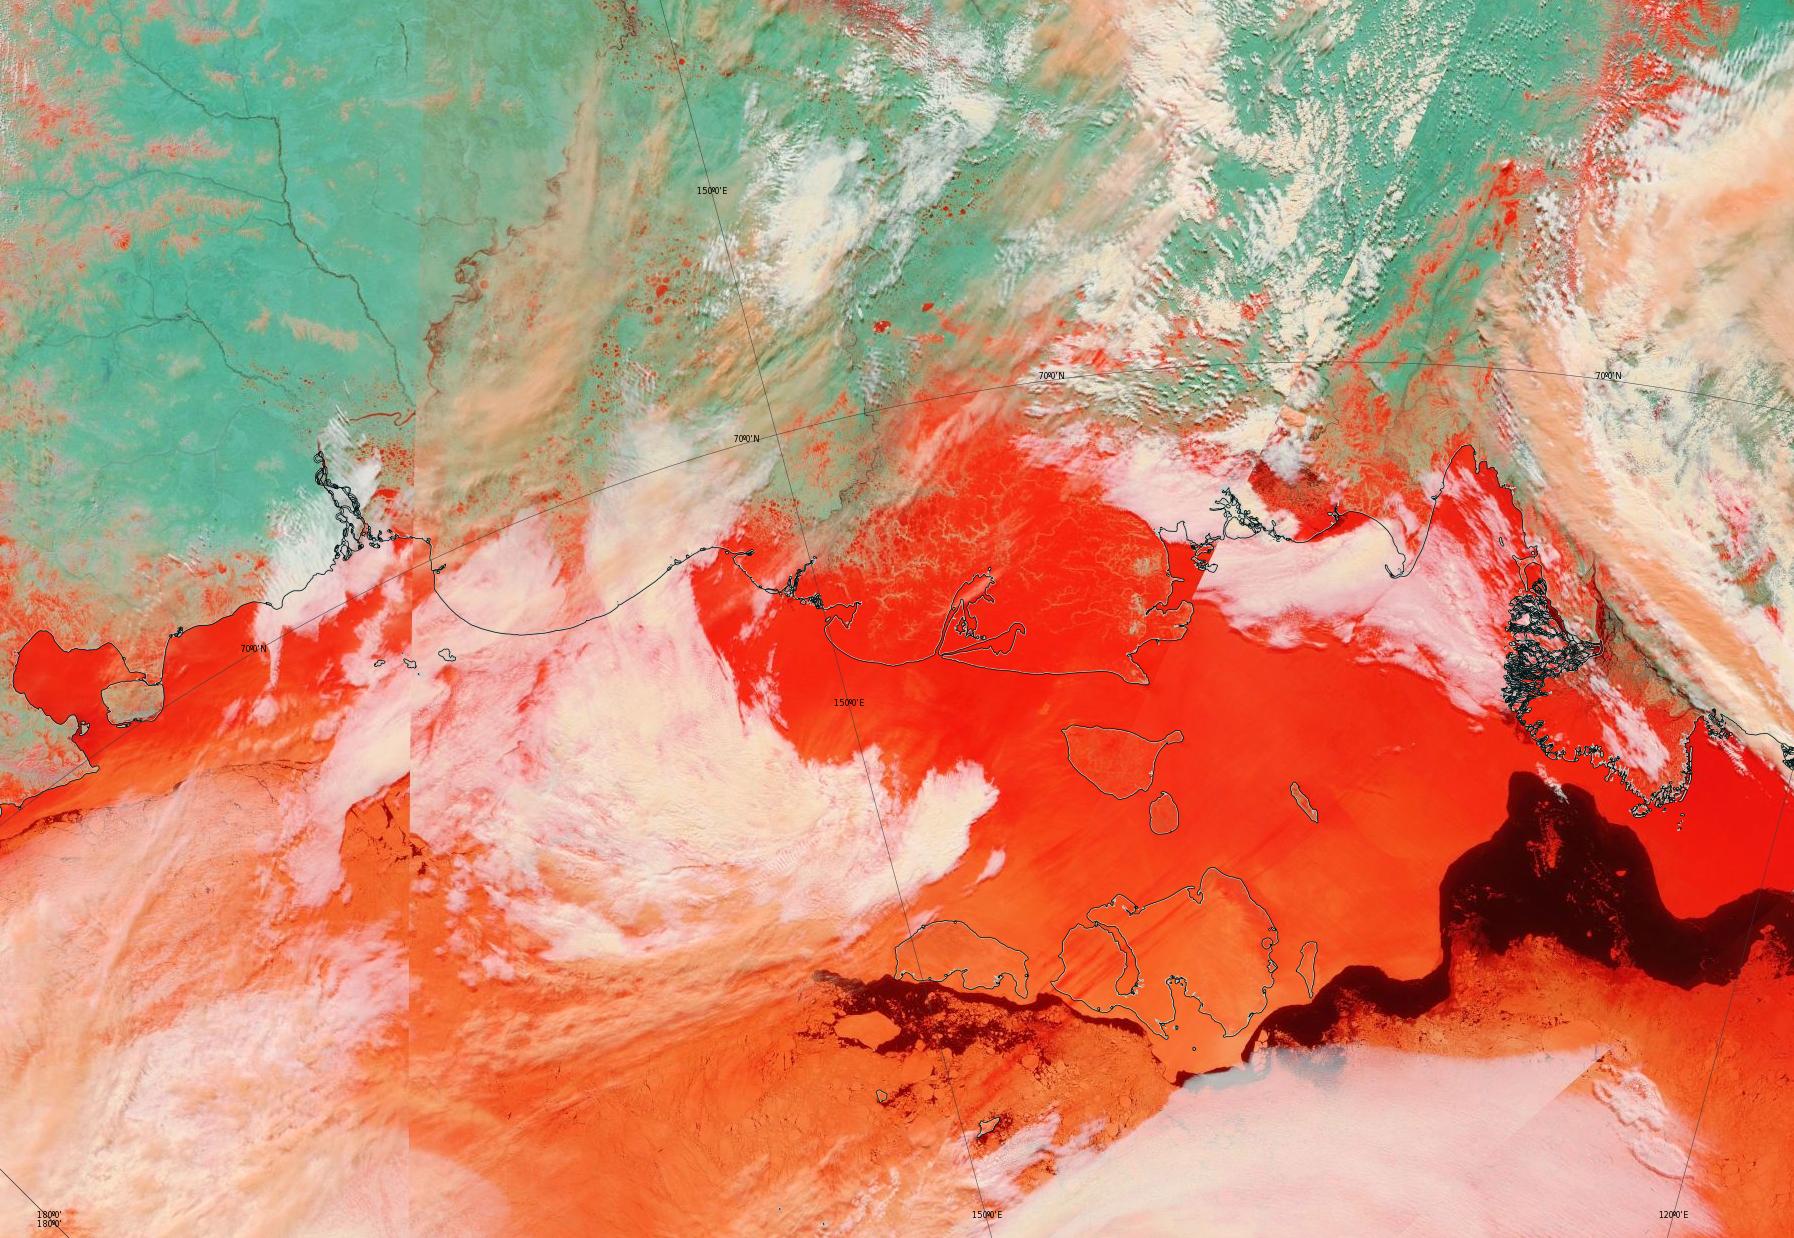
Currently extent is significantly below 2012, albeit somewhat above 2016 at the same time of year. And what of melt ponds? In 2012 there was evidence of less snow cover over land and more surface water on the ice on the Siberian side of the Arctic:
NASA Worldview “false-color” image of the Eastern Arctic on May 25th 2012, derived from the MODIS sensor on the Terra satellite
Other than that Arctic sea ice in 2019 looks to be in worse shape than in 2012.
[Edit – May 27th]
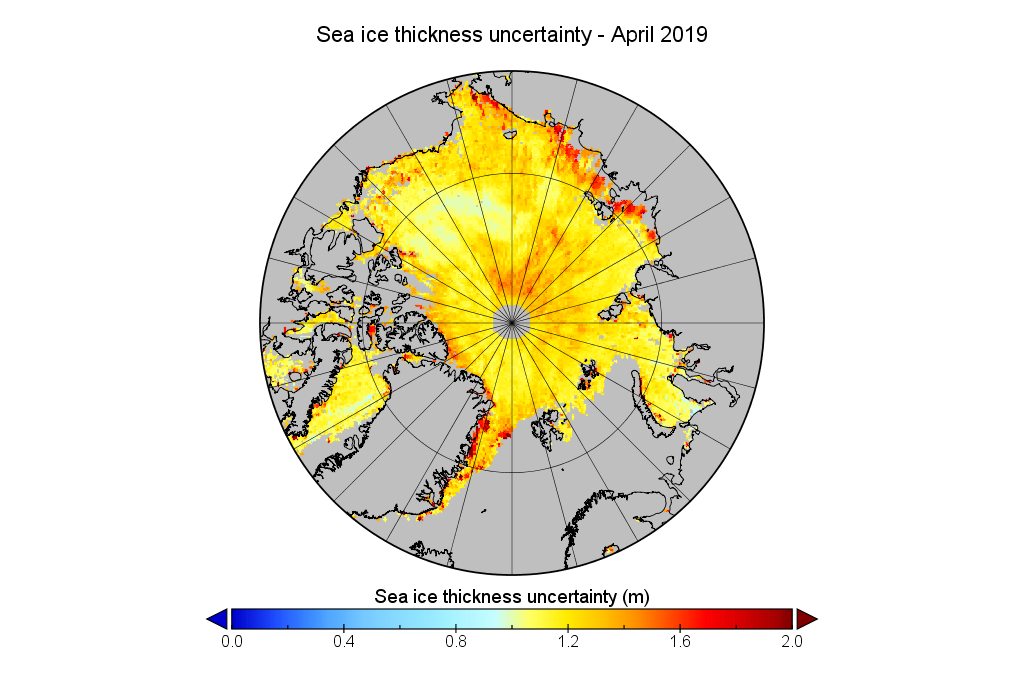
We’ve established that the extent of Arctic sea ice at the end of May 2019 is less than in 2012, but something else to consider is whether that ice is currently thicker than in 2012, or not. Satellites can have a reasonable stab at measuring the area of sea ice, but the third dimension is much trickier. The European Space Agency’s CryoSat-2 satellite has been attempting to measure sea ice thickness since 2010, so let’s take at the conclusions it has reached:
Don’t forget to take a good long look at the associated uncertainties too:
In the spirit of providing some spurious “balance” to the contentious Arctic sea ice “debate” our quote for today comes fairly fresh from the Arctic Sea Ice Forum:
idk how people are confusing the gaping fissures that span from Siberia to Canada with melt ponds but it seems like half the people here have blinders on to what is ongoing.
I know HYCOM gets a lot of flak but instead of projecting out, let’s look at the last five days.
[Superfluous image redacted]
The ice has clearly broken completely in two now, and the recent ~970mb low did a major whomping to the ice in the “cleavage” between what’s stuck against Siberia and the main CAB.
Intriguingly this was in response to an informed comment on June 23rd to the effect that:
As we have seen recently, these large area drops in the middle of the pack do not mean the ice is gone, just that its top is wet/ponded. In a couple of days some of these drops might be reversed. Of course the ice has suffered in the meantime, but still it’s risky to simply extrapolate these numbers.
Even more intriguingly our headline for today is remarkably like the inverse of a phrase in a Mail on Sunday article that led us to create this site in the first place!
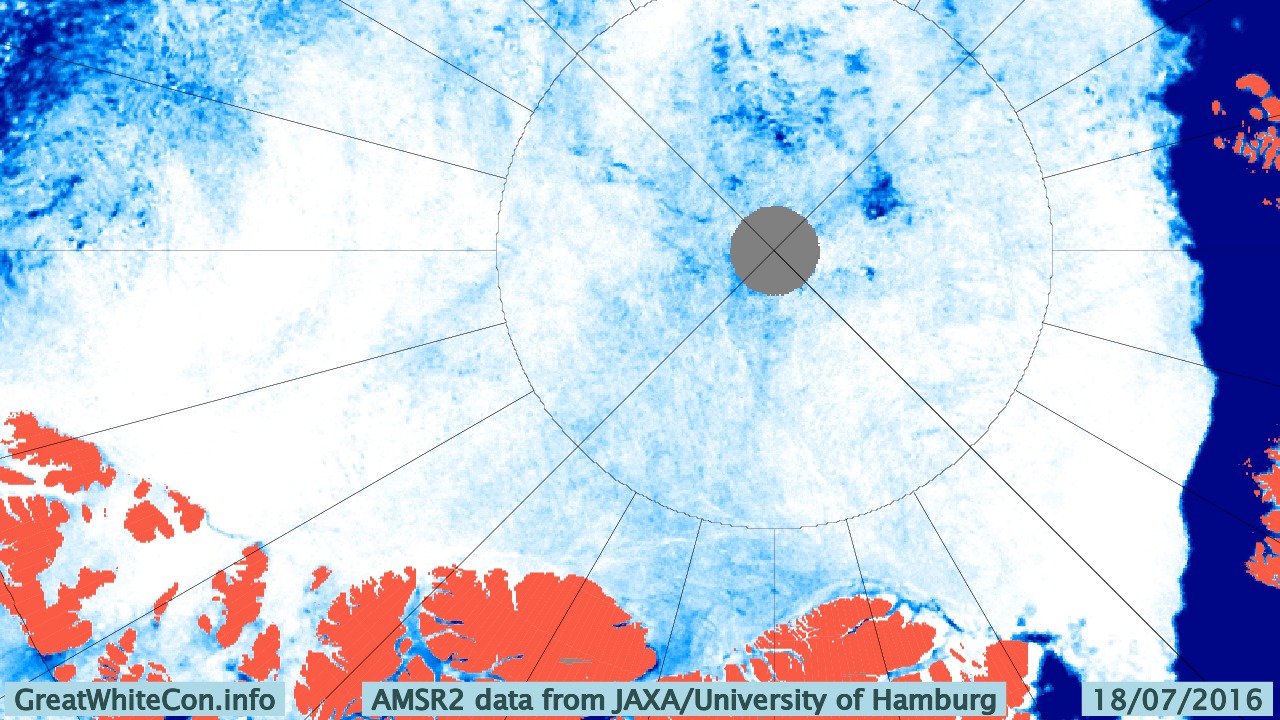
Nearly three weeks have passed since those “gaping fissures that span from Siberia to Canada” were announced, and you may well (like me) be wondering how they have been coming along? In partial answer to that question here is our very latest video based on the University of Hamburg’s AMSR2 concentration visualisations:
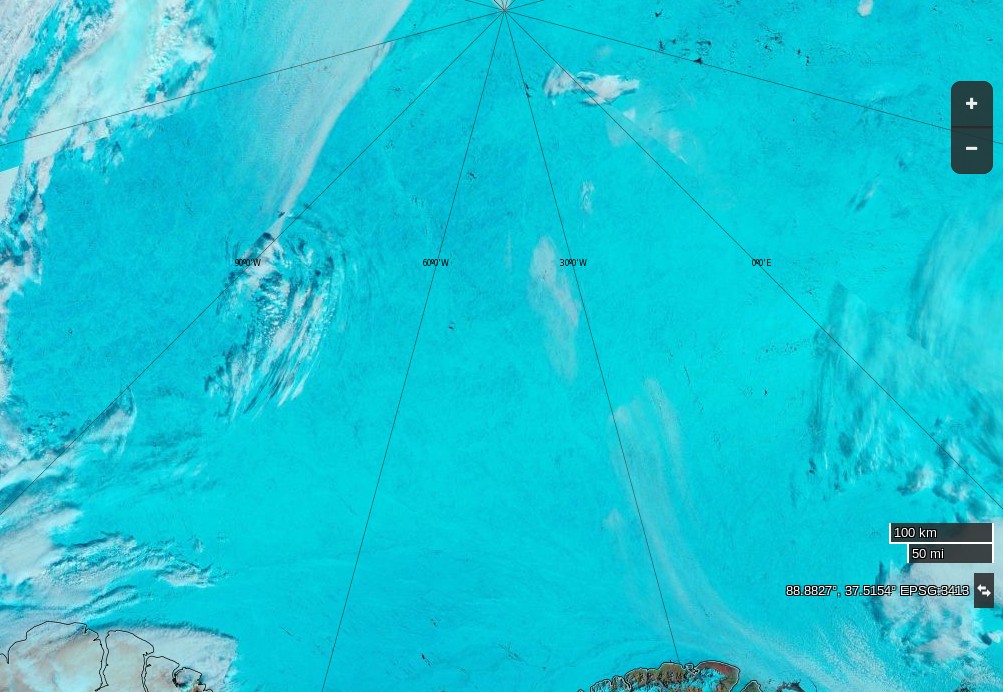
In my own humble opinion this doesn’t really count as a “gaping fissure” but MODIS imagery does now show a fair bit of open water between Siberia and the North Pole:
A “gaping fissure” between the Pole and Canada (and/or Greenland) is however conspicuous only by its absence:
NASA Worldview “false-color” image of the Central Arctic Basin on July 11th 2016, derived from the MODIS sensor on the Aqua satellite
I do think that I can spot some melt ponds in the area at the moment though. How about you?
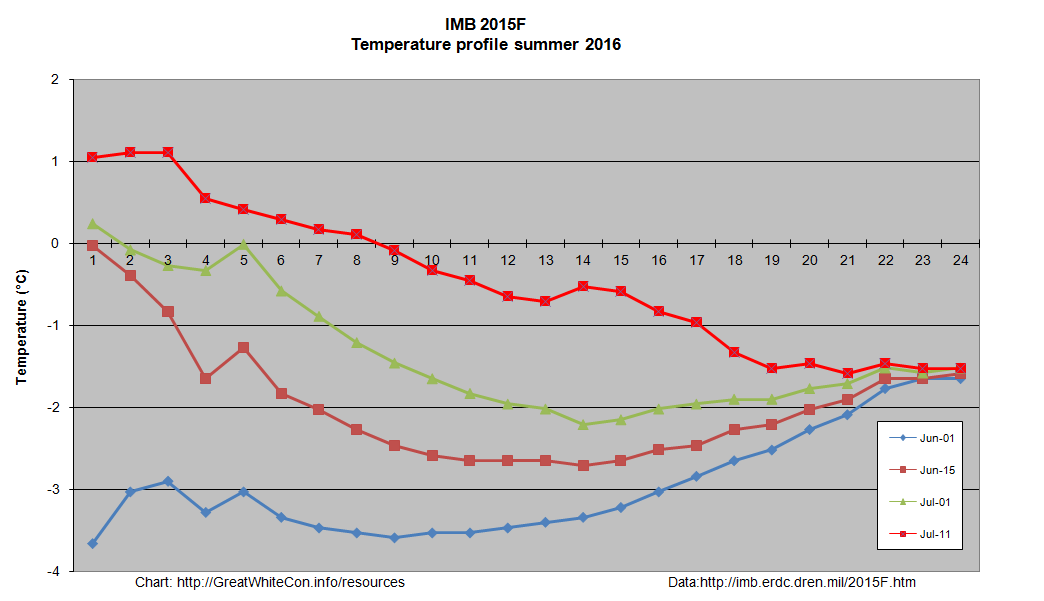
The one CRREL/ERDC ice mass balance buoy still reporting reveals that both surface and bottom melting have started at around 83 degrees north:
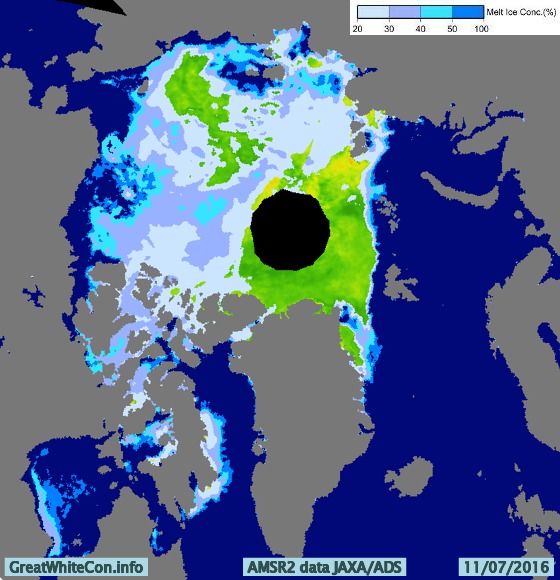
The 2016 multi-year ice melting season has evidently now begun, and the floe upon which buoy 2015F is sitting still has ~1.9 metres of melting to go. It’s not beyond the bounds of possibilty that a “gaping fissure” from the Atlantic to the Pacific will ultimately emerge this year. However based on the evidence thus far I’ll be extremely surprised if there is one “from Siberia to Canada”, unless of course you count the Chukchi & Beaufort Seas. That route is already open to intrepid Arctic seafarers, as can be seen at the bottom of the animation above and on the current JAXA/ADS Arctic sea ice surface melt map:
I have taken lots of flack I will stand by my prediction that we are heading for sub-1M KM2 come September (or early October).
Structurally [the ice] has actually now broken into three pieces, one is attached to the islands N of Siberia/NE of Svalbard, one is near Wrangel/ESS, and the “bulk” is pushed against the CAA/Greenland.
The lower concentrations in CAB are clearly open water and not melt ponds.
I felt compelled to explain to (presumably) him that:
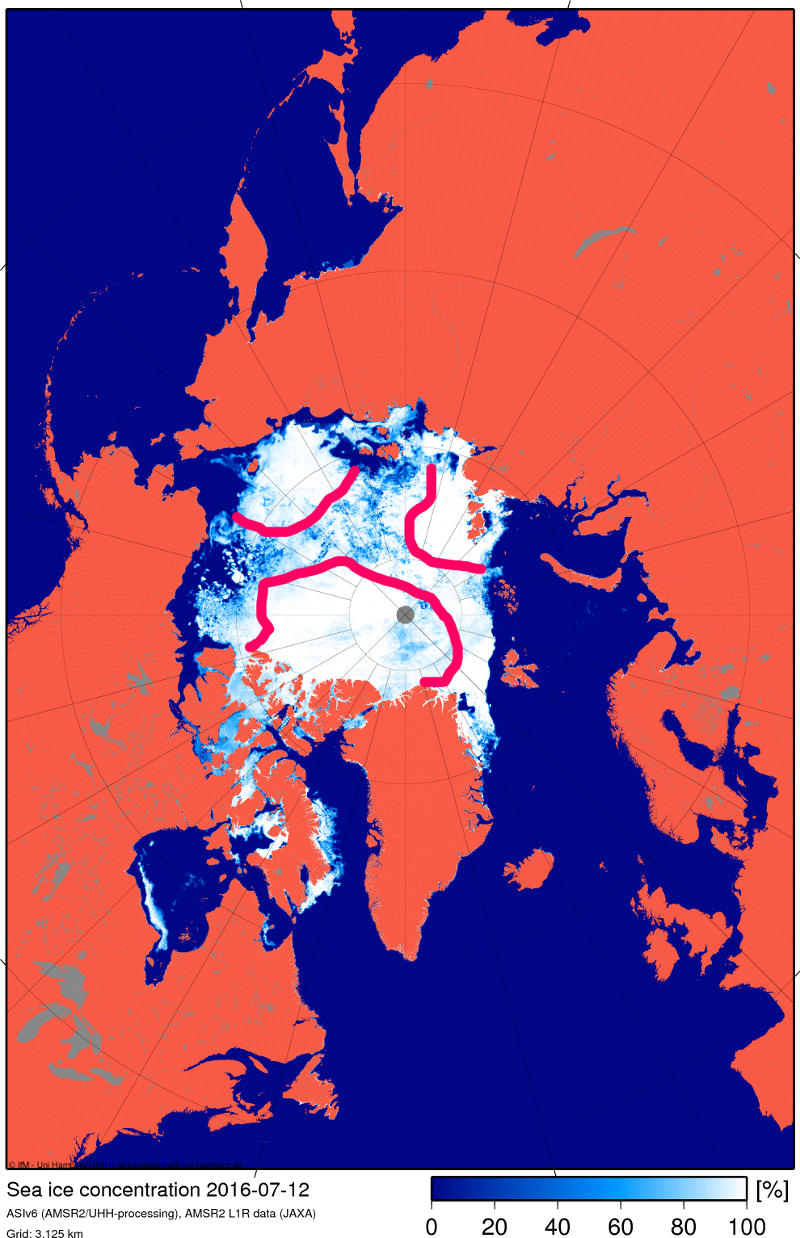
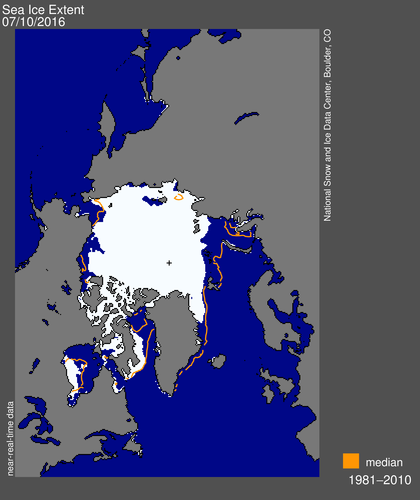
Here’s the NSIDC’s view of those “gaping fissures” of yours:
Despite some faults I think both ARC and GLB are onto the truth. Satellite grabs over the past few days show failure on all three fronts (ATL, PAC, and the Russian side especially), but the Russian side doesn’t present as a solid front (nor does the Beaufort melt), and the leads keep getting absorbed into the slush of the main pack (which is why the ‘slush’ keeps expanding, and why most of the CAB has now evolved into this state). The only solid regions of ice are those bordering the steaming ATL waters as well as some remnants north of the CAA (no coincidence the latter was chosen as ‘evidence’).
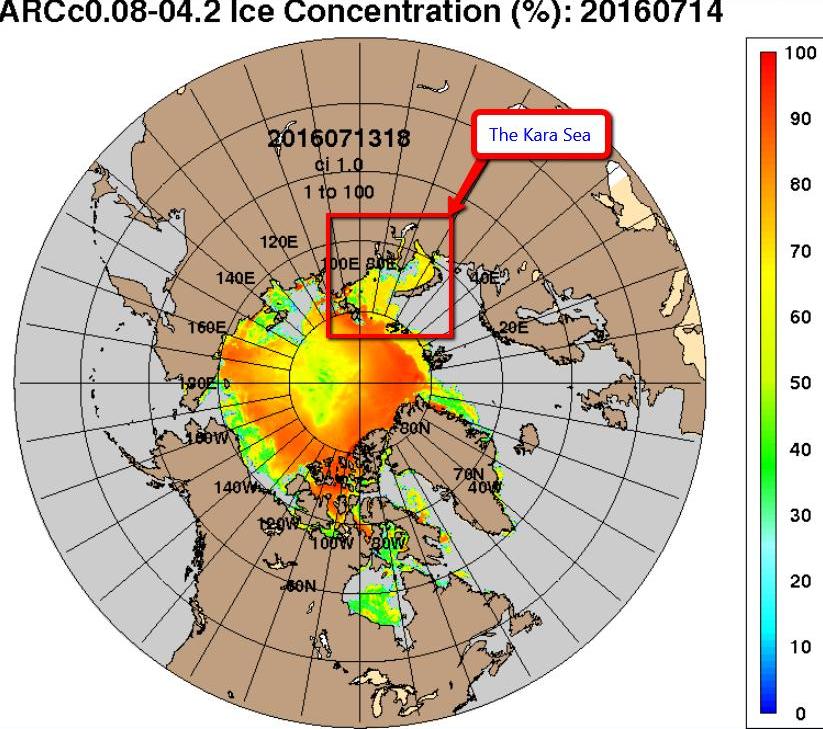
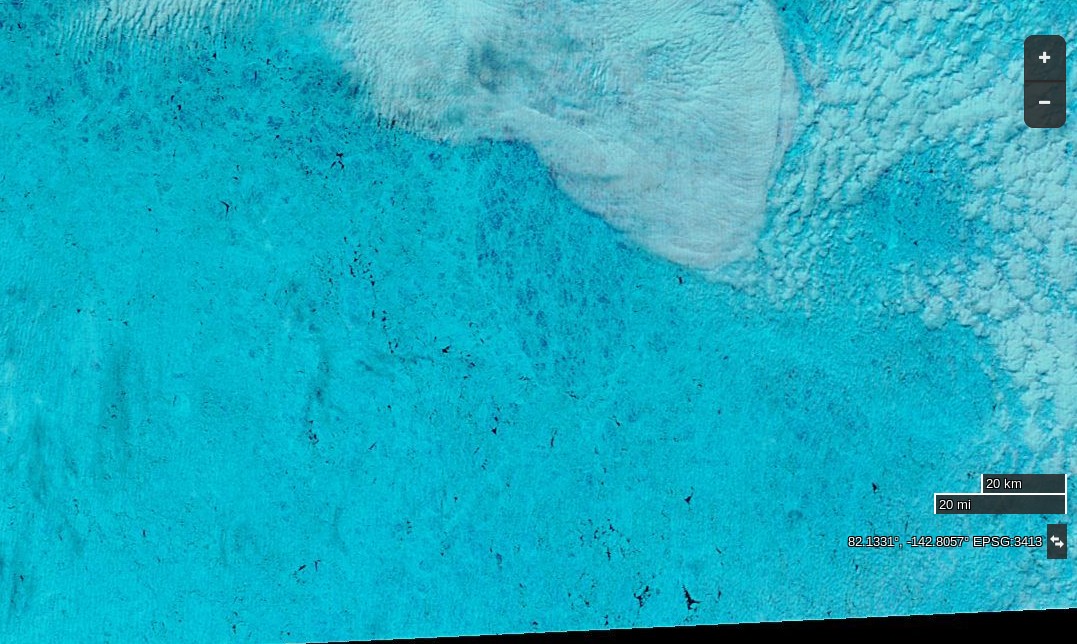
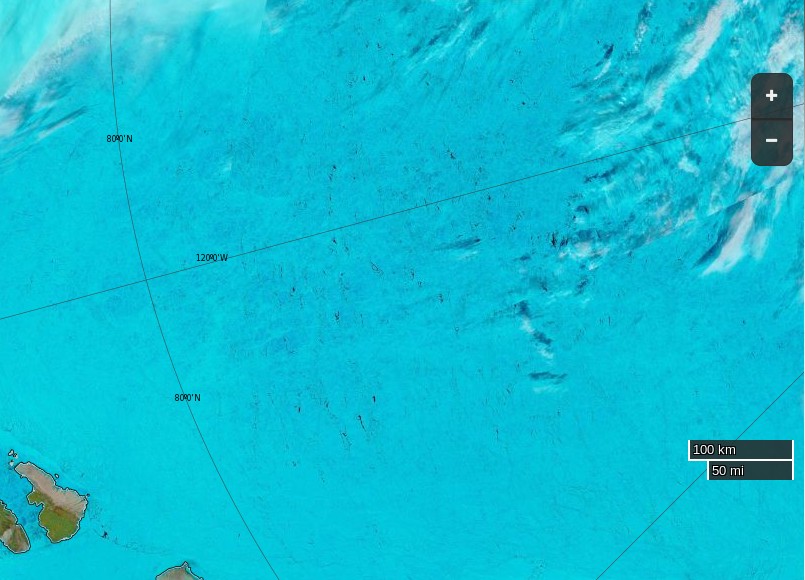
Yesterday the Kara Sea didn’t suddenly become covered in sea ice, and today the area of the Central Arctic Basin around 82 N, 135 W looks like this to the MODIS instrument on board the Terra Satellite:
NASA Worldview “false-color” image of the Central Arctic Basin on July 15th 2016, derived from the MODIS sensor on the Terra satellite
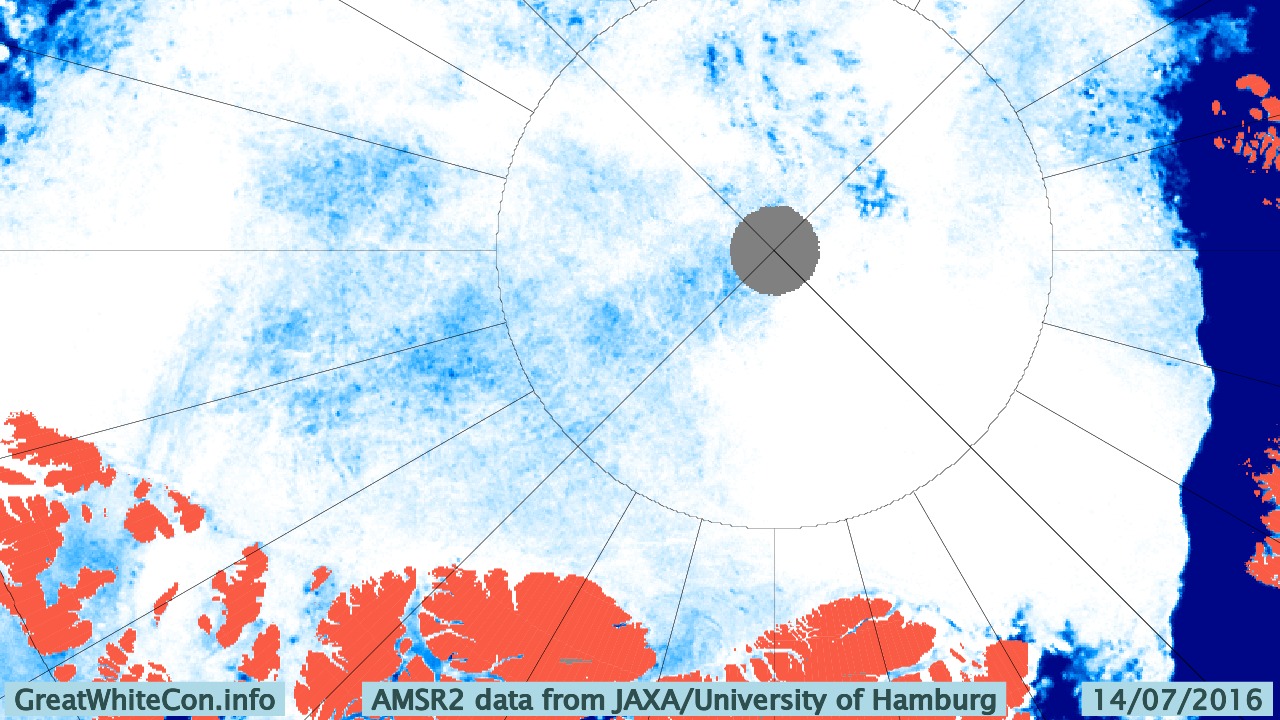
and like this to the University of Hamburg’s ARTIST sea ice concentration algorithm:
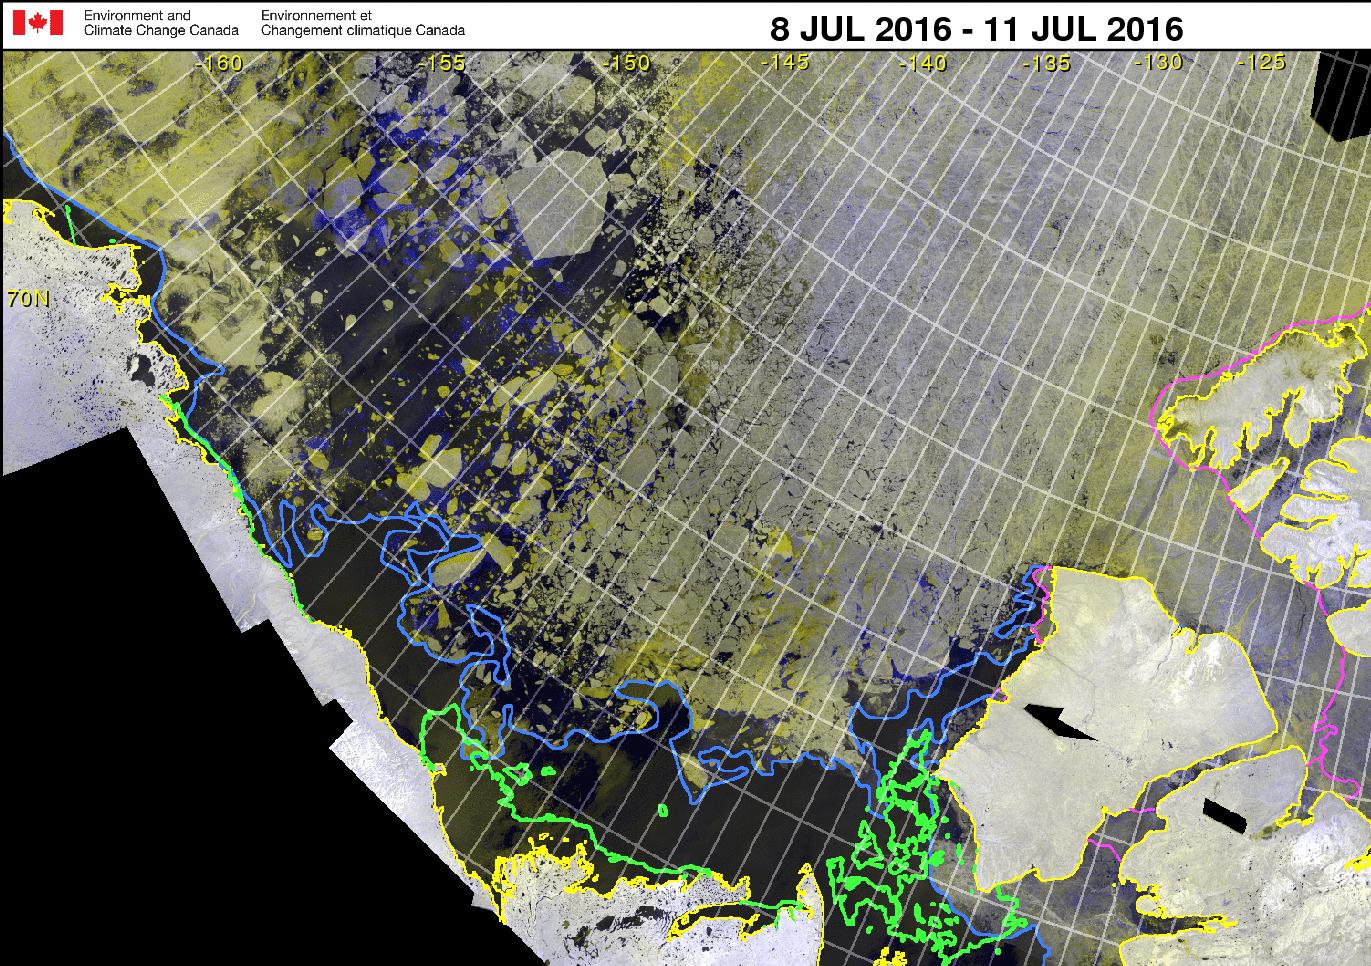
whilst here’s the latest Canadian Ice Service RadarSat mosaic for the Western Arctic:
Canadian Ice Service Western Arctic RadarSat mosaic for 8-11 July 2016
Current Buoy Data (07/15/2016):
Pos: 82.89 N, 137.34 W
Air Temp: -0.76 C
Air Pres: 1011.16 mb
Ice thickness : 185 cm
[Edit July 16th 2016]
The Arctic Sea Ice Forum management have banished “Flack Jacket” to the sin bin for a month.
I’m fed up with the personal insults because a model that has a history of errors is showing something spectacular that no other data source does. Come back in a month if you still feel like it.
Meanwhile in answer to my enquiry on the HYCOM support forum Alan Wallcraft tells me:
We now use the National Ice Center’s IMS sea ice extent product in our assimiltion, see http://www.natice.noaa.gov/ims/. This is manually produced every day, and generally avoids the artifacts and deficiencies of satellite sea ice concentrations. However yesterdays IMS fields were not good, and that is where the spurious sea ice came from. Today’s IMS field is good, and we may rerun the 2016/07/13-18Z nowcast/forecast to clear this up.
After a brief “pause” ACNFS is back in action, and here is its latest Arctic sea ice concentration “nowcast”:
Yesterday the skies were clear once again over the corner of the Arctic where buoy 2015F is located:
NASA Worldview “false-color” image of the Central Arctic Basin on July 15th 2016, derived from the MODIS sensor on the Aqua satellite
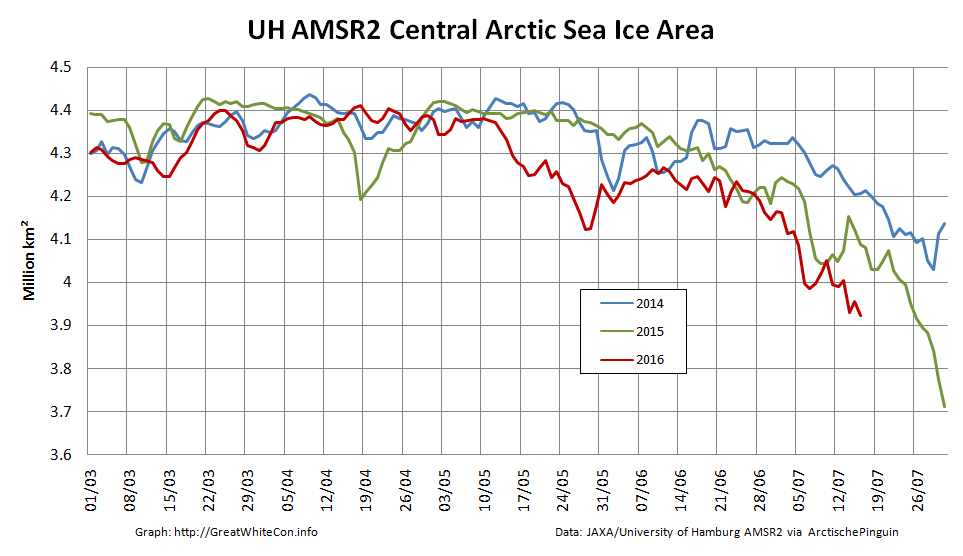
Here’s how the sea ice area in the Central Arctic Basin has been faring recently:
[Edit July 19th 2016]
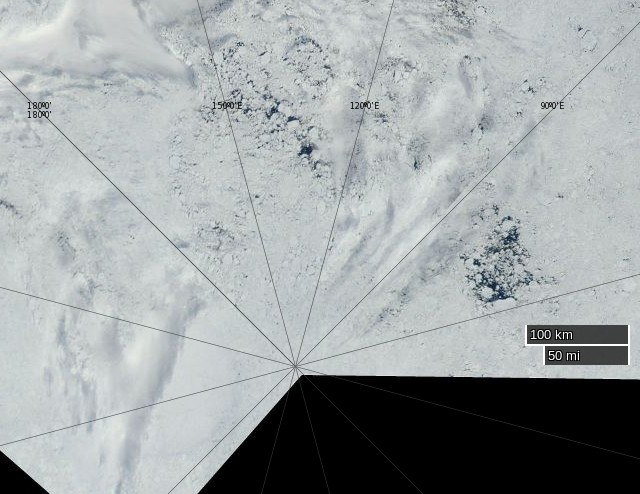
Here’s an early image of the North Pole from the Aqua satellite this morning, recorded for posterity in case it changes later:
NASA Worldview “true-color” image of the North Pole at 09:00 UTC on July 19th 2016, derived from the MODIS sensor on the Aqua satellite
and as the recent Arctic storm heads towards the Canadian Arctic Archipelago here’s the latest Hamburg AMSR2 concentration map:
I attach the ACNFS plot you referenced and the corresponding plot from our next global real-time system (GOFS 3.1), which will likely replace our current global analysis (and ACNFS) once NAVGEM 1.4 is operational (it is running here with NAVGEM 1.3, like ACNFS). They assimilate the same observations, but ACNFS only does so near the ice edge while GOFS 3.1 assimilates sea ice concentration everywhere (but with higher error bounds in the ice interior). The reason for ACNFS only assimilating near the edge is in part due to that being the most important area for navigation but also because SSMI satelite ice concentrations tend to “over saturate” in the summer. We switched GOFS 3.1 to “believe” the observations because they are generally better in recent years.
The two are quite different in the interior of the sea ice and GOFS 3.1 is certainly better there. We did not see the low concentrations near the North Pole in ACNFS this time last year, so something has happened to make the free running model produce low concentrations this summer. We are looking into it.
This website uses cookies to improve your experience. We'll assume you're ok with this, but you can opt-out if you wish. Cookie settingsACCEPT
Privacy & Cookies Policy
Privacy Overview
This website uses cookies to improve your experience while you navigate through the website. Out of these, the cookies that are categorized as necessary are stored on your browser as they are essential for the working of basic functionalities of the website. We also use third-party cookies that help us analyze and understand how you use this website. These cookies will be stored in your browser only with your consent. You also have the option to opt-out of these cookies. But opting out of some of these cookies may affect your browsing experience.
Necessary cookies are absolutely essential for the website to function properly. This category only includes cookies that ensures basic functionalities and security features of the website. These cookies do not store any personal information.
Any cookies that may not be particularly necessary for the website to function and is used specifically to collect user personal data via analytics, ads, other embedded contents are termed as non-necessary cookies. It is mandatory to procure user consent prior to running these cookies on your website.