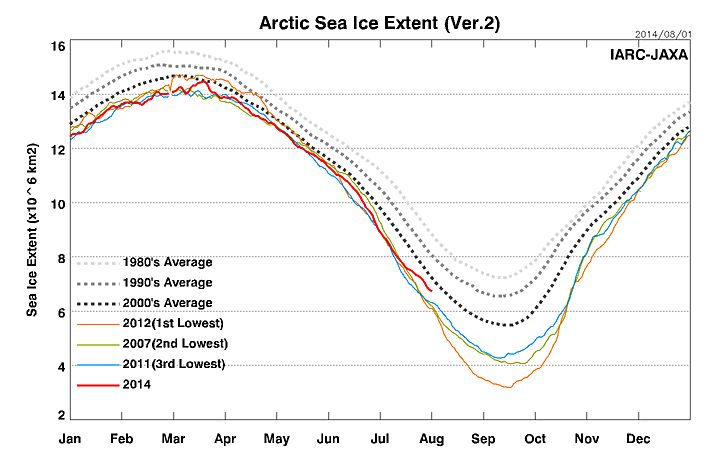
The “Shock News” about Arctic sea ice is coming thick and fast as the 2014 melting season reaches its peak. I’ve been debating the meaning all of the various metrics with none other than my old sparring partner “Steve Goddard” AKA Tony Heller. The theory which is mine (in brief!) is that the ice is actually getting thinner and hence travelling faster. As regular Great White Con readers may well suspect by now, Steve/Tony has other ideas. Here are the edited highlights:
Them:
Steve/Tony’s latest Arctic sea ice prophecy is entitled “My Arctic Forecast“, although it’s actually his fourth of the season. Here’s his take:
Arctic ice extent will continue to decline for a couple of days, then a cyclone near the North Pole will begin spreading the ice, and the extent curve will turn back towards the median.
The minimum this summer will likely be close to the 2006 minimum, which was the highest minimum of the past decade.
Us:
My latest Arctic forecast is more short term than yours Tony, and rather more precise too.
“CT area decline of around 180 k over the next two days”. I guess that equates to “CT Arctic sea ice area will reverse and then decline for a couple of days”?
Them:
Gutsy to go with a forecast, but then the great ones risk it to gain the glory.
Us:
Many thanks for your kind words Phil.
Time passes……
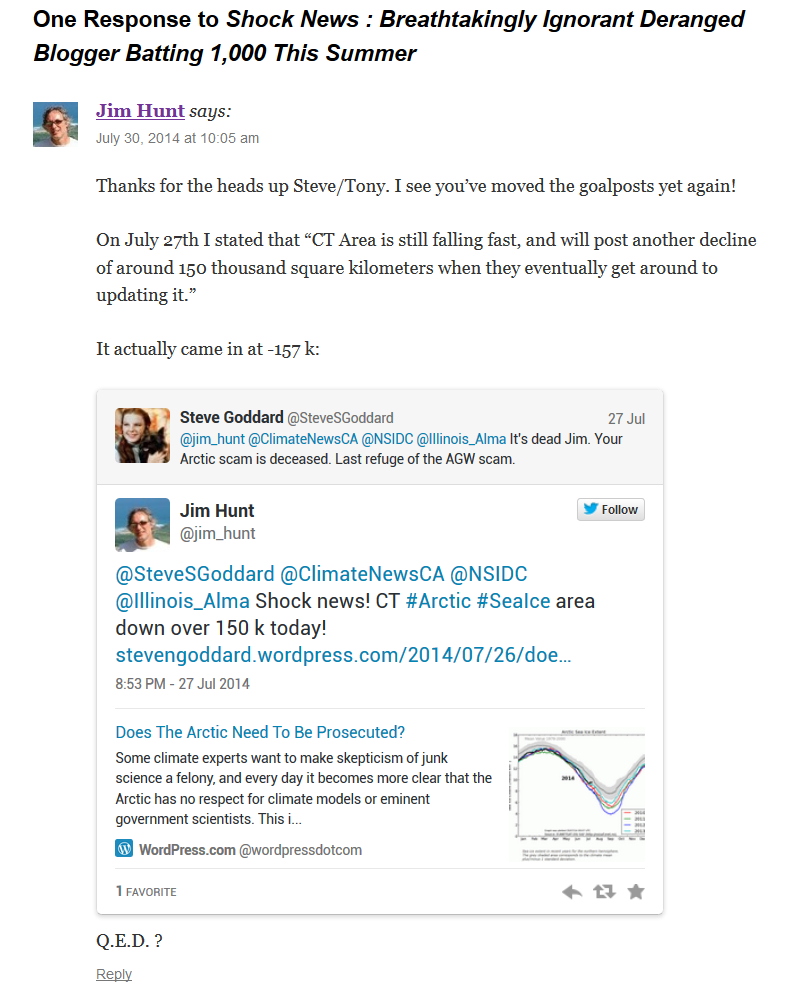
CT Area has just come in at 44,288 square kilometers below yesterday. The “turn on the proverbial dime” has come to pass, and there is only another 135,712 to go!
Them:
CT doesn’t measure extent. This post is about extent. Stop being a moron and wasting my time.
Time passes……
I do appreciate you demonstrating so graphically the dissonance and dishonesty of climate alarmists.
Us:
The pleasure is all mine Tony.
I’ve asked this before without receiving an answer, but is there any way for commenters on here to include an image?
Failing that is there any way you might be willing and able to display the graph at my JAXA link here?
You do have a working knowledge of English. Congratulation!
Us:
Thanks for your kind words DedaEda, once again.
A new month means some masks have changed, so the GWC patent pending crystal ball is cloudier than usual. Undaunted the CT oracle hoarsely whispers “Expect a couple more 100 k declines next. Around 225 k in total”
I also have been forecasting for the past three years that the amount of multi-year ice in the Arctic will increase, during a time when Arctic experts were predicting an ice-free Arctic
The difference between my approach and that of Arctic experts, is that I use the scientific method. They rely on superstition about a harmless trace gas. Real Science always beats superstition.
Steve/Tony was good enough to provide me with a link to his new post immediately following its publication, so I was lucky enough to be able to post the very first comment:
Us:
Them:
Jim, thank you demonstrating once again that you and your ilk are complete morons.
Us:
My pleasure Steve/Tony.
Them:
Take a good long look through the archive footage linked to at the top. Try not to inadvertently end up on (un)Real Science!
I wandered over to Twitter a couple of days ago to see if I could persuade Steve/Tony to dig a pertinent comment of mine about Arctic sea ice extent out of the “Real Science” spam folder. Whilst over there I couldn’t help but notice that Andrew Neil had been passing comment on recent events in the Arctic too! According to his Twitter page Andrew is:
Chairman Spectator Magazines (London); ITP Magazines (Dubai); World Media Rights (New York). BBC presenter.
According to his C.V. on the BBC web site Andrew is:
Presenter of the Daily Politics on BBC Two and the Sunday Politics on BBC One.
In a long career in publishing and broadcasting Andrew has been UK editor of The Economist, editor of The Sunday Times, executive chairman of Sky Television and publisher of The Scotsman Group of newspapers.
Fresh from his controversial BBC interview with Ed Davey, the UK’s Secretary of State for Energy and Climate Change, Andrew was “tweeting” things like:
@ret_ward Yip. Thought so. You have zero qualifications in climate scientist. But you are an indefatigable propagandist. Take a bow.
In some recent shock news over at the “Real Science” blog “Steven Goddard” asked “Who is Steven Goddard” and then answered himself as follows:
My name is Tony Heller. I am a whistle blower. I am an independent thinker who is considered a heretic by the orthodoxy on both sides of the climate debate.
I’m highly unorthodox, so I’ll consider him as a schizoidal cherry picking pseudo-skeptic instead. Steve/Tony finishes his “coming out” article as follows:
I am more than happy to debate anyone who feels up to the challenge, including the President of The United States. Science works through research and debate – not censorship, propaganda, faith, or intimidation.
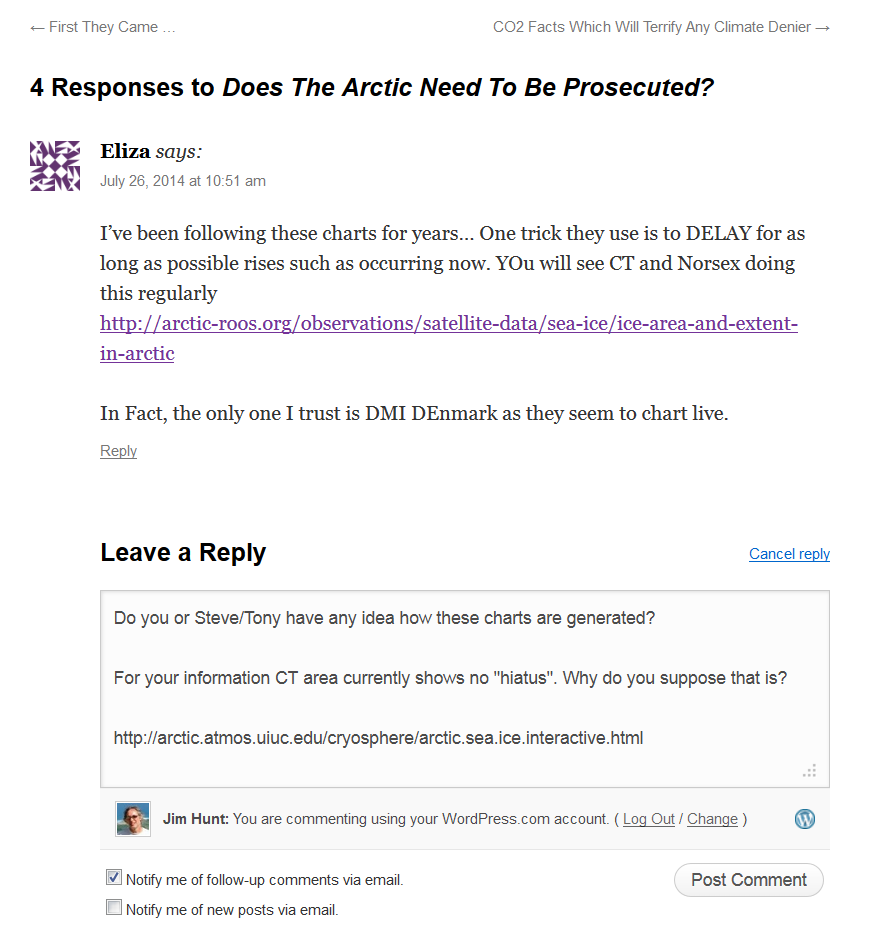
Steve/Tony has been blogging about Arctic sea ice again recently. His most recent post is entitled “Does The Arctic Need To Be Prosecuted?“, but it seems he’s unwilling to engage in debate about that topic with me.
Them:
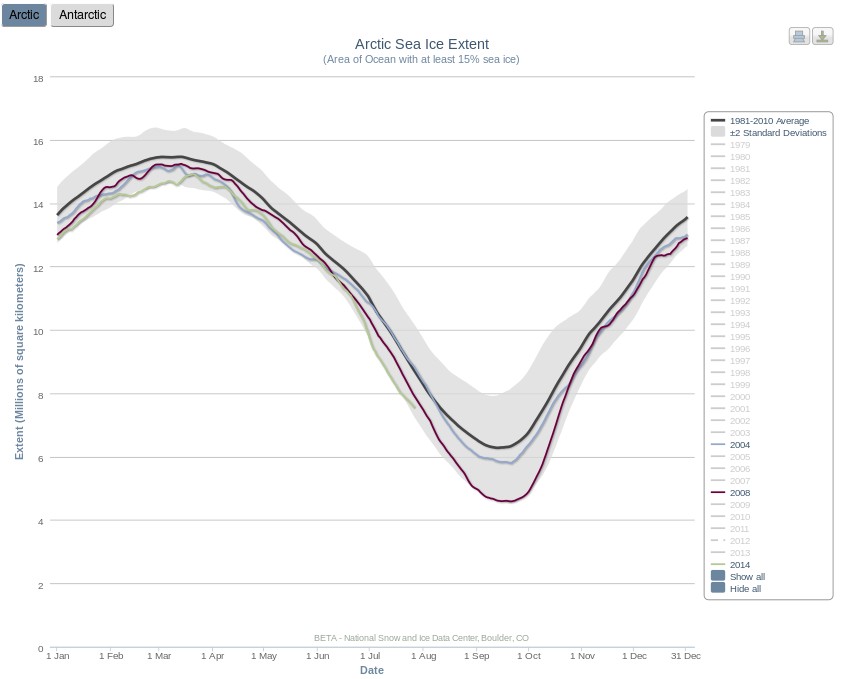
Some climate experts want to make skepticism of junk science a felony, and every day it becomes more clear that the Arctic has no respect for climate models or eminent government scientists. This is shocking, and it is time for the Arctic to be prosecuted. The Arctic is aiding and abetting climate deniers, as well as making obscene gestures towards the world’s leading academics.
NSIDC interactive Arctic sea ice extent graph on July 26th 2014
As far as I am aware there is no law against being a schizoidal cherry picking pseudo-skeptic in the United States of America, or anywhere else for that matter. Please feel free to comment below if you know otherwise and/or think that there should be!
Them:
After a protracted exchange on Twitter a copy of my comment eventually saw the light of day:
My title today refers to the fact that the summer Arctic sea ice forecasting season is with us once again. The ARCUS Sea Ice Outlook (SIO for short) started in 2008, with the aim of gathering together and publishing “community predictions of the September sea ice extent”. The SIO is now part of the recently created Sea Ice Prediction Network, and the deadline for submission for the first set of forecasts of 2014 was June 10th.
I have a professional interest in UK and international energy policy, and as a consequence I have been commenting on the recent attempts of Professor Richard Tol to debunk the so called “97% climate change consensus” elsewhere in the blogosphere. As luck would have it I allowed myself to become engaged in what was supposedly a conversation about that very topic on the What’s Up With That blog. Feel free to read all about it if you’d like to see a pseudo-skeptical gish gallop in full swing:
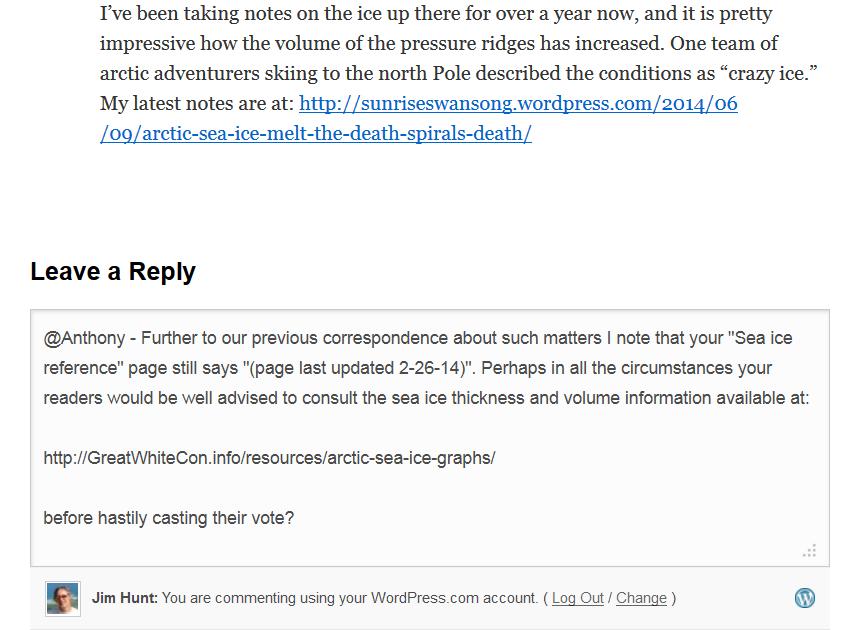
Whilst over there I couldn’t help but notice that Anthony Watts had left things until the eleventh hour before asking his faithful followers to contribute to the Sea Ice Outlook June survey. I also couldn’t help but notice that despite assurances to the contrary a few short weeks ago (and even after my recent “extra heads up“!) the WUWT “Sea Ice Reference Page” is still sadly lacking in a wide range of information about Arctic sea ice thickness and volume. Consequently I figured I would be performing a valuable public service by bringing this to the attention of Anthony and his readers. Here’s what happened after that:
Us:
Them:
June 10, 2014 at 8:55 am
[snip no, we are not going to have you thread-jack again by pushing your own website and own views – Anthony]
Us:
June 10, 2014 at 9:32 am
Re: @Anthony says: June 10, 2014 at 8:55 am
It’s not my “own views” Anthony. In fact it’s a long list of useful facts and figures for anybody attempting to forecast the future of Arctic sea ice. A long list of useful information still noticeable only by its absence from the WUWT sea ice reference page.
Them:
REPLY: We aren’t forecasting volume, we are forecasting extent, so again, your views that we should pay attention to volume graphs on your website (your favorite hobby horse) in this extent forecasting exercise are irrelevant. Don’t clutter up this thread further – Anthony.
Them & Us:
@wattsupwiththat What’s up with my “commenting style”? What’s up with my “own self” for that matter?
In the absence of a wide range of scientific information concerning the current thickness distribution of sea ice in the Arctic, and after due deliberation about the likely value of the NSIDC Arctic sea ice extent metric in September 2014, Anthony concluded:
A value of 6.12 million sq km will be sent to ARCUS.
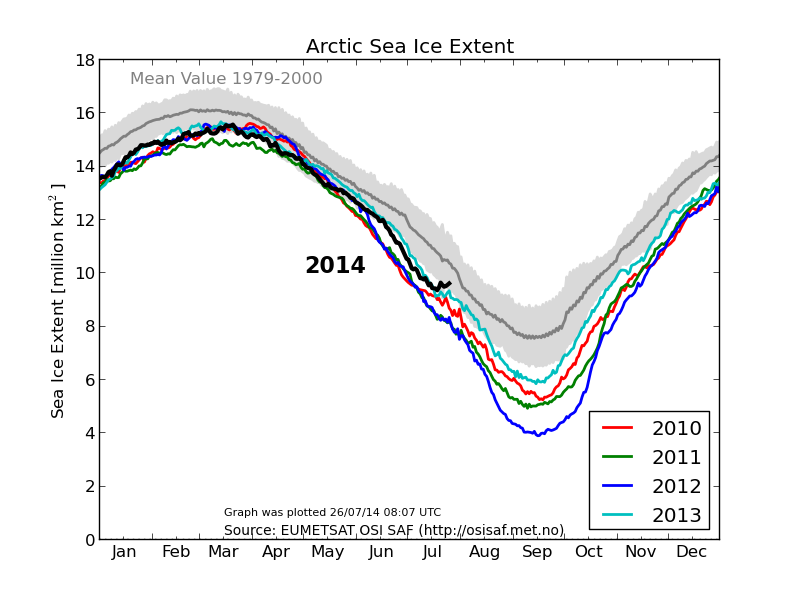
The self proclaimed “world’s most viewed site on global warming and climate change”, otherwise known as the “Watts Up With That?” blog, recently published an article entitled “Arctic Sea Ice Appears to Have Reached Maximum And Other Ice Observations”. Since I’ve been speculating about the date of the 2014 maximum Arctic sea ice extent myself I avidly read the article but found myself ultimately somewhat perplexed. There were lots of graphs and charts displayed, but there was no sight or mention of what seems to me the most relevant one of all. The long term trend. Here is an expurgated version of my attempts to bring this oversight to the attention of the Watts Up With Thatters:
Us:
A “dull” comment about Arctic sea ice trends
Them:
Re: Michael Jennings says:
March 26, 2014 at 7:07 am
[snip . . this is dull. Put some content into your contributions or you are just trolling . . mod]
Us:
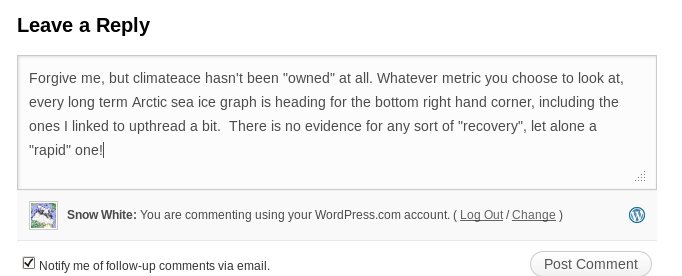
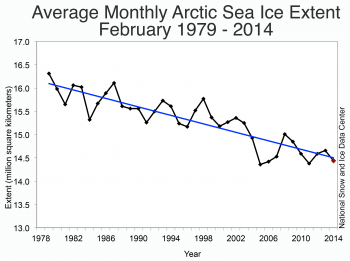
At the risk of repeating myself, here’s the latest dull content out of NSIDC:
Do you see the blue line heading for the bottom right?
Snow White needs to get up to speed on the Scientific Method: skeptics have nothing to prove.
Rather, the onus is on the alarmist crowd to provide scientific evidence showing that their CO2/cAGW conjecture is true. They have failed miserably.
But there is no scientific evidence supporting their belief in manmade global warming. None at all. Every last climate model has failed. They were all wrong.
The alarmist crowd is fixated on Arctic ice, instead of on global ice cover. Why? Because that is their last forlorn hope; every other climate scare has been debunked. Well, it’s time to debunk the ‘disappearing Arctic ice’ scare, too:
Global sea ice is at it’s 30-year average [the red graph – click in chart to embiggen]. We already know about the polar see-saw, in which the NH and SH poles balance each other out. That effect can be clearly seen in the global ice chart above.
There is nothing either unusual or unprecedented happening. What we observe now has happened before, repeatedly, and to a much greater degree. Rational folks understand that. It is called the climate Null Hypothesis, and it has never been falsified. The Null Hypothesis is a corollary of the Scientific Method. So is the fact that the onus is on those who produce the catastrophic CO2/AGW conjecture, to suport their belief with scientific evidence.
But there is no evidence proving that Arctic ice is in unprecedented decline. None at all. There is no evidence to prove that the current Arctic ice fluctuation is anything other than natural climate variability. Occam’s Razor says that natural variability is by far the most likely explanation.
The Arctic ice scare is just the same as all the other climate scares. It is promoted by religious True Believers, who expect everyone to share in their Chicken Little panic.
But that only works on those who are ruled by emotion, and fright is an emotion. Scientific skeptics, OTOH, are logical, and therefore they are unaffected by the silly ‘Arctic ice’ scare.
Us:
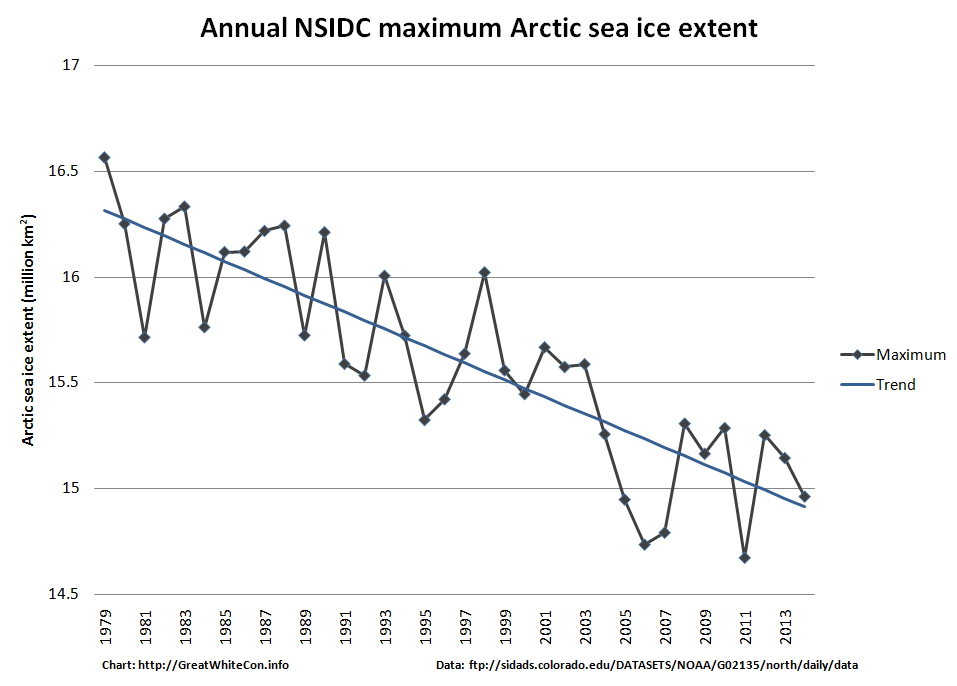
So to summarise, you cannot muster a single chart to refute my assertion about Arctic sea ice decline, let alone “hundreds”.
For your edification, and for that of the writer of the original article who for some strange reason neglected to include a graph showing the long term trend in Arctic sea ice maximum extent, here is one I prepared earlier:
Provisional NSIDC annual maximum Arctic sea ice extent graph for 1979 – 2014
I’m sorry Snow White (or Mr Hunt, if you prefer), but I think that a little courtesy would be in order. I’ve read every word on the link you’ve provided, and the central theme of your original post was that “there was no sight or mention of what seems to me the most relevant one of all. The long term trend [of Arctic sea ice]“. You described more than one attempt to bring this deficit to the attention of WUWT.
Given that Michael D posted on your page at April 9, 2014 at 4:01 pm, politely pointing out that the WUWT sea ice page has just such data presented, it would seem a basic courtesy to either acknowledge his assistance (in this blog or yours) and either thank him, or explain why graph does not answer your criticisms.
I acknowledge that your arguments seem to have moved on to volume now, but they have been addressed by others, and better than I could have done. As an aside, I suppose I could run a blog with limited data about Antarctic sea ice coverage and volumes. I’m sure that I would be criticised, with comments explaining that I was looking at the mural through a microscope, and that the Antarctic buildup cannot be considered in isolation. I think that such criticism would be valid – your thoughts?
Us:
As you can see from the historical record, I asked on more than one occasion for someone to supply a link to “A long term (let’s say 30 years or more) graph for any measure of Arctic sea ice “quantity” showing anything other than a trend in the direction of the bottom right hand corner.” Nobody did. Nobody suggested looking at the WUWT sea ice page either, presumably because no graphs fitting my description can be found on there.
Perhaps “conversation” is somewhat too strong a word? We have somehow managed to engage the Mail on Sunday’s top investigative journalist (AKA David Rose) in a debate about sea ice on Twitter. For some strange reason he tried to change the topic from the Arctic to the Antarctic!
Particularly in view of the recent inclement weather in this neck of the woods, I thought perhaps you might be interested in taking a closer look at the most recent evidence concerning this “hot topic”?
I hope you enjoy your meeting!
Best wishes,
Jim Hunt
AKA “Snow White”!
Them:
Hi Jim,
Thanks for drawing our attention to the blog. It is not a topic that we’re planning something on imminently, but it is something we are certainly keeping an eye on and will come back to in future.
With the able assistance of some of the regular readers of Steve Goddard’s so called “Real Science” blog I have drawn up a checklist of questions to answer should you (or any “sceptics” you may be aware of) be suffering from the delusion that the sea ice in the Arctic is “recovering” or “rebounding”:
Us:
1. Is the NSIDC daily Arctic sea ice extent number for March 8th 2014 the lowest on record for that day of the year? Yes or No?
2. Is the Cryosphere Today Arctic sea ice area number for March 8th 2014 the lowest on record for that day of the year? Yes or No?
3. Is the IJIS Arctic sea ice extent number for March 9th 2014 the lowest on record for that day of the year? Yes or No?
4. What credible evidence can you provide to show that “The Arctic is getting colder”?
5. In what way has the NSIDC’s data been “contaminated by Mann”?
6. Where might one find “empirical data that hasn’t been contaminated” if not from the likes of NOAA/NASA/JAXA et. al.
8. How much sea ice do you suppose will be left in the Gulf of St. Lawrence by September? [2014-3-12 20:26]
9. Which version of “the [thickness/volume] truth” do you choose to believe? [2014-3-14 09:30]
10. When was it that the DMI “changed the way they read/interrupt coastal features [which] they incorporated into their extent/area numbers”? [2014-3-15 15:08]
11. Why have we been accused of “a lie” and “put on ignore”? [2014-3-16 15:12]
12. Please be so good as to provide us with a link that describes “the modeling used by NSIDC to ‘create’ these numbers” [2014-3-20 13:00]
Now seems like an entirely appropriate time to bring the latest “Shock News!” from the Arctic to the attention of the “mass media” here in once Great Britain. Here’s a copy of an email I sent to John Wellington over at The Mail earlier today:
Us:
Re: PCC – Global cooling in an ideal world
Hello again John,
Further to our previous correspondence on this controversial topic here is the latest “shock news” from the Arctic, hot off the presses down here at Ivory Towers:
In view of the recent inclement weather in this neck of the woods, perhaps you could forward it on to one of your finest investigative reporters for me?
Best wishes,
Jim Hunt
Them:
It’s now March 15th 2014, and this morning I received a “Dear Jim” note from John:
Dear Jim,
Nice to hear from you and I trust you were not hit by the West Country floods, climate-influenced or not.
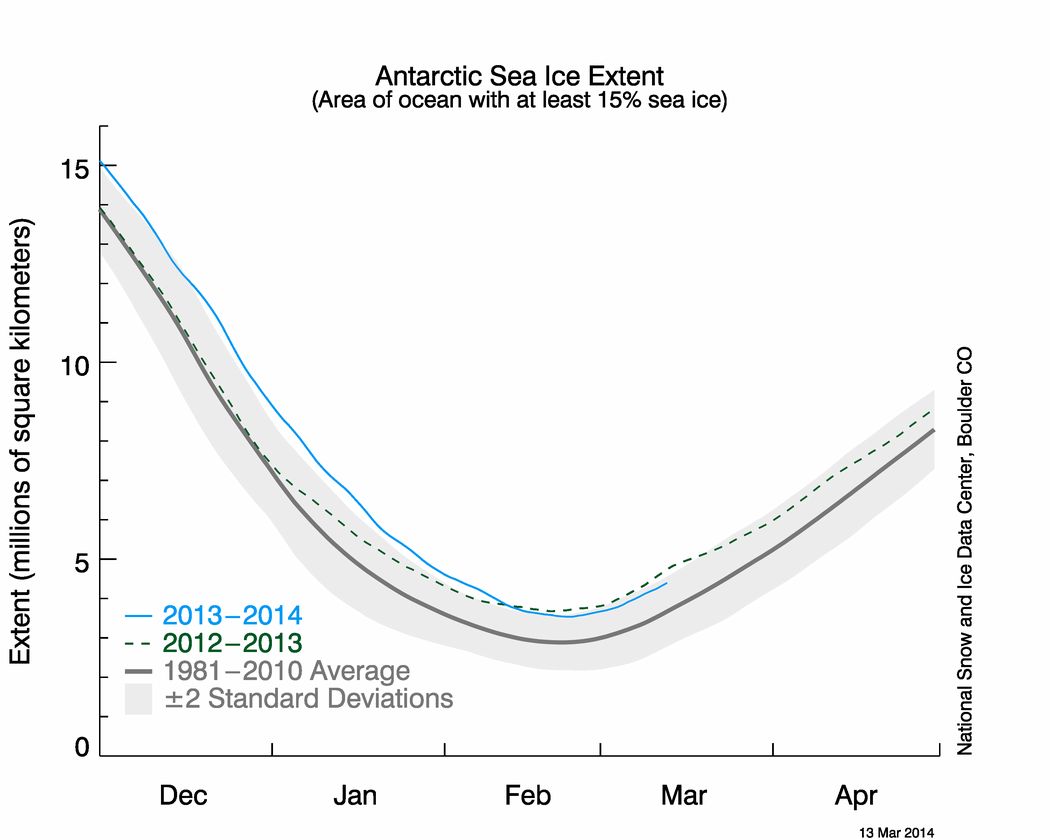
I have discussed your message with a colleague who is interested in these things and we conclude that March is a little early in the year to be drawing significant conclusions. I have been shown some different graphs that appear to show 2014 is not dissimilar to the last few years. I am attaching these for your information.
Best regards
John
Us:
Dear John,
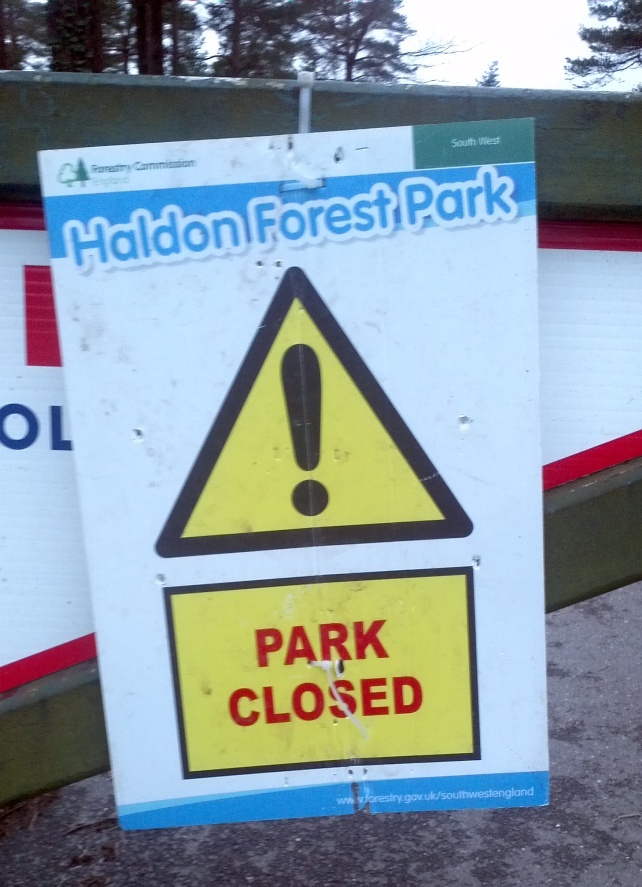
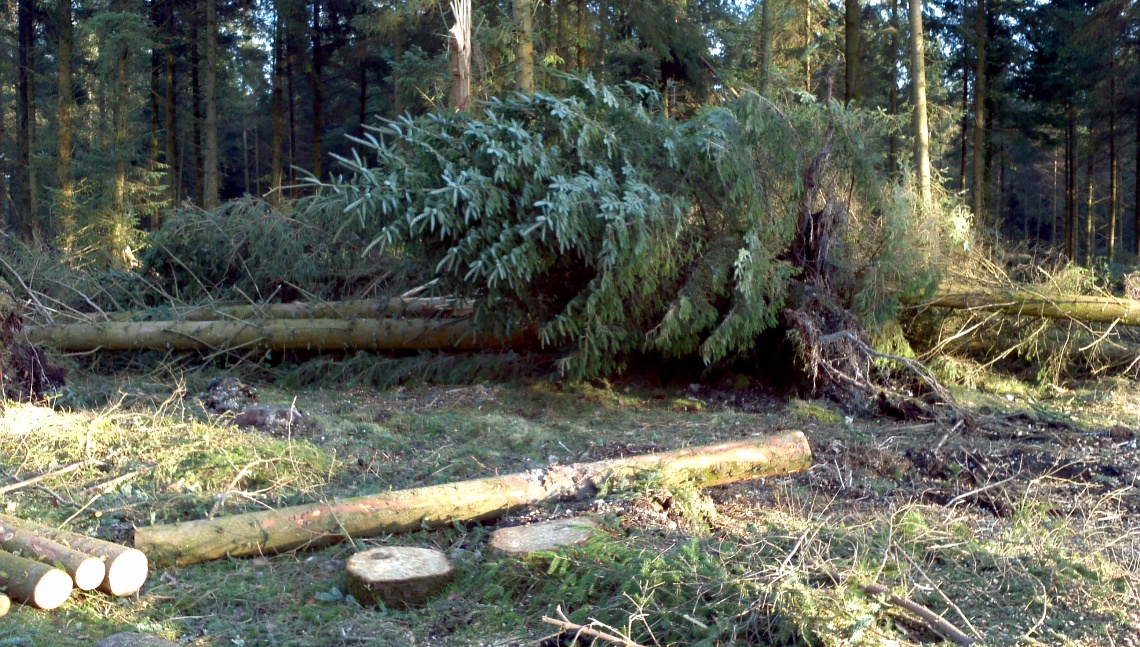
Thank you for your kind words. We’re situated halfway up Haldon, so we avoided the worst of the inclement weather. The top of the hill took a bit of a battering however.
The entrance to Haldon Forest Park on February 24th 2014Haldon Forest Park on March 8th 2014
Our garden suffered a bit too, but thankfully the house was OK.
A new spring gushes from the side of Haldon Hill on Valentine’s Day 2014
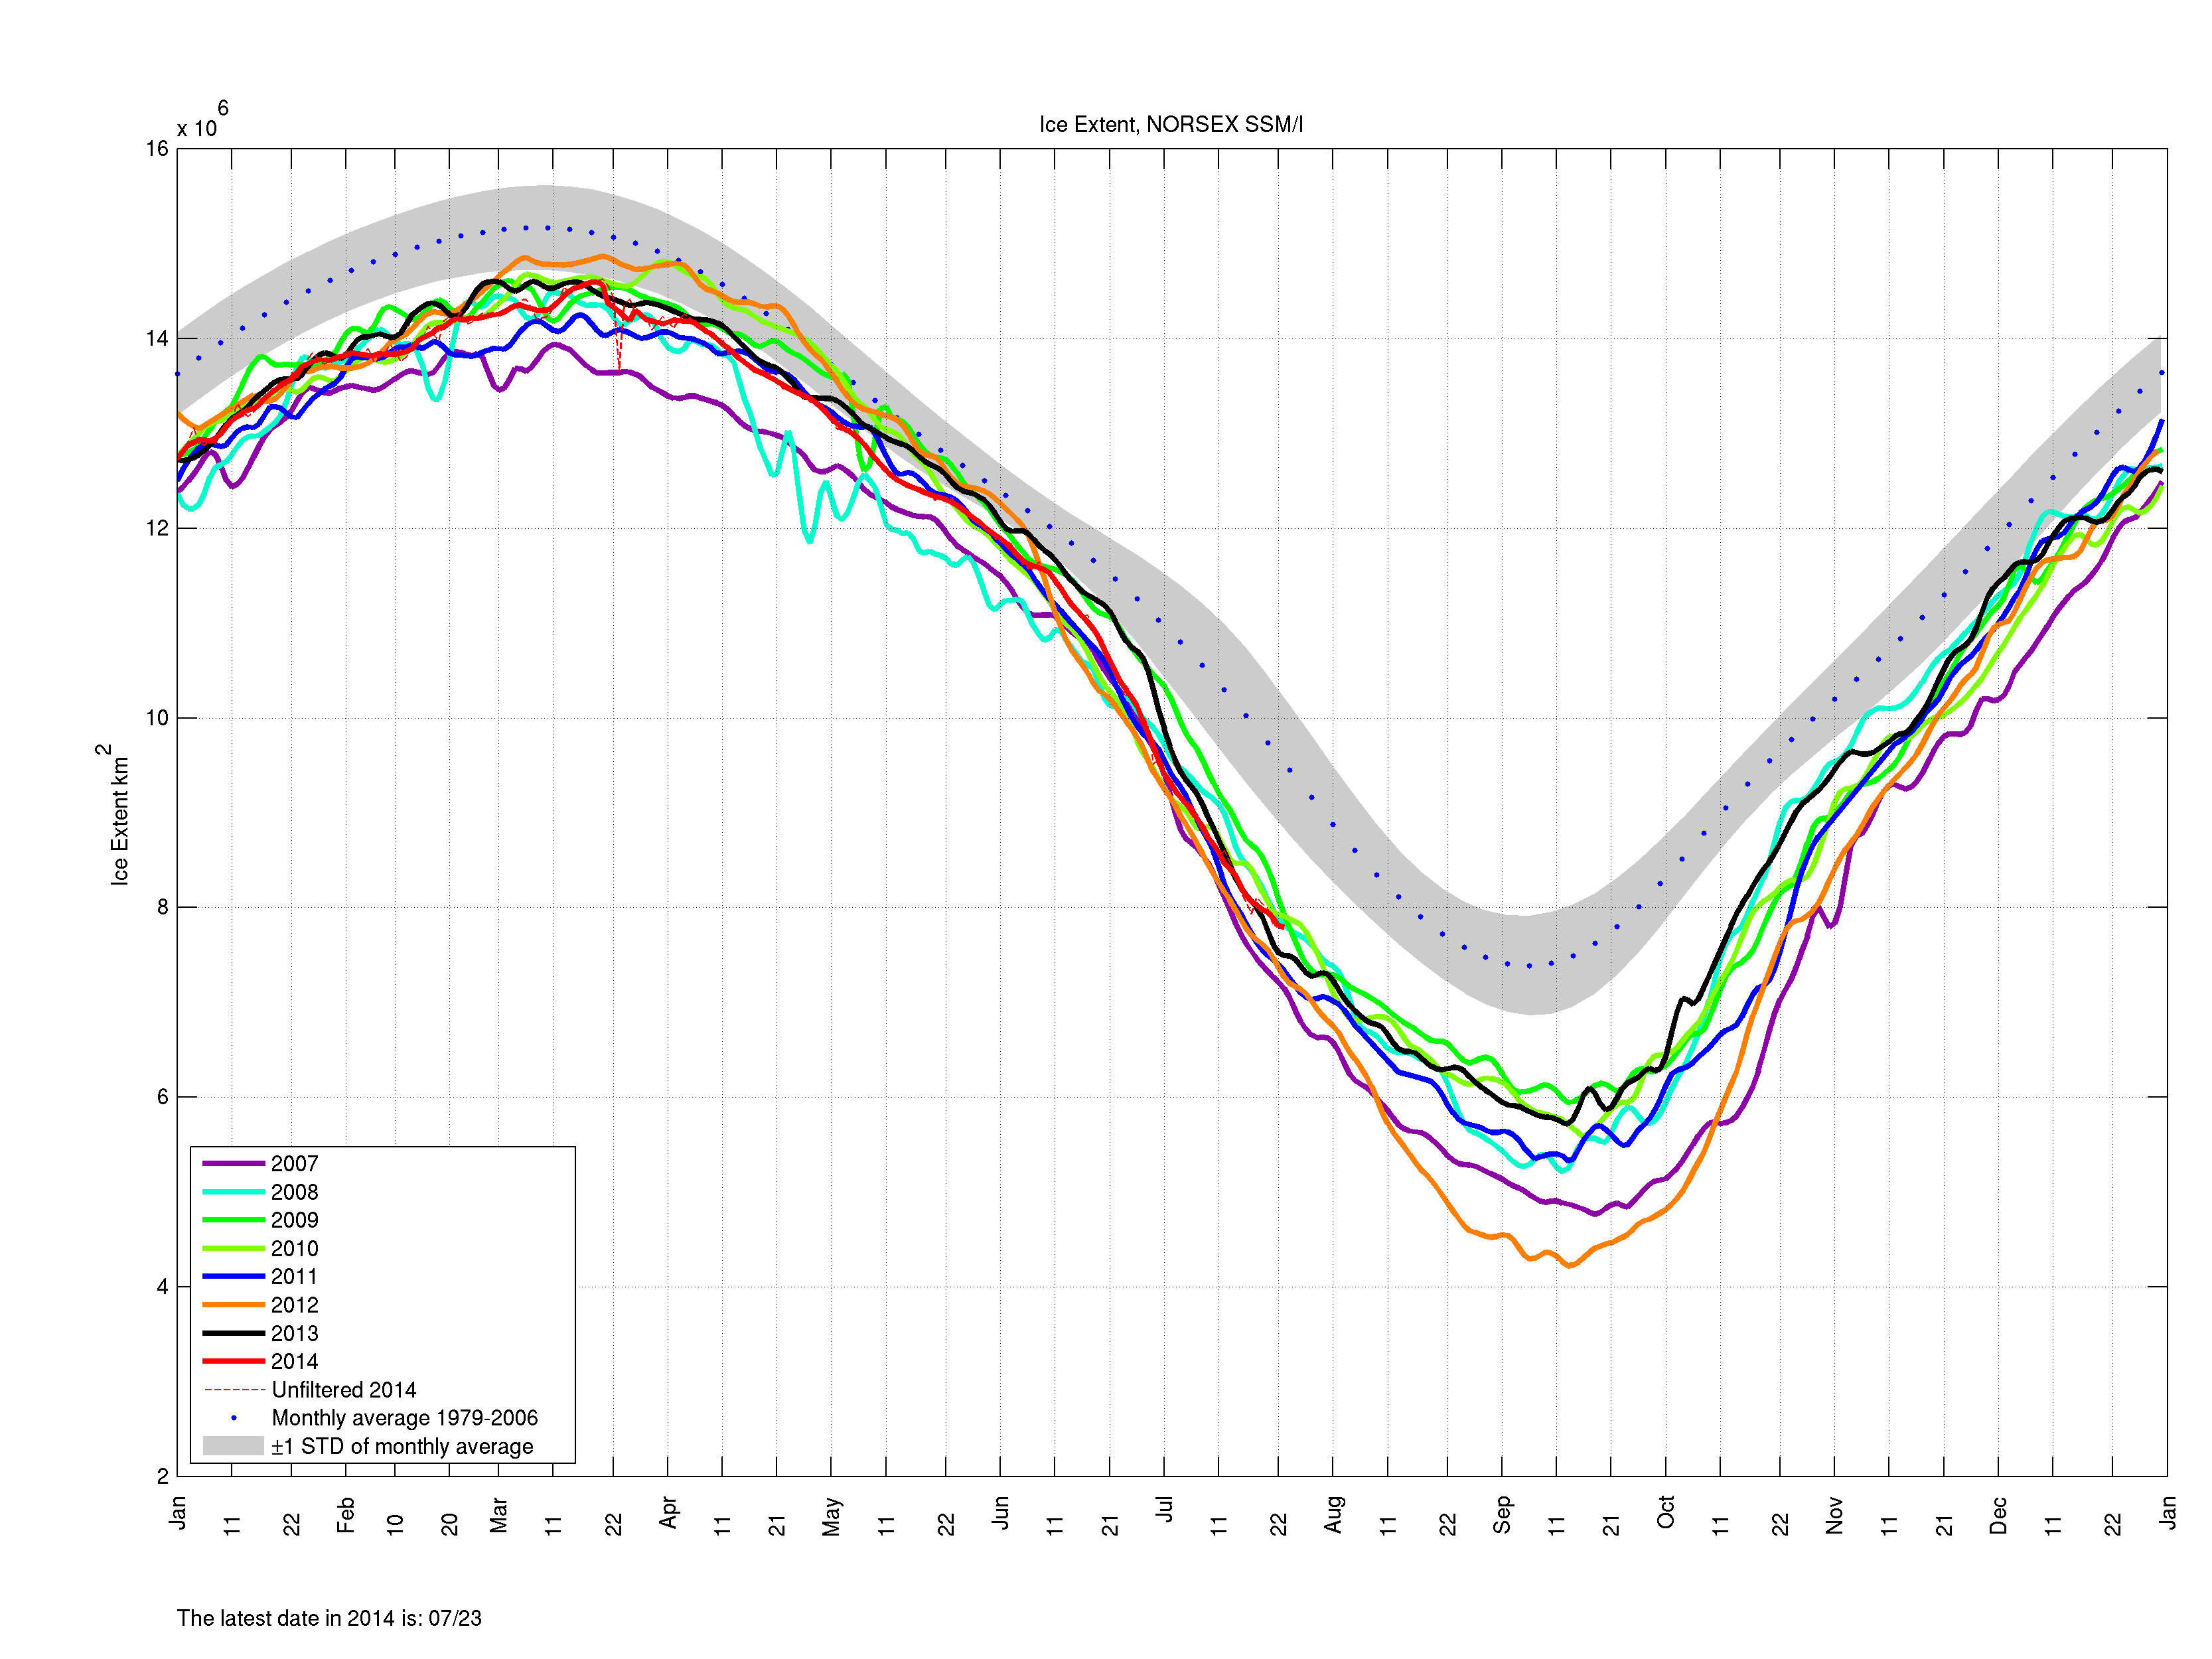
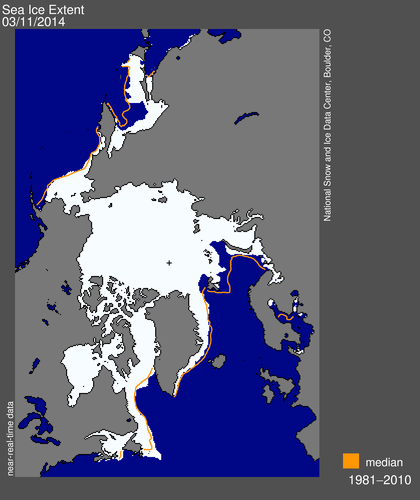
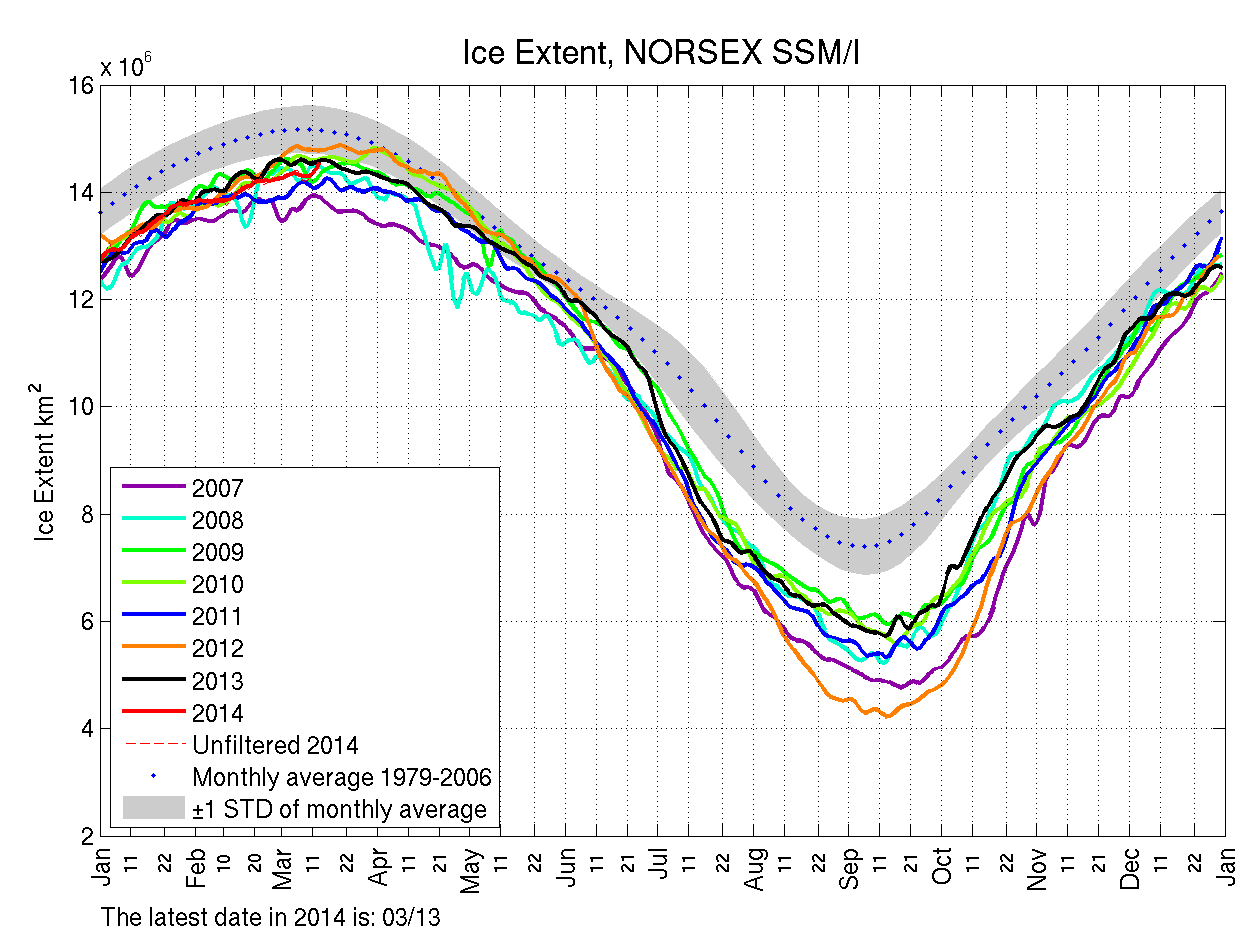
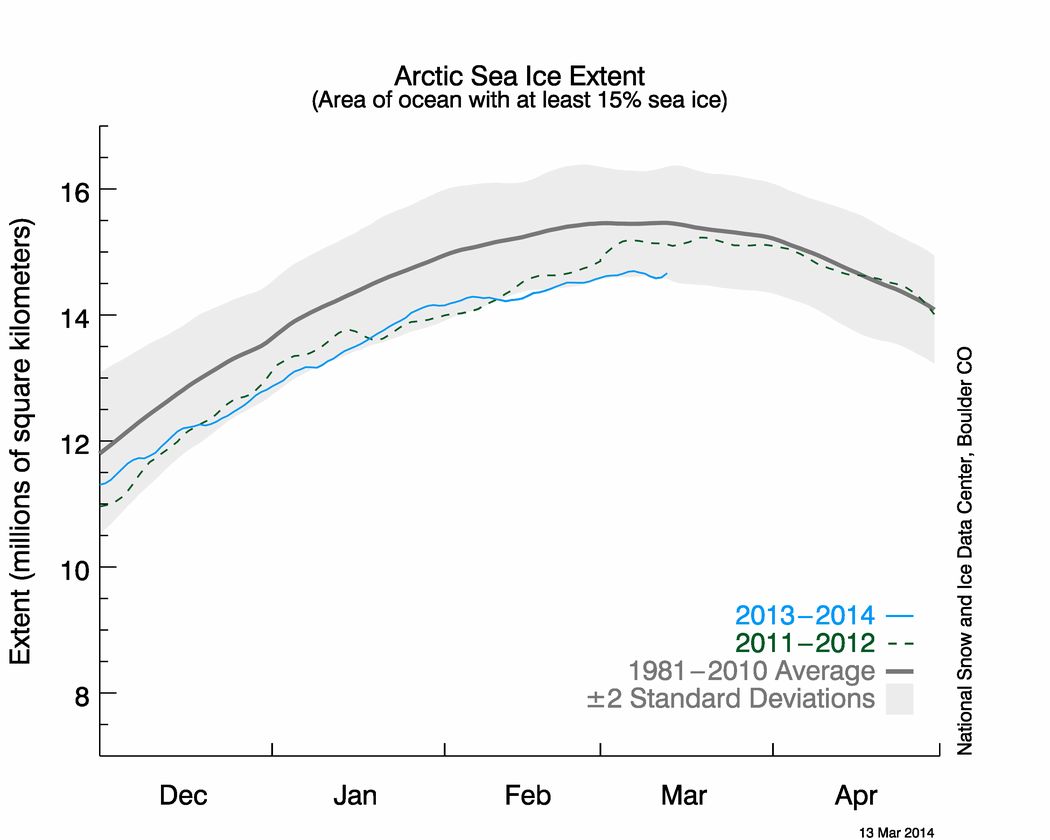
Regarding your own attachments, perhaps in the first instance you might ask your colleague to explain why he or she chooses to send you a NORSEX Arctic sea ice extent graph rather than one from the NSIDC, which I believe we established last summer is The Mail’s oracle on such matters? Please take a good look at the latest NSIDC equivalent to the Antarctic extent graph you sent me, which I attach for your convenience.
NSIDC Arctic sea ice extent graph for March 13th 2014
Whilst you’re at it perhaps you could also ask your colleague to answer at least the first three of these simple questions:
You may also wish to pass on to your colleague the shock news that earlier this week the daily atmospheric carbon dioxide readings from Mauna Loa rose above 400 ppm almost 2 months earlier than last year?
This website uses cookies to improve your experience. We'll assume you're ok with this, but you can opt-out if you wish. Cookie settingsACCEPT
Privacy & Cookies Policy
Privacy Overview
This website uses cookies to improve your experience while you navigate through the website. Out of these, the cookies that are categorized as necessary are stored on your browser as they are essential for the working of basic functionalities of the website. We also use third-party cookies that help us analyze and understand how you use this website. These cookies will be stored in your browser only with your consent. You also have the option to opt-out of these cookies. But opting out of some of these cookies may affect your browsing experience.
Necessary cookies are absolutely essential for the website to function properly. This category only includes cookies that ensures basic functionalities and security features of the website. These cookies do not store any personal information.
Any cookies that may not be particularly necessary for the website to function and is used specifically to collect user personal data via analytics, ads, other embedded contents are termed as non-necessary cookies. It is mandatory to procure user consent prior to running these cookies on your website.
I do appreciate you demonstrating so graphically the dissonance and dishonesty of climate alarmists.