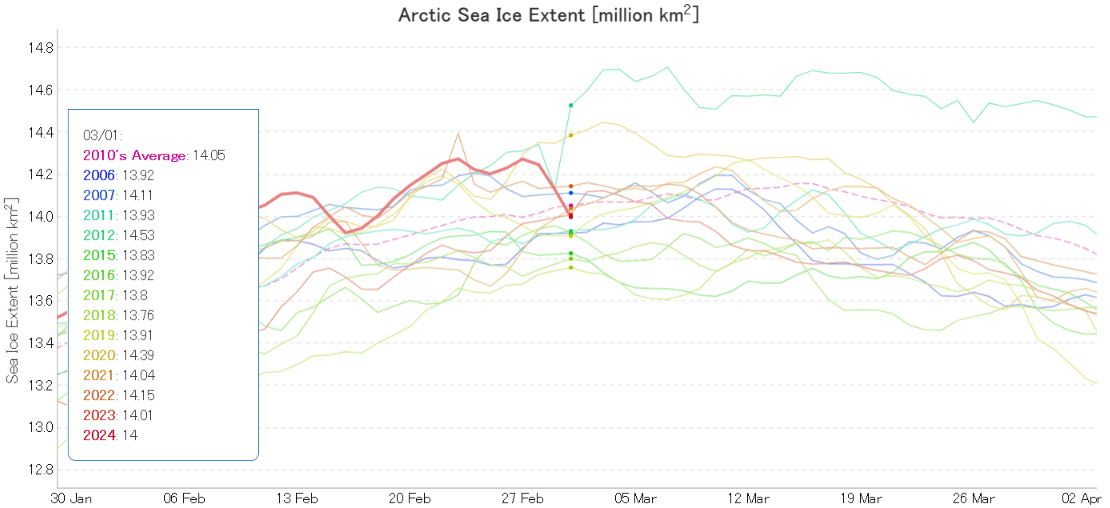
It looks as though the 2024 Arctic sea ice melting season has begun. For much greater detail see the 2024 maximum extent thread. However, here’s the latest JAXA Arctic sea ice extent graph:
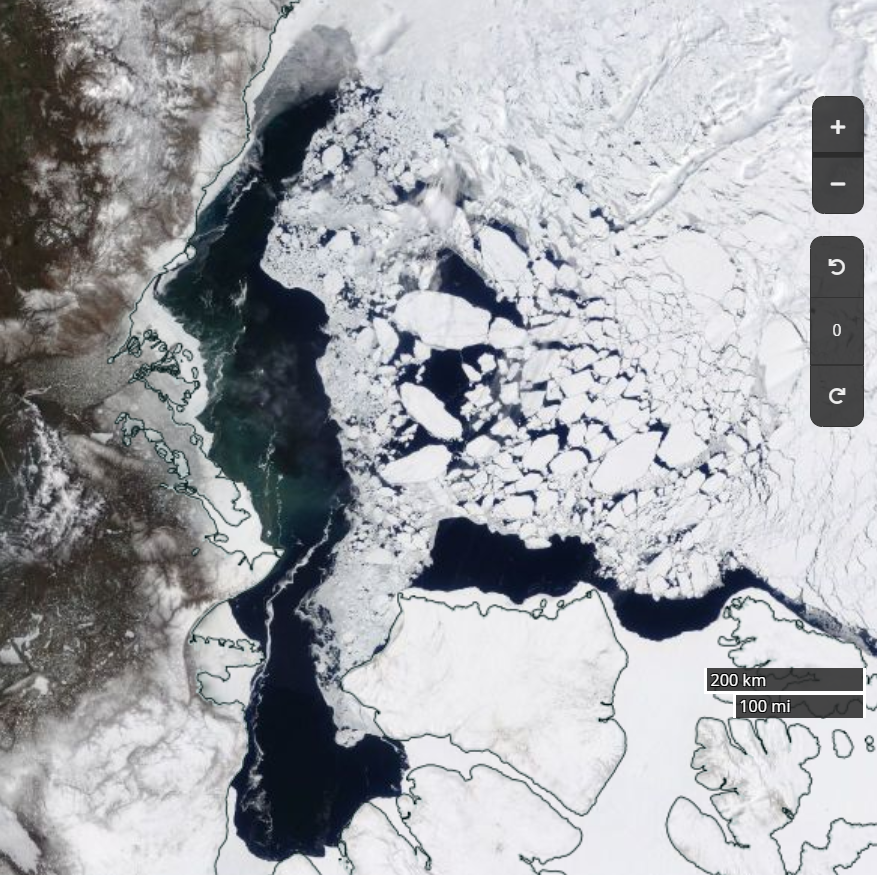
Here too is an animation of sea ice motion on the Atlantic periphery, showing the effect of the passage of several Arctic cyclones through the area over the past 5 weeks or so:
[Update – March 4th]
My usual start of month processing hasn’t gone according to plan. Thanks to Lars Kaleschke at the Alfred Wegener Institute for the following information:
SMOS went into safe mode on 22 February 2024 at 05:10 UTC for reasons that are still under investigation.
The spacecraft has been back in nominal mode since 25 February 2024 and on 27 February 2024, the MIRAS instrument was switched on and is currently performing well.
The reload of the nominal acquisition planning is underway, and if all science data quality checks are positive, nominal data production and dissemination will resume in the coming days.
Inspired by my recent visits to Judith Curry’s blog this post will bring you links to the latest learned journal articles about Arctic sea ice. Together with occasional excursions into older and wider Arctic papers.
Judith’s “Week in Review” articles seem to last for a month, so this one will probably last for at least a year!
First up is an article apparently written by a regular reader of this humble web site! A University of Alaska article at phys.org begins:
In August 2016 a massive storm on par with a Category 2 hurricane churned in the Arctic Ocean. The cyclone led to the third-lowest sea ice extent ever recorded. But what made the Great Arctic Cyclone of 2016 particularly appealing to scientists was the proximity of the Korean icebreaker Araon.
For the first time ever, scientists were able to see exactly what happens to the ocean and sea ice when a cyclone hits. University of Alaska Fairbanks researchers and their international colleagues recently published a new study showing that sea ice declined 5.7 times faster than normal during the storm. They were also able to prove that the rapid decline was driven by cyclone-triggered processes within the ocean.
Note that it didn’t take us 5 years to write about the cyclone in question. Our article catchily entitled “The Great Arctic Cyclone of 2016” was published on August 13th 2016:
A storm is brewing in the Arctic. A big one! The crew of the yacht Northabout are currently sailing along the western shore of the Laptev Sea and reported earlier today that “The sea is calm. Tomorrow a gale 8. But this moment is perfect”.
That perfect moment will not last long.
I interviewed polar explorer David Hempleman-Adams about the succeeding moments once Northabout had returned to the UK. It seems riding out the cyclone was the most frightening experience he had ever had.
The University of Alaska article references the following peer reviewed paper:
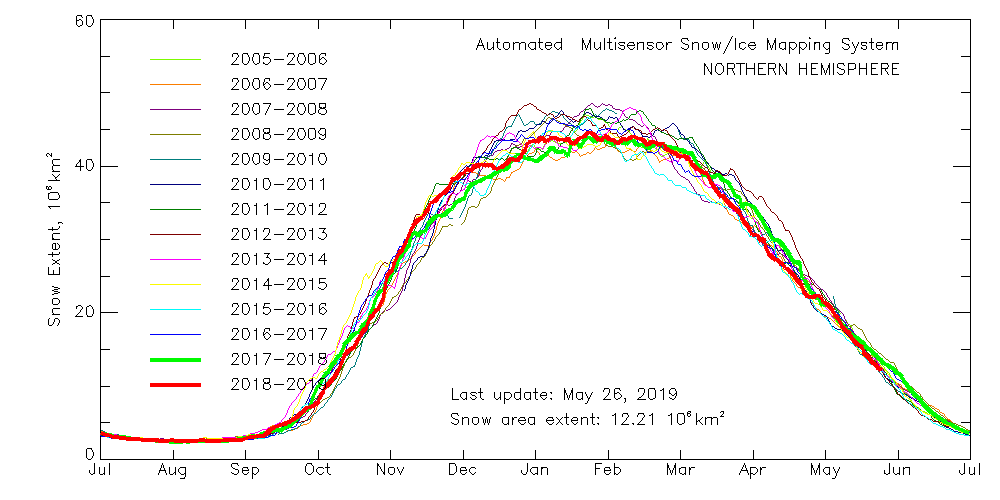
A couple of years ago I was asked to provide “a handful of things [you] will be keeping an eye on over the next few months to judge how ‘good’ or ‘bad’ the melt is going?”
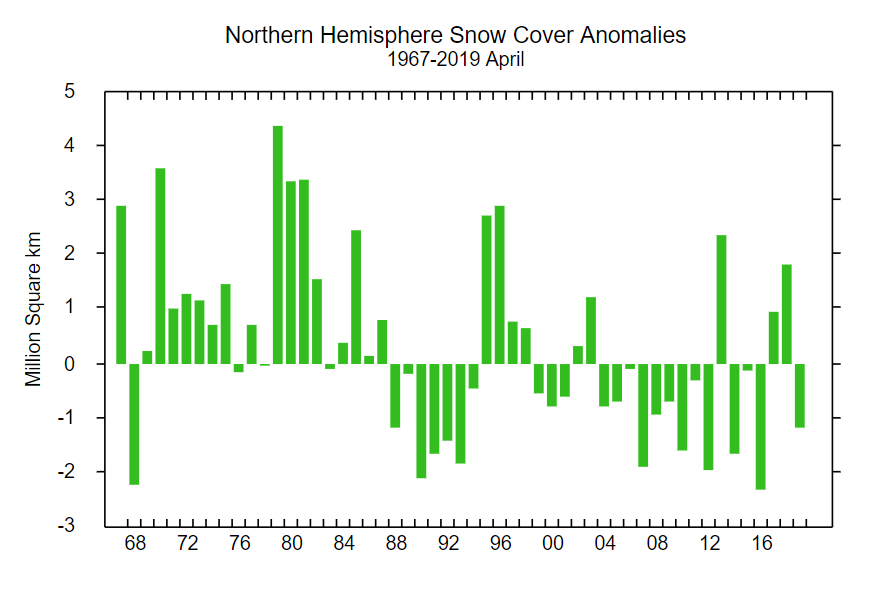
That suggests snow cover over land is close to recent lows, which is confirmed by the Rutgers University snow cover anomaly graph for April:
This year is anomalously low, but not by as much as 2012 and 2016. For completeness, here also is the current US National Ice Center snow cover map:
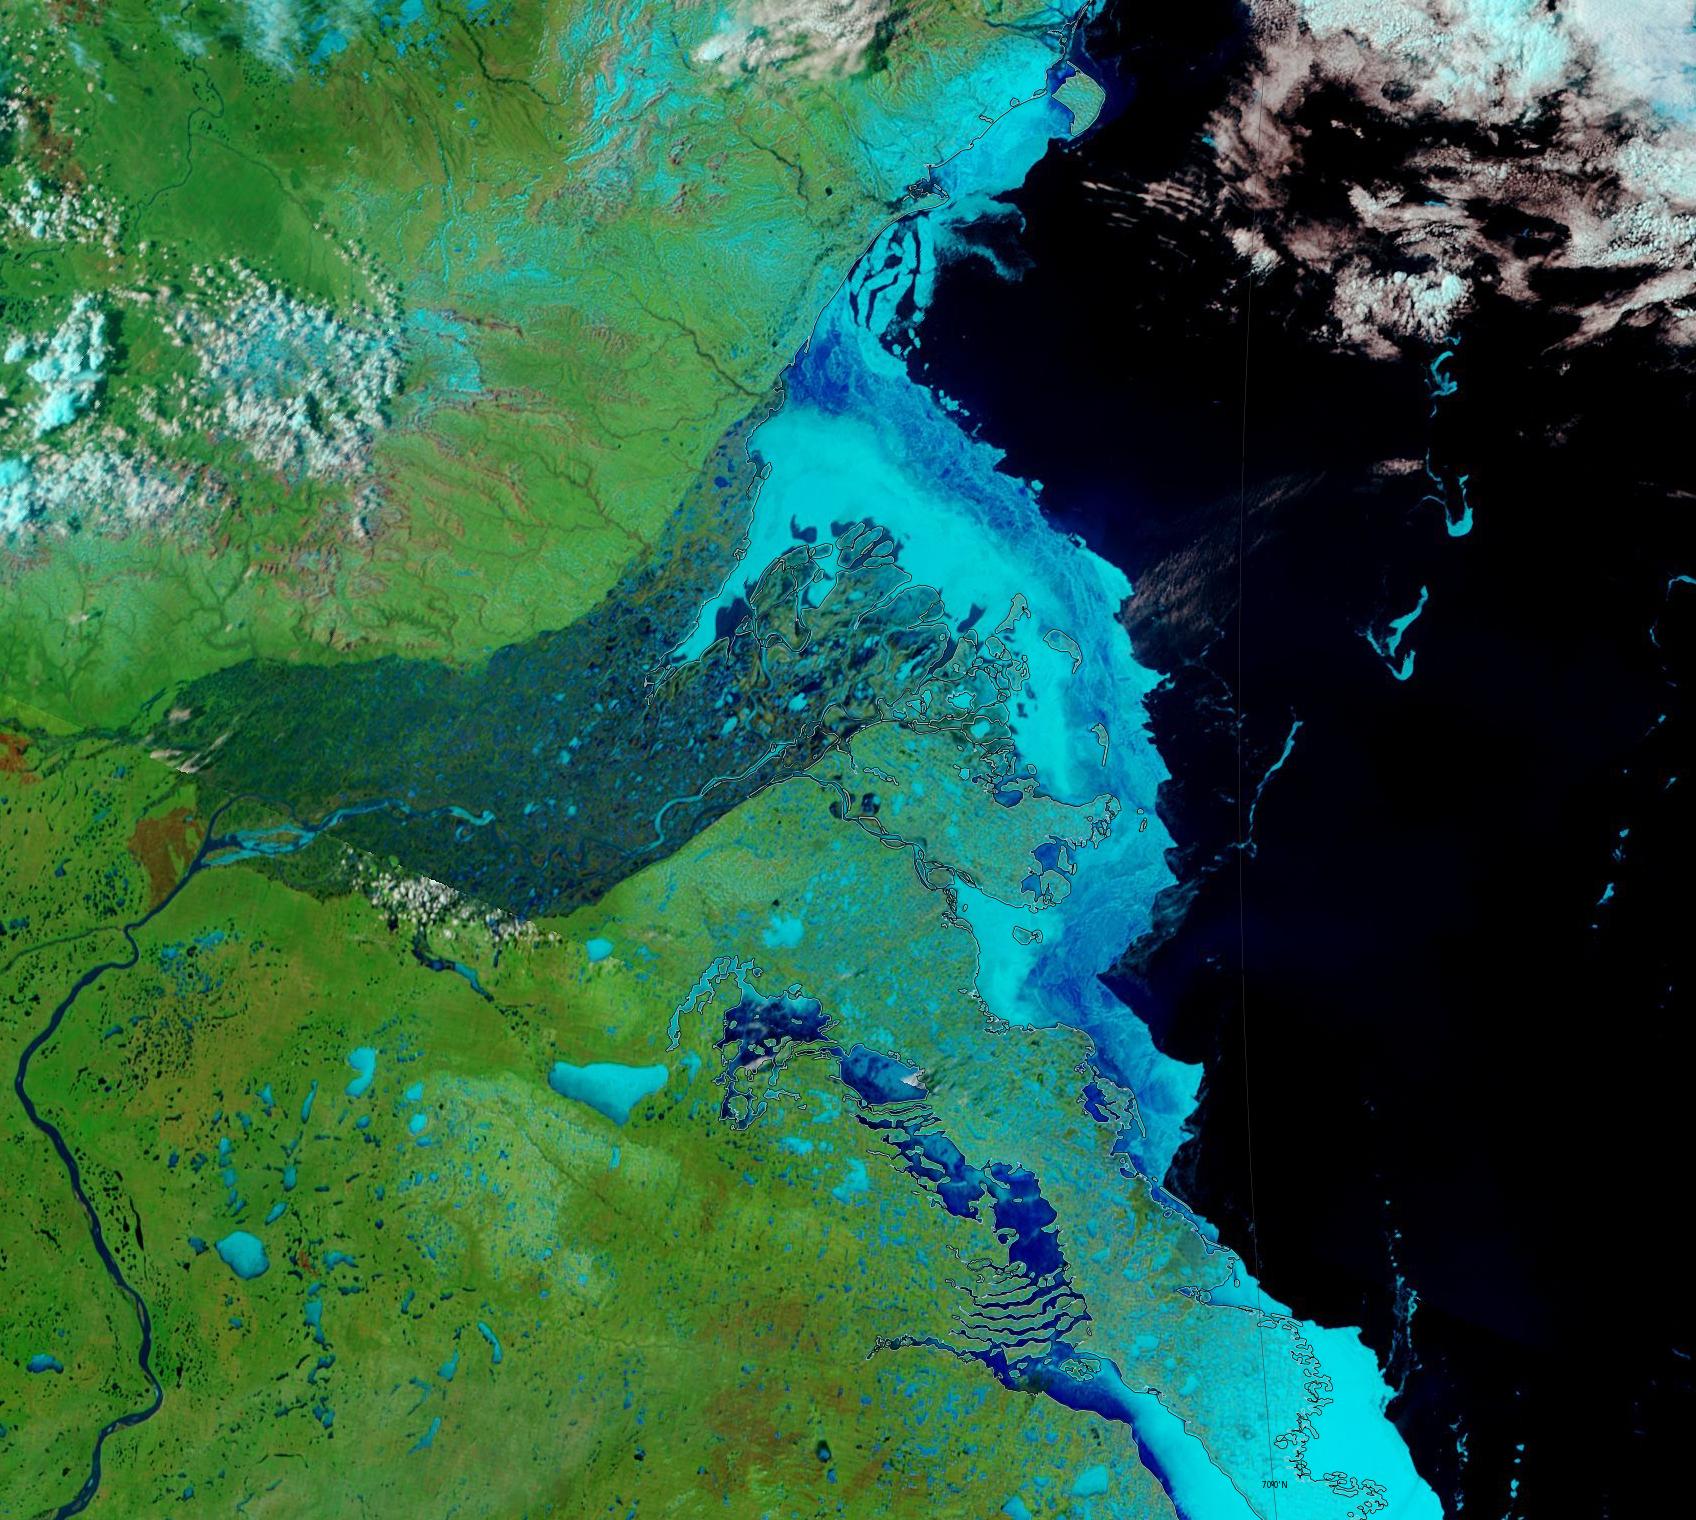
Moving on to melt ponds, there are plenty to be seen on the fast ice around the Mackenzie river delta:
NASA Worldview “false-color” image of the Mackenzie Delta on May 24th 2019, derived from the MODIS sensor on the Terra satellite
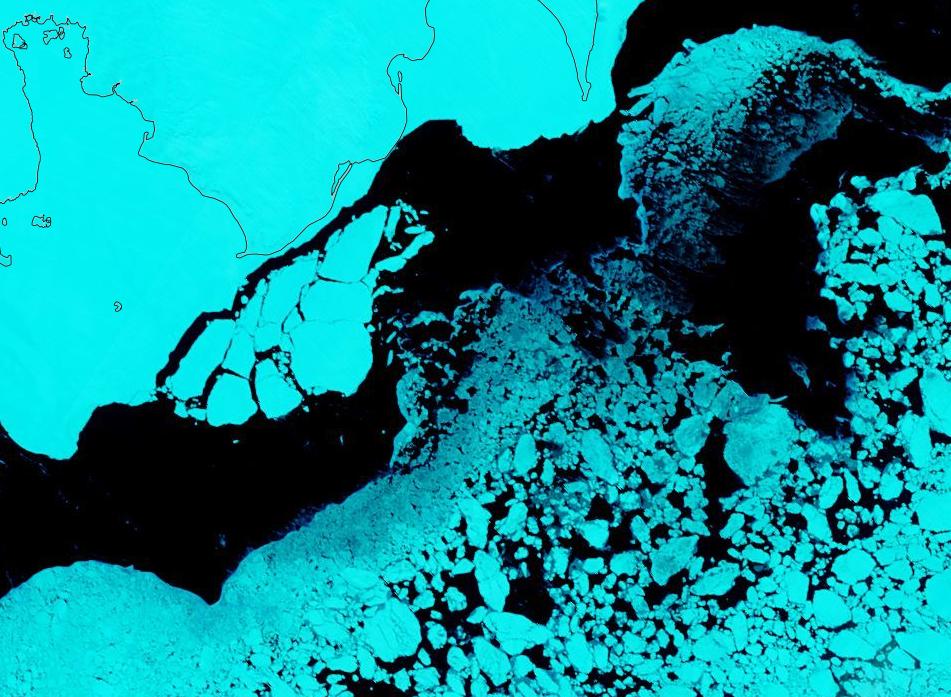
There also seem to be signs of some at a higher latitude off Ostrov Kotelny in the New Siberian Islands:
NASA Worldview “false-color” image of the Laptev Sea on May 23rd 2019, derived from the MODIS sensor on the Terra satellite
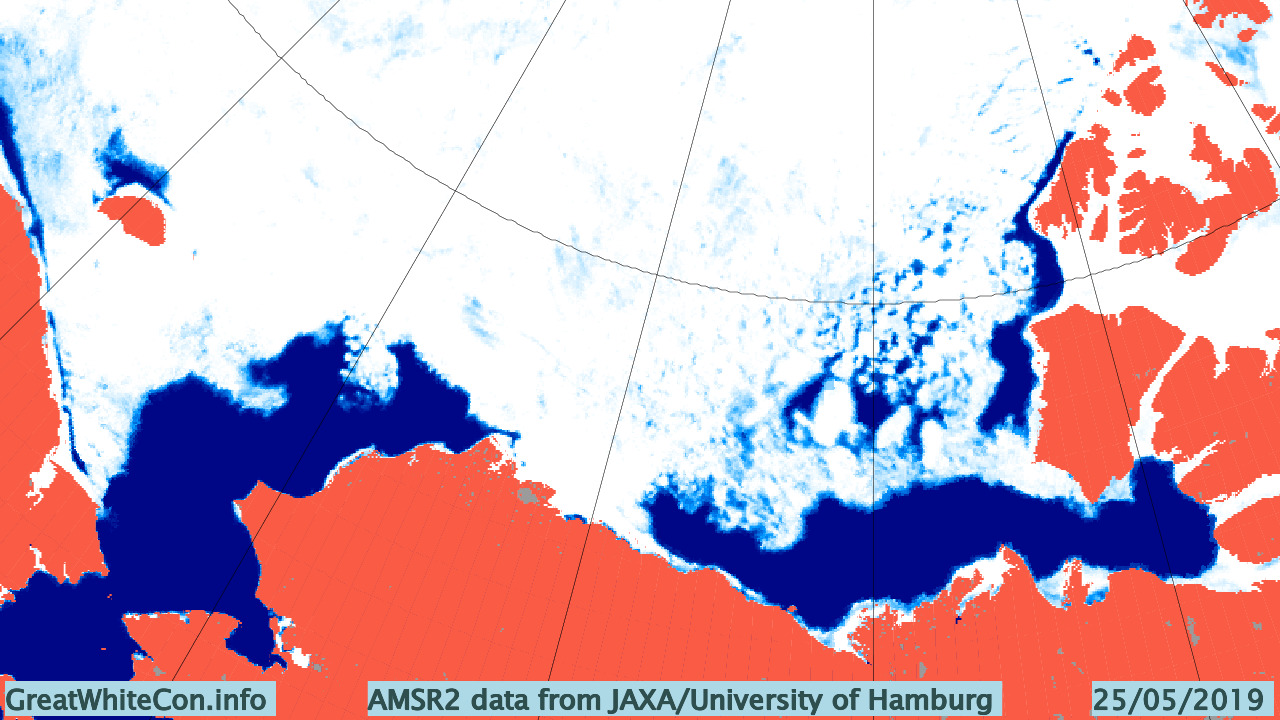
This year there is also a lot of open water in the Chukchi Sea, and almost no sea ice left in the Bering Sea:
Compared with 2016 at the same time of year I am compelled to say that with June 1st just around the corner the 2019 summer melting season is primed to progress more quickly.
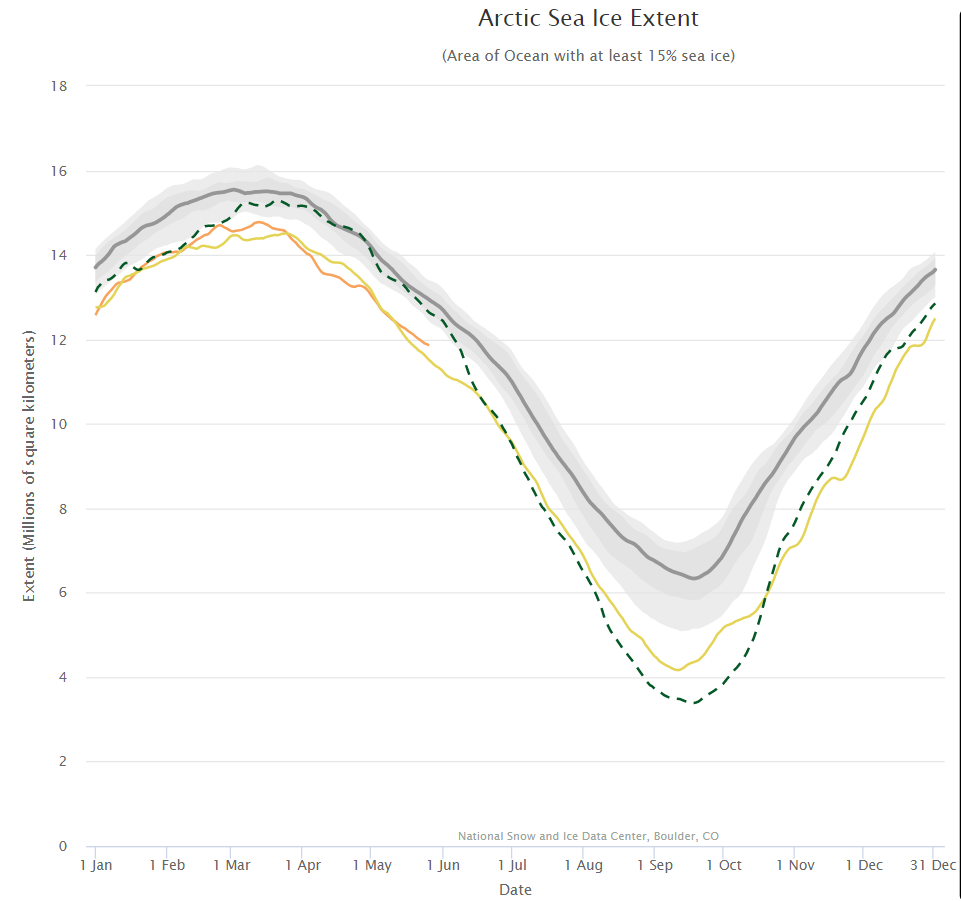
The next obvious comparison to make is with the (in)famous year of 2012, which resulted in the lowest ever minimum extent in the satellite record. Firstly let’s look at the National Snow and Ice Data Center’s graph of Arctic sea ice extent:
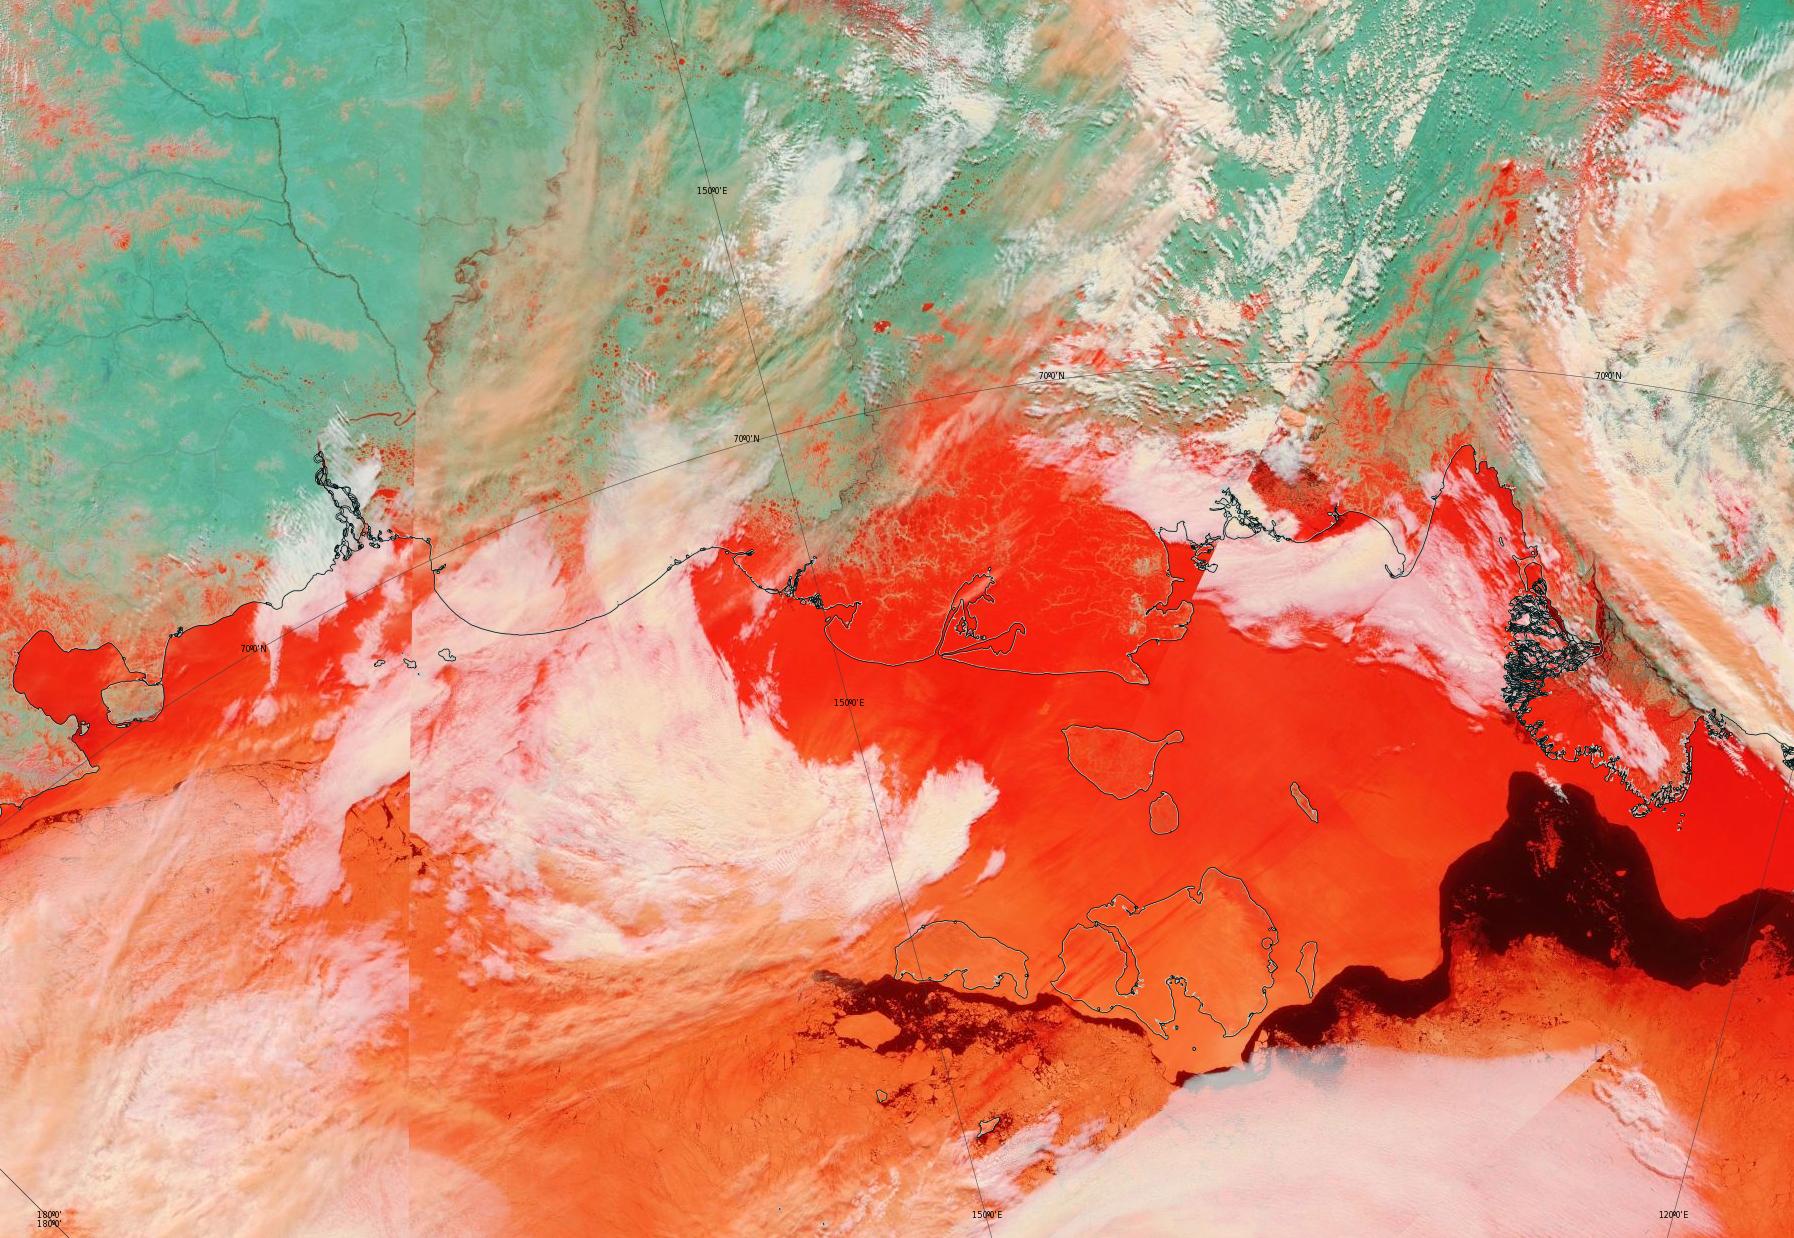
Currently extent is significantly below 2012, albeit somewhat above 2016 at the same time of year. And what of melt ponds? In 2012 there was evidence of less snow cover over land and more surface water on the ice on the Siberian side of the Arctic:
NASA Worldview “false-color” image of the Eastern Arctic on May 25th 2012, derived from the MODIS sensor on the Terra satellite
Other than that Arctic sea ice in 2019 looks to be in worse shape than in 2012.
[Edit – May 27th]
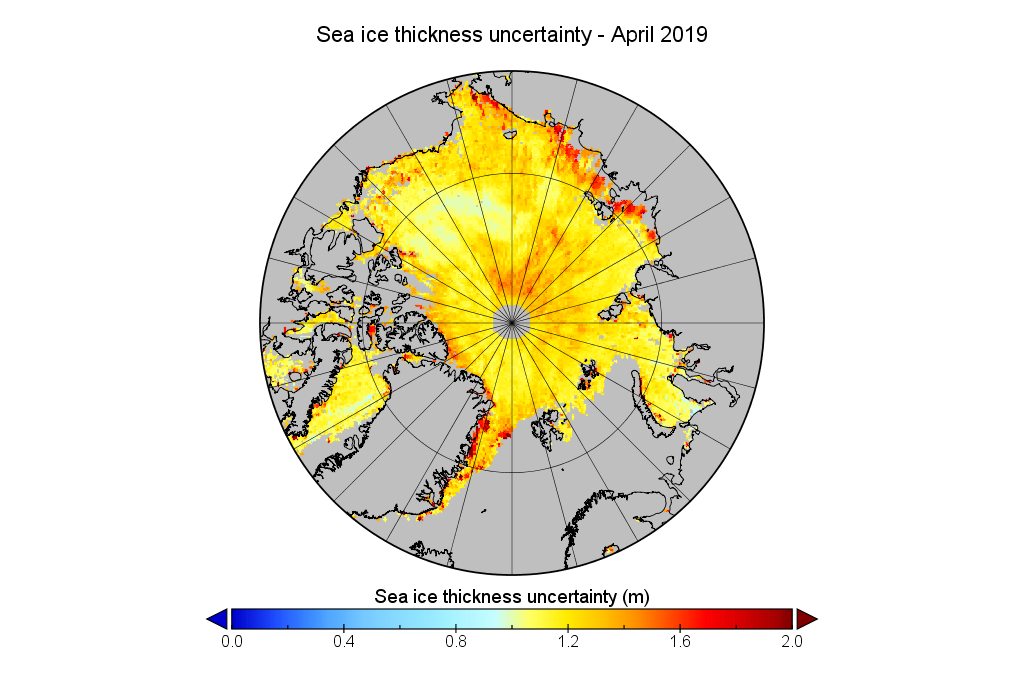
We’ve established that the extent of Arctic sea ice at the end of May 2019 is less than in 2012, but something else to consider is whether that ice is currently thicker than in 2012, or not. Satellites can have a reasonable stab at measuring the area of sea ice, but the third dimension is much trickier. The European Space Agency’s CryoSat-2 satellite has been attempting to measure sea ice thickness since 2010, so let’s take at the conclusions it has reached:
Don’t forget to take a good long look at the associated uncertainties too:
The Zachariæ Isstrøm glacier in North East Greenland is in the news at the moment. Here’s a recent article from The Guardian for example, which states that:
A major glacier in Greenland that holds enough water to raise global sea levels by half a metre has begun to crumble into the North Atlantic Ocean, scientists say. The calving of the glacier into chunks of floating ice will set in train a rise in sea levels that will continue for decades to come, the US team warns.
“Even if we have some really cool years ahead, we think the glacier is now unstable,” said Jeremie Mouginot at the University of California, Irvine. “Now this has started, it will continue until it retreats to a ridge about 30km back which could stabilise it and perhaps slow that retreat down.”
Mouginot and his colleagues drew on 40 years of satellite data and aerial surveys to show that the enormous Zachariae Isstrom glacier began to recede three times faster from 2012, with its retreat speeding up by 125 metres per year every year until the most recent measurements in 2015.
The same records revealed that from 2002 to 2014 the area of the glacier’s floating shelf shrank by a massive 95%, according to a report in the journal Science. The glacier has now become detached from a stabilising sill and is losing ice at a rate of 4.5bn tonnes a year.
Eric Rignot, professor of Earth system science at the University of California, Irvine, said that the glacier was “being hit from above and below”, with rising air temperatures driving melting at the top of the glacier, and its underside being eroded away by ocean currents that are warmer now than in the past.
“The glacier is now breaking into bits and pieces and retreating into deeper ground,” he said. The rapid retreat is expected to continue for 20 to 30 more years, until the glacier reaches another natural ledge that slows it down.
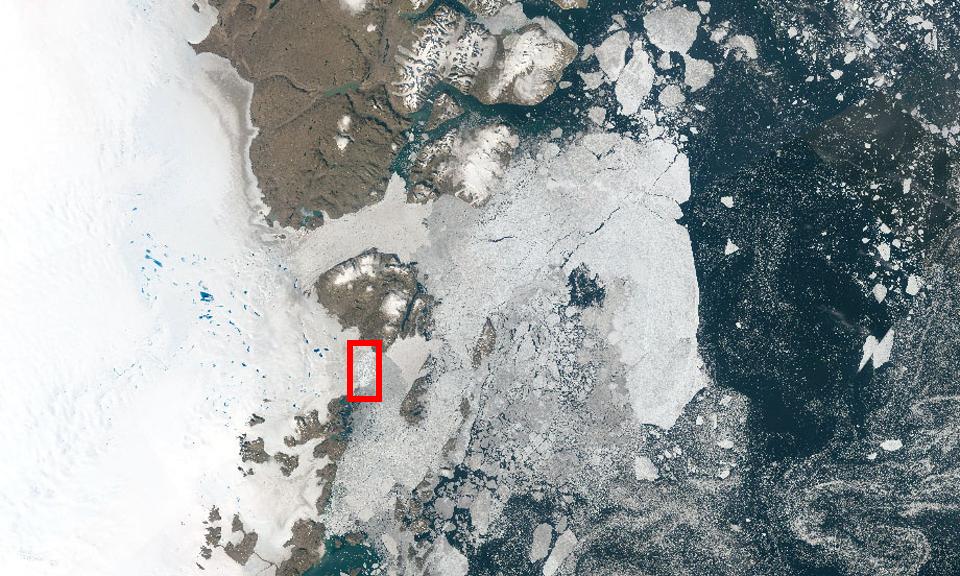
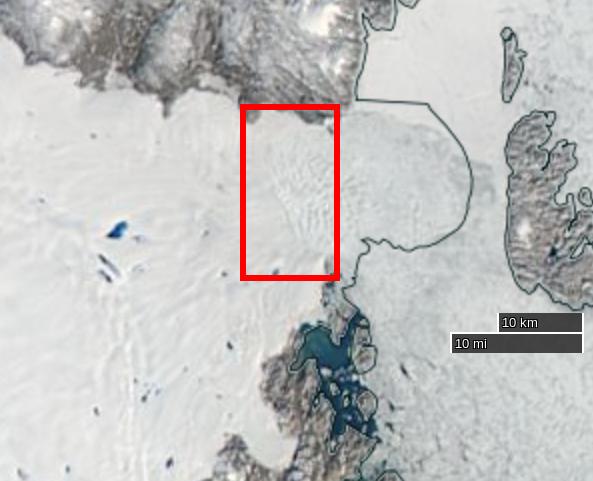
The Guardian article includes a picture of Zachariæ Isstrøm, along with much of the rest of North East Greenland. Here it is again, together with a helpful annotation revealing the location of the calving face of Zachariæ Isstrøm in amongst all the snow and ice:
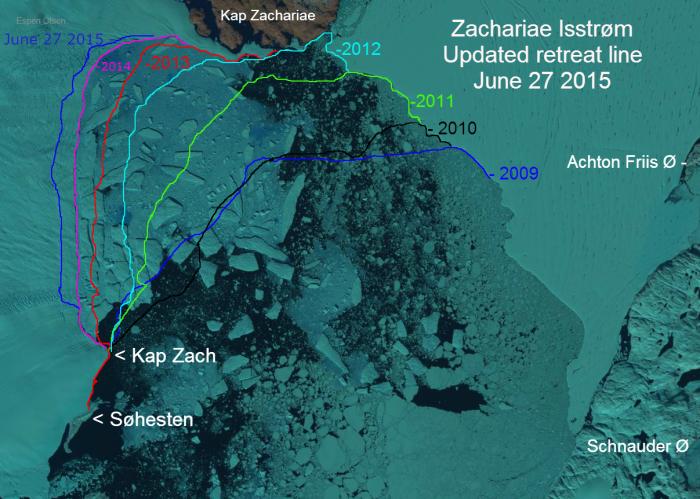
That’s still not really much help when it comes to visualising the “retreat speeding up by 125 metres per year”, so here’s a closer look at Zachariae Isstrom using an image prepared by Espen Olsen for the Arctic Sea Ice Forum, which is based on a Landsat 8 satellite image from September 2014:
Retreat of the calving face of the Zachariae Isstrøm glacier between 2009 and 2015
North East Greenland is in the dark at the moment, but if you want to take a closer look at recent changes to Zachariæ Isstrøm for yourself you can do so with the aid of NASA’s EOSDIS Worldview web site, which allows you to scroll through images from both the Aqua and Terra satellites. Here’s one from August 26th 2015:
NASA Worldview “true-color” image of the Zachariae Isstrøm glacier on August 26th 2015, derived from the MODIS sensor on the Aqua satellite
Our headline for today announces that yet another large chunk of ice has just detached itself from Zachariæ Isstrøm. You may wonder how we can be so sure of that when it’s dark in North East Greenland? That’s because yet another satellite can “see” in the dark, using synthetic aperture radar. Here’s an animation prepared earlier today by “Wipneus” using data from the European Space Agency’s Sentinel 1A satellite, once again for the Arctic Sea Ice Forum:
Animated comparison of Sentinel 1A visualisations of the Zachariae Isstrøm calving face on 4th and 16th November 2015
Can you spot “The new iceberg [that] seems to lie on its side”?
The conclusion to all this frantic activity, according to Mouginot, Rignot et al. at least, is that:
The Zachariæ Isstrøm / Nioghalvfjerdsfjorden sector is one of three major marine-based basins in Greenland along with the Jakobshavn Isbræ and Petermann–Humboldt glaciers, each holding a 0.6-m sea-level equivalent. Jakobshavn Isbræ started a rapid retreat (18 km in 2001-2015) following the collapse of its ice shelf and has undergone massive calving events since 2010. The central channel of the Petermann ice shelf lost 250 m of ice in 2002-2010, and the ice front retreated 33 km in 2010-2012. The Nioghalvfjerdsfjorden ice shelf will become vulnerable to break up in the near future if thinning continues. These observations combined suggest that all three major marine-based basins are undergoing significant changes at present. Jakobshavn Isbræ and Zachariæ Isstrøm have already transitioned to tidewater glacier regime, with increased calf-ice production and ice melting by the ocean. The retreat of these marine-based sectors is likely to increase sea-level rise from Greenland for decades to come.
This website uses cookies to improve your experience. We'll assume you're ok with this, but you can opt-out if you wish. Cookie settingsACCEPT
Privacy & Cookies Policy
Privacy Overview
This website uses cookies to improve your experience while you navigate through the website. Out of these, the cookies that are categorized as necessary are stored on your browser as they are essential for the working of basic functionalities of the website. We also use third-party cookies that help us analyze and understand how you use this website. These cookies will be stored in your browser only with your consent. You also have the option to opt-out of these cookies. But opting out of some of these cookies may affect your browsing experience.
Necessary cookies are absolutely essential for the website to function properly. This category only includes cookies that ensures basic functionalities and security features of the website. These cookies do not store any personal information.
Any cookies that may not be particularly necessary for the website to function and is used specifically to collect user personal data via analytics, ads, other embedded contents are termed as non-necessary cookies. It is mandatory to procure user consent prior to running these cookies on your website.