Tag Archives: Area

Shock News! The Worms Have Turned!!

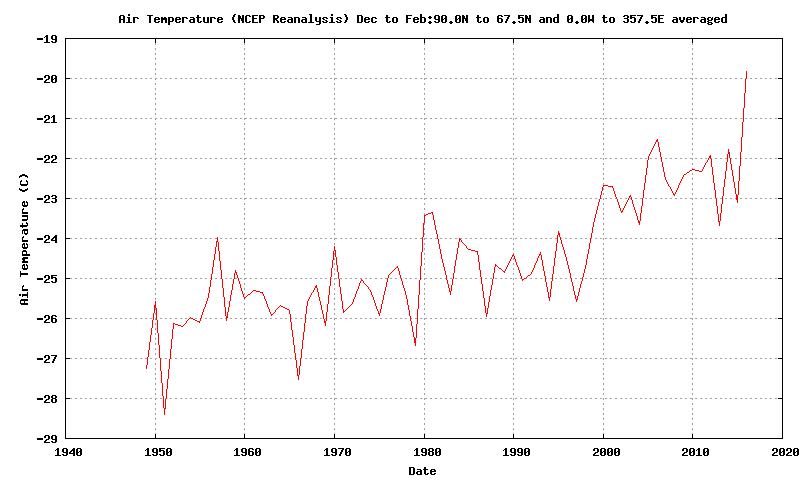
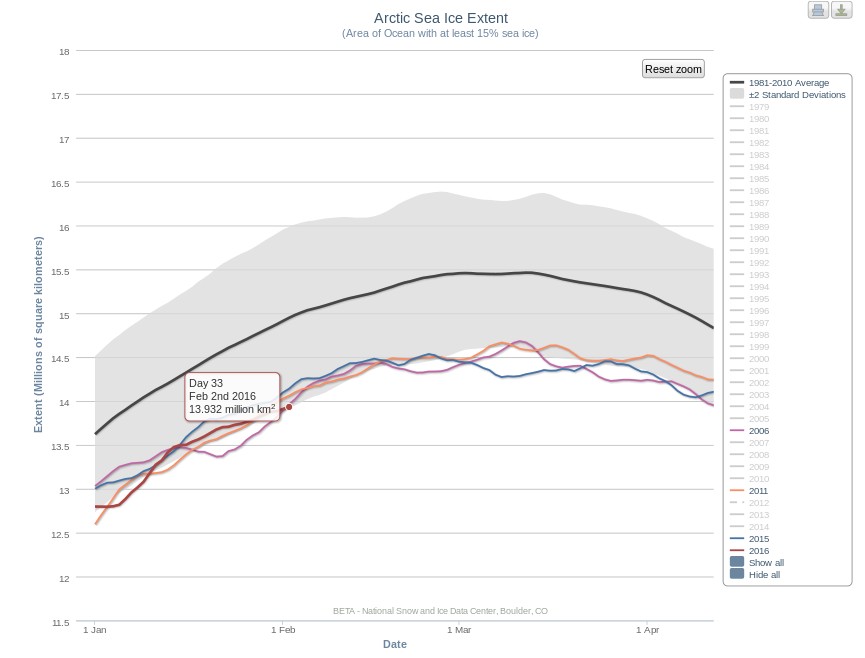
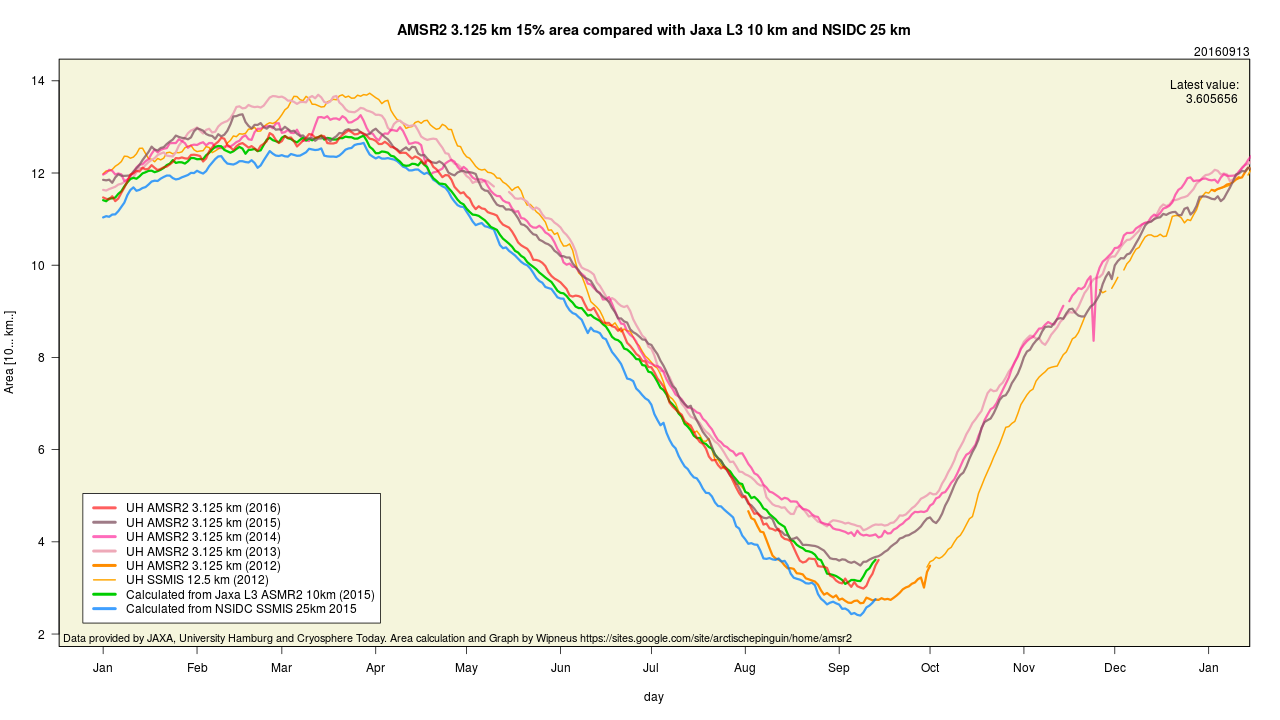
Today we bring a positive plethora of “Shock News!”. Starting with sea ice, yesterday Anthony Watts published an article on WUWT about the 2016 Arctic minimum extent. That’s not too surprising perhaps, but what’s shocking is that included one of Wipneus’ graphs of Arctic sea ice AREA that has been gracing our very own Arctic Sea Ice Graphs page since Anthony mocked us for not having such a thing. His take on this momentous event?

All of the data I’ve looked at agrees, Arctic sea ice is now on the upswing, and in a big way.

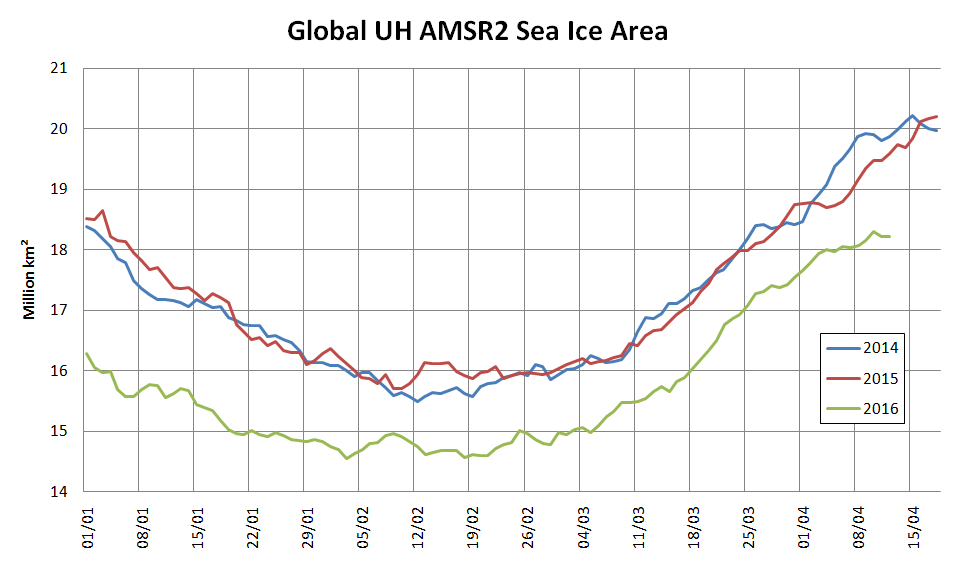
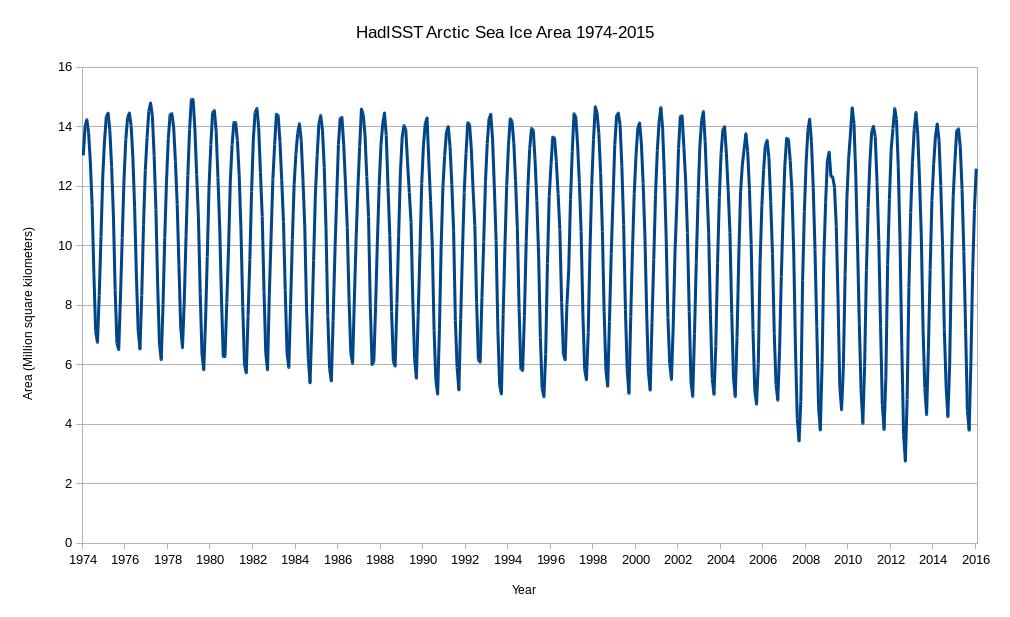
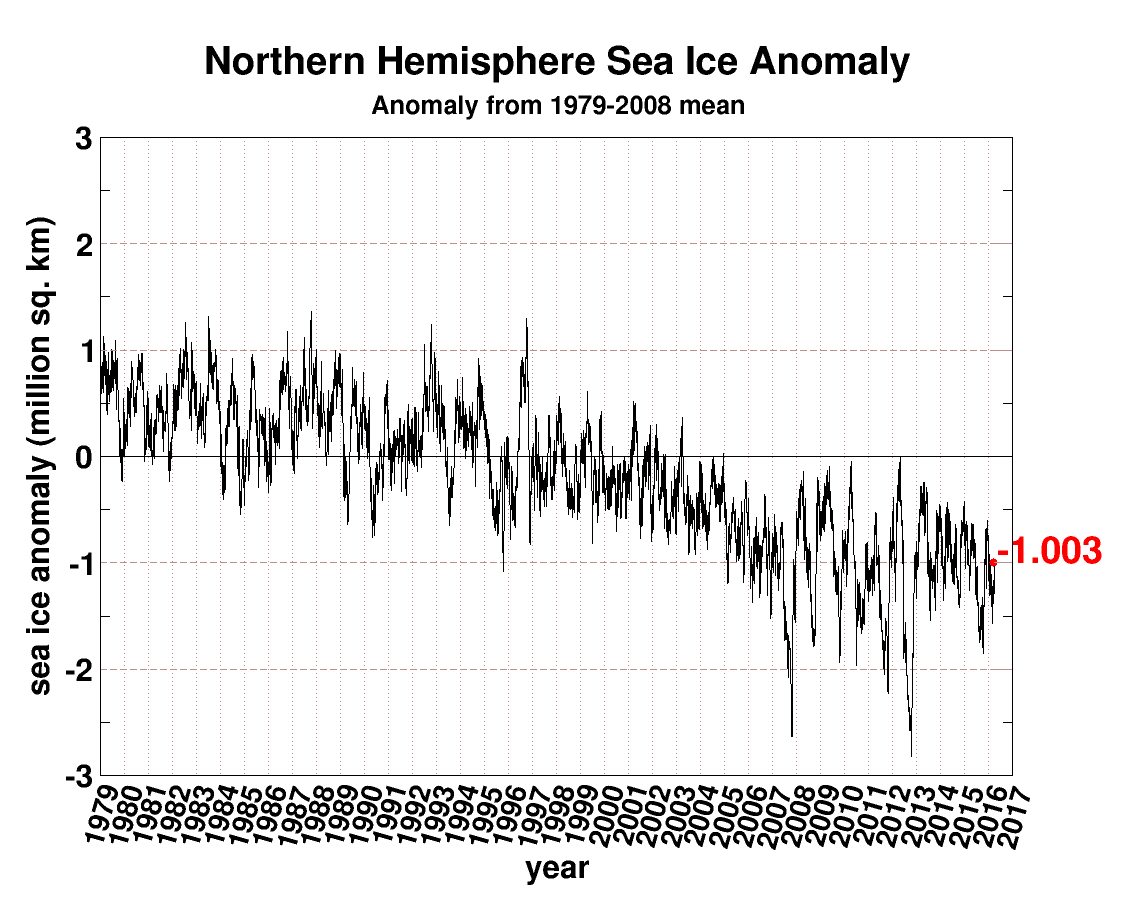
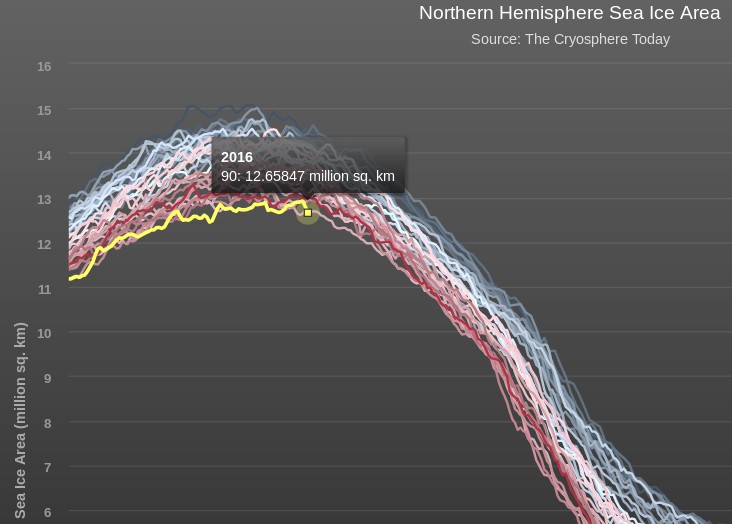
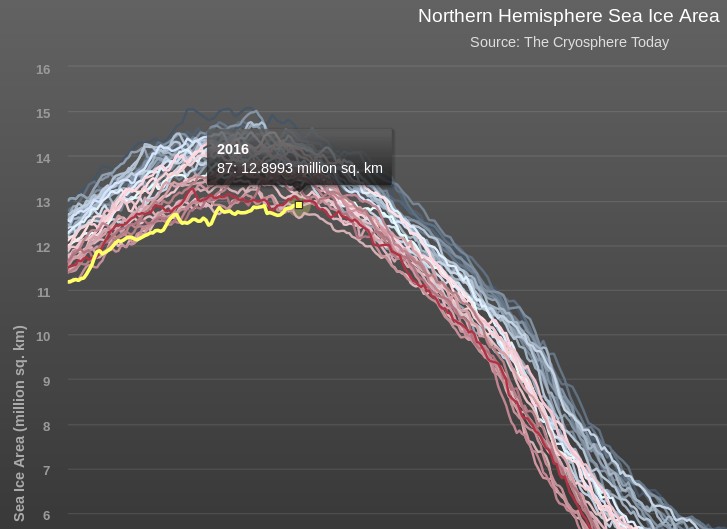
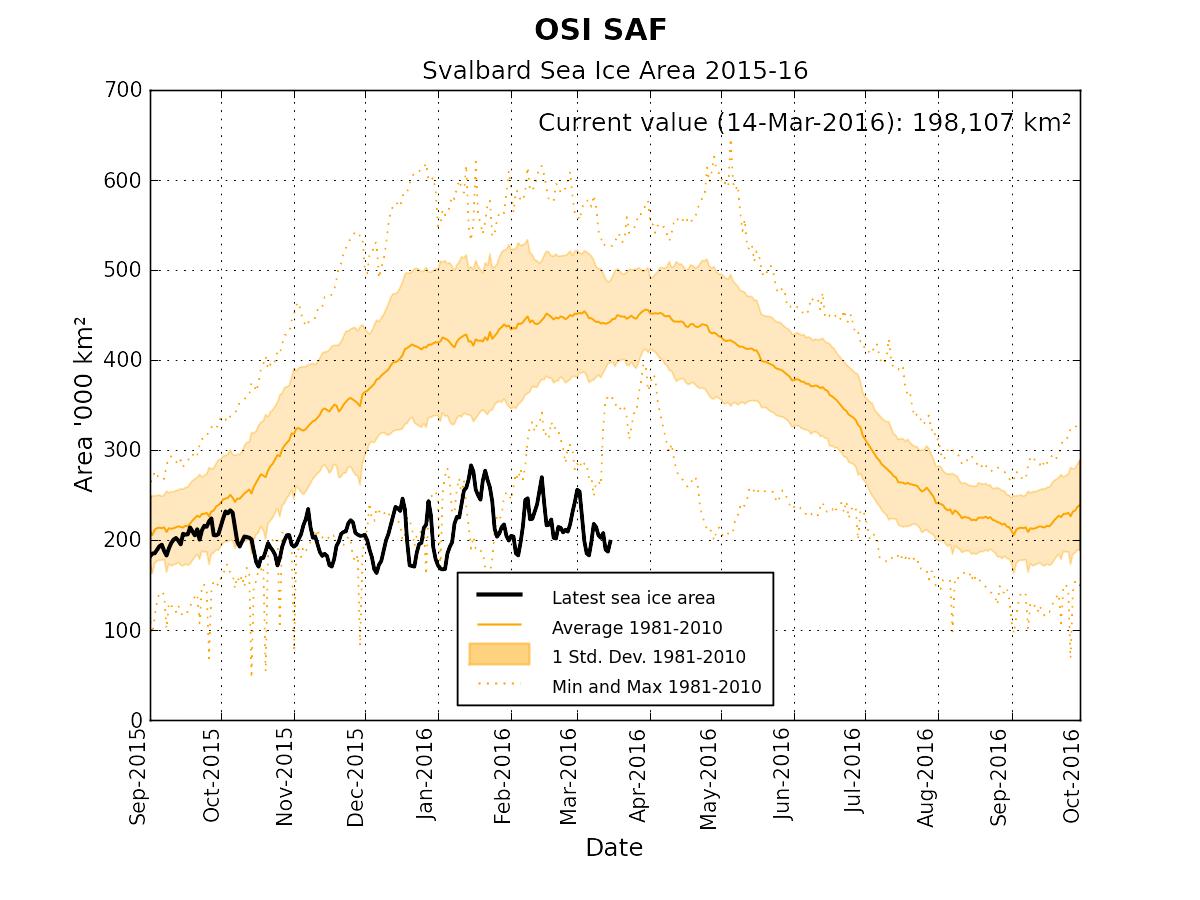
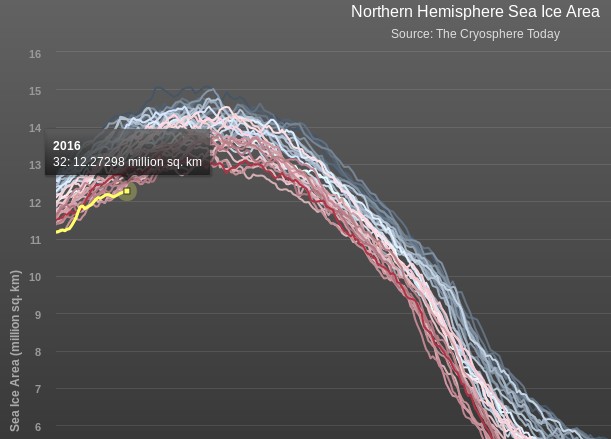
This graph from Wipneus shows the abruptness of the change.

Here it is, in all its glory:

amsr2-area-all-20160913

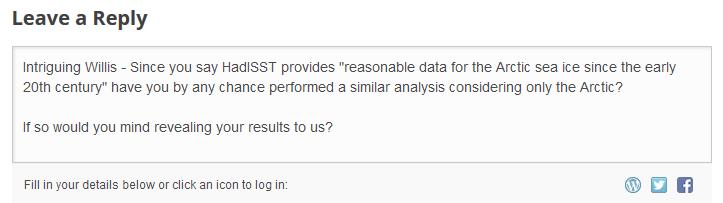
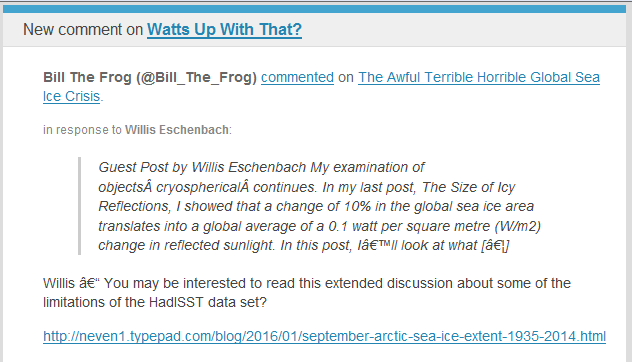
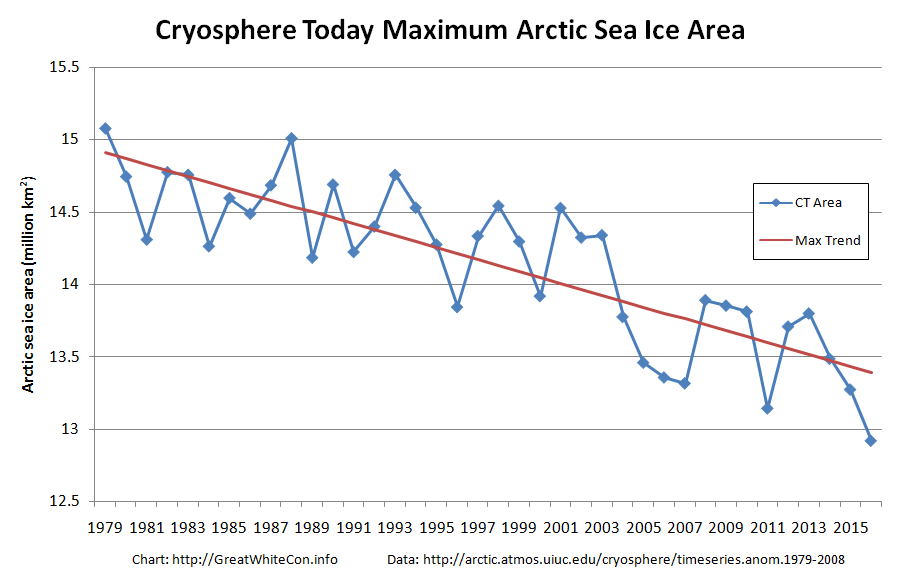
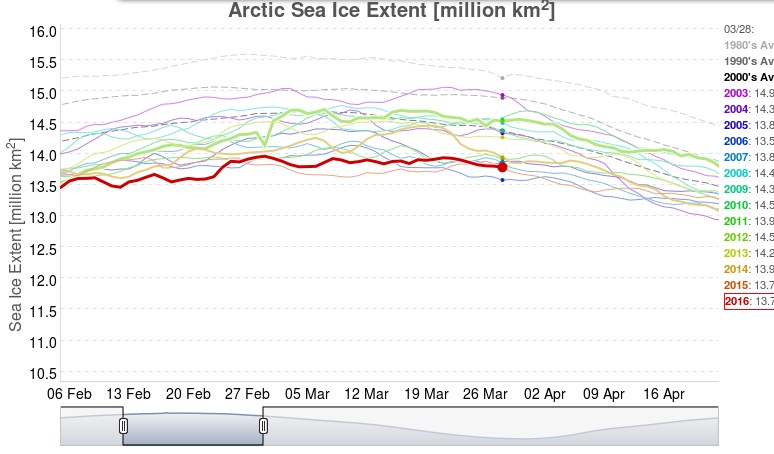
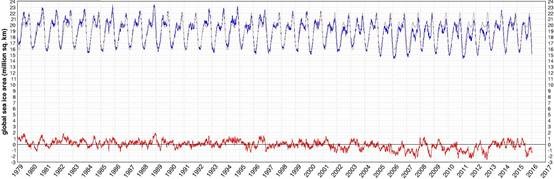
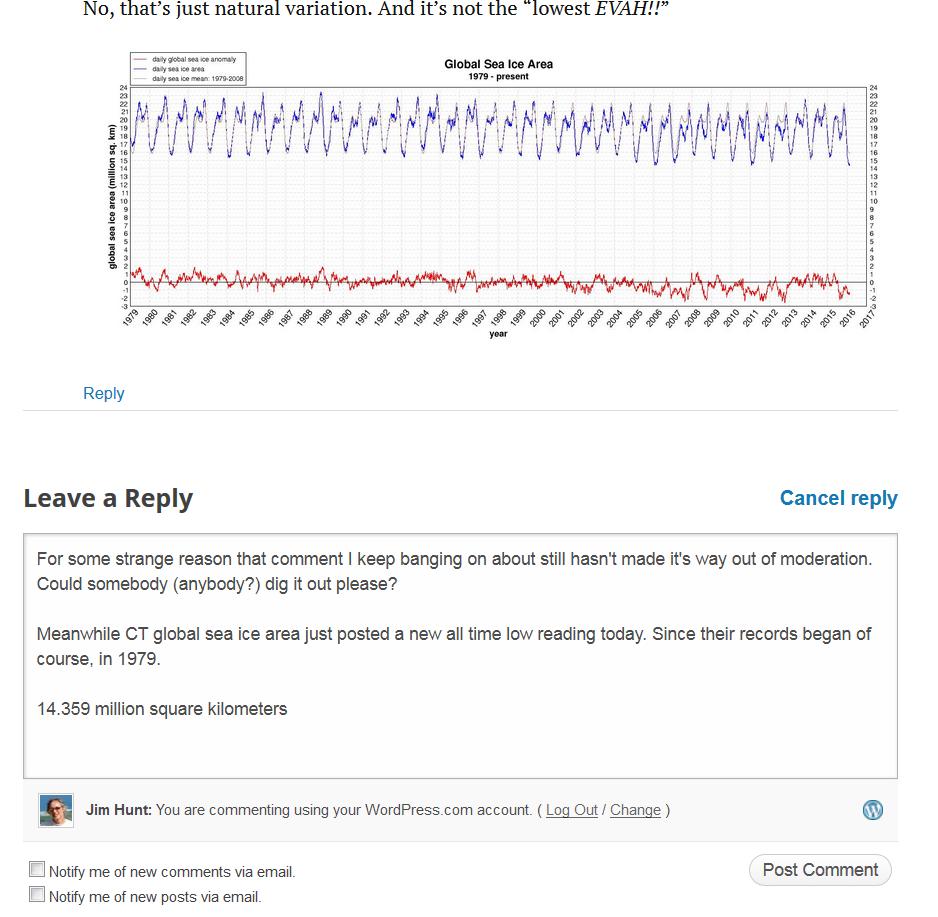
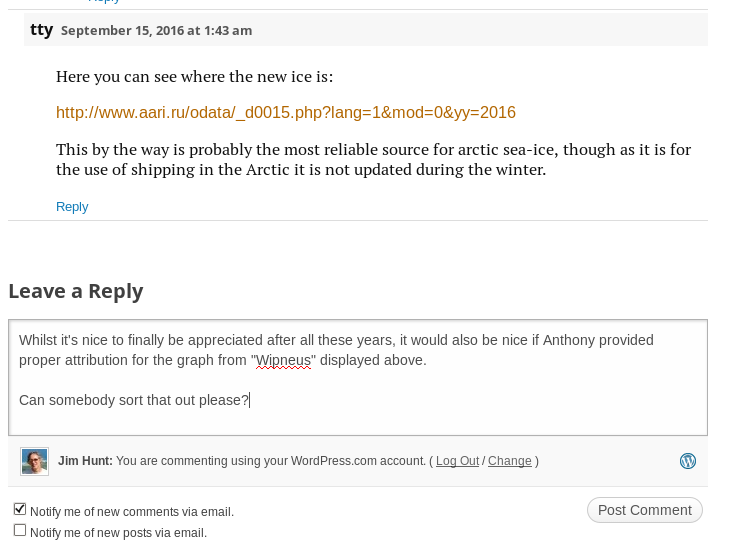
What’s not in the least surprising is that Anthony failed to provide a link to the source of the graph, and that our polite request for that to be corrected remains invisible took a long time to be approved over at Watts Up With That. Here it is, in all its ignominy:

selection_918

As if that isn’t enough to cope with for one day, there was even bigger shock yesterday. Tony Heller stated:

Effective Skeptics Don’t Reject Basic Physics

which is accompanied by a screenshot from an Independent article which reads as follows:

One of Britain’s leading climate change sceptics – former Chancellor Nigel Lawson – has admitted that humans are causing global warming.

Speaking to the House of Lords’ Economic Affairs Committee, Lord Lawson said he did not “question for a moment” that carbon dioxide was a greenhouse gas.

And he accepted there was “huge agreement” among scientists that it was having “some effect” on the atmosphere.

But the former Conservative Cabinet minister argued it would be “crazy” for the UK to try to stop burning the fossil fuels that produce carbon dioxide, claiming countries like China were simply carrying on doing so.

Lord Lawson founded the Global Warming Policy Foundation in 2009 to oppose attempts to reduce the rise in temperatures and has emerged as one of Britain’s leading sceptics.

Here’s a recording of Nigel Lawson versus Adair Turner yesterday, testifying before the Economic Affairs Committee:

It seems as if the “97% consensus” on “anthropogenic global warming” is now at least 97.1%. I cannot help but wonder when Anthony Watts will reveal the news to his faithful followers? Meanwhile most of Tony’s many merry minions are unhappy bunnies this morning. 2015 “New Einstein” award winner Gail Combs complains:

The biggest problem is with that statement he just betrayed every skeptic and agreed that we are all tinfoil hat Den1ers.

It does not matter what else he added. That ‘sound bite’ is a HUGE WIN for the other side. Add the Ship of Fools ‘win’ and they will bash us into the ground.

I am sorry Tony, but it is a complete PR disaster especially right before the US elections.

As you well know this has never been about science. Our side plays by the Marquess of Queensberry Rules, their side are dirty street fighters using Alinsky’s Rules for Radicals and lie and cheat and browbeat at every turn. So their side wins EVERY D@MN TIME!

Mr. Heller comments:

I completely agree with [Nigel Lawson]. Do you consider me to be a “real skeptic” ?

Answers on a virtual postcard please, in the space provided below.

Global Sea Ice “Comeback” Conspiracy

Our Twitter feed has suddenly been inundated with messages to the effect that:

Global sea ice makes a strong comeback as El Nino fades.

First up was Professor Judith Curry on April 12th, with:

You will note that we were not the only ones to swiftly conclude that Judy’s assertion was lacking both veracity and verisimilitude! Then this morning came our old friends at the Global Warming Policy Forum with:

You will note that the GWPF adorned their “Tweet” with a graph purporting to show “Global sea ice anomalies”. We can only assume that Benny Peiser hadn’t read this April 11th article of ours, which pointed out that:

NSIDC has suspended daily sea ice extent updates until further notice, due to issues with the satellite data used to produce these images. The problem was initially seen in data for April 5 and all data since then are unreliable, so we have chosen to remove all of April from NSIDC’s archive.

To remedy that (no doubt?) inadvertent oversight on Benny’s part here is a graph we prepared earlier of absolute global sea ice area using reliable data from the AMSR2 instrument on the Japan Aerospace eXploration Agency’s SHIZUKU satellite:

2016-04-12-UH-AMSR2-Area

The GWPF were followed this afternoon by Anthony Watts with:

Both Prof. Curry and non Prof. Watts adorned their “Tweets” with a graph allegedly comparing “global temperature” with “tropical temperature”, but provided no graph of “polar temperature”. To remedy that (no doubt?) inadvertent oversight here is one we prepared earlier:

NCEP-Arctic-T2-DJF

All members of this team of synchronised “Tweeters” provided links to an April 11th article by a certain Paul Dorian entitled, believe it or not:

Global Sea Ice Makes A Strong Comeback

Note in particular the part of Paul’s article that states:

In an interesting twist, the recent analysis found that the global ice area remained stable throughout the 1980s and the 1990s, while temperatures climbed suggesting “the global sea ice area is not particularly a function of the global average surface temperature.” [Source: Willis Eschenbach/”Watts Up With That” web site]

We can only assume that Paul Dorian hadn’t read this April 10th article of ours, which pointed out amongst other things that:

One feels compelled to ask why Willis’s global average temperature graph neglects to mention 2015 when he implies that it does?

Here’s an up to date version of one of those that Bill The Frog prepared for us earlier:

HadCRUT-201602

We must further assume that Paul hadn’t read this April 11th article by Mr. Watts either. It stated that:

A few years ago in 2009, I was the first to notice and write about a failure of the instrumentation for one of the satellites used by the National Snow and Ice Data Center (NSIDC) to show Arctic Sea Ice extent. Today, we have what appears to be a similar problem with satellite sea ice measurement.

It seems that Paul Dorian has finally read at least one out of all these informative articles, because the latest revision of his own piece of imaginative fiction now starts:

The source of global sea ice information cited in this posting was NOAA’s National Snow and Ice Data Center (NSIDC). They are now reporting issues with the satellite data used to produce these images and this information was not known at the time of the writing of this article.

Do you suppose we can now expect a similarly “fulsome apology” from the other players in this tragi-comic farce, together with all their rebloggers, retweeters, plagiarisers and other assorted acolytes?

The Awful Terrible Horrible Arctic Sea Ice Crisis

As our regular reader(s) will be aware, Anthony Watts has been plagiarising our content and republishing it on his “Watts Up With That” blog. In a perplexing perversity he has also been refusing to publish content that we have happily contributed to the self same blog. Hence we have taken the liberty of basing our title for today on a recent WUWT guest post by Willis Eschenbach entitled:

The Awful Terrible Horrible Global Sea Ice Crisis

Here’s what Willis had to say at the end of his article:

My Usual Request: Misunderstandings are the curse of the internet. If you disagree with me or anyone, please quote the exact words you disagree with, so we can all understand the exact nature of your objections. I can defend my own words. I cannot defend someone else’s interpretation of some unidentified words of mine.

My Other Request: If you believe that e.g. I’m using a method wrong or using the wrong dataset, please educate me and others by demonstrating the proper use of the method or the right dataset. Simply claiming I’m wrong about methods doesn’t advance the discussion unless you can point us to the right way to do it.

Data: The Hadley HadISST ice (and sea surface temperature) data is available here. I used the NetCDF file HadISST_ice.nc.gz (~15Mb) at the bottom of the page.

and here’s a copy of our still invisible comment:

2016-04-07_0600-WUWT

Epitomising the indomitable spirit of scientific skepticism we set out to duplicate the results obtained by Mr. Eschenbach and answer our own question as well as his. Here is what we’ve discovered. Firstly global sea ice area since 1974:

HadISST-Global

and then Arctic sea ice area since 1974:

HadISST-Arctic

Now as our very own learned guest poster Bill The Frog all too briefly pointed out to Willis Eschenbach on April 7th:

2016-04-07-1757-WUWT-BtF

Ignoring Bill’s helpful hint Willis concluded that:

We’re pretty sure that the global average surface temperature increased from the mid-1970s to about 1998. However, we see no sign of this in the global sea ice area data. Instead, ice area remained stable throughout the 1980s and the 1990s, while temperatures climbed:

hadcrut-global-average-surface-temp-WUWT-20160406

Next, we’re also pretty sure that there was no significant change in the global average temperature from about 1998 to 2015, the end of the ice data. Despite that, starting in 2000 the ice area first dipped to a low in about 2007, and since then has been climbing rapidly.

This supports a curious conclusion, which is that in modern times at least, the global sea ice area is not particularly a function of the global average surface temperature. Go figure…

Now that we’re in possession of all this newly revealed data about historical sea ice area and censorship in the cryospheric blogosphere what should we “go figure”? Firstly one feels compelled to ask why Willis’s global average temperature graph neglects to mention 2015 when he implies that it does?

Should you figure anything else please free to answer our query on a virtual postcard, in the space provided for that purpose below. You may additionally like to vent your feelings concerning this controversial cover-up of our changing climate over on Twitter using the #SnipGate hashtag.

More Of The Usual Hype About Arctic Sea Ice

No sooner has one of the usual suspects claimed that “Arctic Sea Ice Holds Firm” than a few more jump on the same bandwagon. The Global Warming Policy Forum have republished almost the whole of an article penned by our old friend Paul Homewood entitled “More Of The Usual Hype About Arctic Ice“. According to Paul (and Benny):

Far from collapsing, Arctic sea ice area has been remarkably stable in the last decade

He illustrates his point using a slightly different version of the Cryosphere Today Arctic sea ice area anomaly graph employed by Andrew Montford on March 29th. Here’s the latest version:

seaice-anomaly-20160403

For some strange reason Paul (and Benny) neglect to mention that the current anomaly of -1.199 million square kilometers is the most negative it has ever been for the day of the year in the entirety of the Cryosphere Today record going back to 1979. They also neglect to mention that the CT anomaly is typically much larger in summer than in winter, and that despite that fact the CT anomaly never fell as low as -1.199 at any time of year until 2006.

Make sure to follow the first link above for much more on anomalously misleading area graphs. However Paul (and Benny) are not content with just one misleading interpretation of an anomaly graph. The article continues:

With multi year ice continuing to recover from 2008 lows, ice volume has also been growing in the last few years.

BPIOMASIceVolumeAnomaly-201602

Whilst we all eagerly await the release of the PIOMAS Arctic sea ice volume numbers for March 2016, here is an alternative visualisation of the data from Chris Reynolds:

Reg-Vol-Feb16

Volume is the second lowest on record [for February] since 1978 at 20.660 thousand km cubed

In the Central Arctic, where it matters most, sea ice volume at the end of February was only a whisker above where it was in 2012, according to PIOMAS at least. For those with short memories the CT Arctic sea ice area metric reached an *all time low of 2.23401 million square kilometers on September 13th 2012, and an *all time low anomaly of -2.81817 million square kilometers on October 14th 2012.

*Since the Cryosphere Today records began

Claim – Arctic Sea Ice Holds Firm?

Today’s Arctic sea ice claim comes from the Bishop Hill blog of Andrew Montford, which recently stated that:

This morning’s story appears to be the hoary old “Arctic sea ice in freefall” one.

“The Arctic is in crisis. Year by year, it’s slipping into a new state, and it’s hard to see how that won’t have an effect on weather throughout the Northern Hemisphere,” said Ted Scambos, lead scientist at the Colorado-based NSIDC.”

As usual on these occasions, I take a quick look at the Cryosphere Today anomaly page, where I find the sea ice apparently still stuck firmly in “pause” mode.

seaice.anomaly.-20160328

Having inadvertently wended my way onto The Bishop’s Hill via the northerly extension to Eli’s Rabett Warren I felt compelled, as usual, to quibble with Andrew’s “apparently firmly in ‘pause’ mode” claim. Since graphs in comments are not available over on The Hill, or The Rabett Run for that matter, let’s take a look at some graphic representations of the available data over here instead. Commenter “Golf Charlie” asks at The Bishop’s:

With CO₂ levels continuing to rise, why hasn’t temperature risen, and the ice disappeared as predicted?

Let’s see shall we? CO₂ levels are indeed continuing to rise:

Keeling-20160330

Temperature has risen, as predicted:

2015-berk1

Arctic amplification is occuring, as predicted:

Time series of Arctic surface temperature in winter (Dec/Jan/Feb)

Arctic sea ice is disappearing, as predicted:

CT-20160330

CT-Max-2016-Final

Q.E.D?

NSIDC Announce The 2016 Arctic Sea Ice Maximum Extent

In the latest edition of their “Arctic Sea Ice News” the United States’ National Snow and Ice Data Center have announced that:

Arctic sea ice appears to have reached its annual maximum extent on March 24, and is now the lowest maximum in the satellite record, replacing last year’s record low. This year’s maximum extent occurred later than average. A late season surge in ice growth is still possible. NSIDC will post a detailed analysis of the 2015 to 2016 winter sea ice conditions in early April.

NSIDC-20160327

On March 24, 2016, Arctic sea ice likely reached its maximum extent for the year, at 14.52 million square kilometers (5.607 million square miles). This year’s maximum ice extent was the lowest in the satellite record, with below-average ice conditions everywhere except in the Labrador Sea, Baffin Bay, and Hudson Bay. The maximum extent is 1.12 million square kilometers (431,000 square miles) below the 1981 to 2010 average of 15.64 million square kilometers (6.04 million square miles) and 13,000 square kilometers (5,000 square miles) below the previous lowest maximum that occurred last year. This year’s maximum occurred twelve days later than the 1981 to 2010 average date of March 12. The date of the maximum has varied considerably over the years, occurring as early as February 24 in 1996 and as late as April 2 in 2010.

NASA’s Goddard Space Flight Center has also made a similar announcement, which includes this video:

The new record low follows record high temperatures in December, January and February around the globe and in the Arctic. The atmospheric warmth probably contributed to this lowest maximum extent, with air temperatures up to 10 degrees Fahrenheit above average at the edges of the ice pack where sea ice is thin, said Walt Meier, a sea ice scientist at NASA’s Goddard Space Flight Center in Greenbelt, Maryland.

The wind patterns in the Arctic during January and February were also unfavorable to ice growth because they brought warm air from the south and prevented expansion of the ice cover. But ultimately, what will likely play a bigger role in the future trend of Arctic maximum extents is warming ocean waters, Meier said.

“It is likely that we’re going to keep seeing smaller wintertime maximums in the future because in addition to a warmer atmosphere, the ocean has also warmed up. That warmer ocean will not let the ice edge expand as far south as it used to,” Meier said. “Although the maximum reach of the sea ice can vary a lot each year depending on winter weather conditions, we’re seeing a significant downward trend, and that’s ultimately related to the warming atmosphere and oceans.” Since 1979, that trend has led to a loss of 620,000 square miles of winter sea ice cover, an area more than twice the size of Texas.

This year’s record low sea ice maximum extent will not necessarily result in a subsequent record low summertime minimum extent, Meier said. Summer weather conditions have a larger impact than the extent of the winter maximum in the outcome of each year’s melt season; warm temperatures and summer storms make the ice melt fast, while if a summer is cool, the melt slows down.

Neither NASA or the NSIDC comment on one of the striking things about this winter’s NSIDC extent chart, which has effectively “plateaued” during March 2016 following an initial peak of 14.48 million square kilometers on March 2nd, which was only recently exceeded. This is also illustrated by the JAXA Arctic sea ice extent metric, for which the 2016 maximum was 13.96 million square kilometers on February 29th:

JAXA-20160328

Now that the start of 2016 Arctic sea ice melting season has been called, albeit slightly hesitantly, by the experts at the NSIDC let’s also take a look at Cryosphere Today Arctic sea ice area:

CT-20160327

The preliminary peak which we announced on March 16th has also recently been exceeded, but we now feel supremely confident in predicting that the 2016 CT area maximum will be less than 13 million square kilometers for the first time ever in the satellite record.

Thus begins what promises to be a very interesting 2016 Arctic sea ice melting season! As the NSIDC puts it:

There is little correlation between the maximum winter extent and the minimum summer extent—this low maximum does not ensure that this summer will see record low ice conditions. A key factor is the timing of widespread surface melting in the high Arctic. An earlier melt onset is important to the amount of energy absorbed by the ice cover during the summer. If surface melting starts earlier than average, the snow darkens and exposes the ice below earlier, which in turn increases the solar heat input, allowing more ice to melt. With the likelihood that much of the Arctic cover is somewhat thinner due to the warm winter, early surface melting would favor reduced summer ice cover.

Vanishing Svalbard Sea Ice

At the turn of the year we speculated about the potential effect of high temperatures and the swells caused by strong winds on sea ice in the Fram Strait and Barents and Greenland Seas. With the vernal equinox rapidly approaching let’s take stock of the state of Svalbard sea ice. Here’s one the first “visual” satellite images of the area in 2016 recorded yesterday by the Aqua satellite:

NASA Worldview “true-color” image of the Central Arctic north of Svalbard on March 14th 2016, derived from the MODIS sensor on the Aqua satellite

and here is the equivalent sea ice map from the Norwegian Meteorological Institute:

Svalbard-Map-20160314

Both sources reveal an unseasonable lack of solid sea ice around Svalbard. In fact an intrepid Northwest Passage navigator who didn’t mind the dark might well currently be able to circumnavigate Svalbard!

The Norwegian Meteorological Institute also produce a time series of sea ice area in the Svalbard region based on data from OSI-SAF. It currently looks like this:

osisaf-svalbard_20160314

As sunlight returns to the Central Arctic north of 80 degrees there is an anomalously large area of open water ready to soak up the rays. Here is what the Danish Meteorological Institute timeseries of Central Arctic temperatures looks like at the moment:

DMI-meanT_20160314

and here is the current Svalbard surf forecast from Magic Seaweed:

MSW-20160315

Whilst we speculate on what all this might mean for the Atlantic side of the Arctic over the coming melting season, here’s our new Svalbard Sea Ice page which contains a variety of graphs and maps to help us keep track of events on that part of our planet.

For Life on Earth, Ice is not Generally a Good Thing!?

Or so Viscount Christopher Monckton of Brenchley claims in answer to the question I recently put to him and his fellow authors in a comment below an article on the Watts Up With That blog entitled “The Profiteers of Climate Doom” and bylined “Christopher Monckton of Brenchley, Willie Soon and David R. Legates”. As I put it in my initial comment:

A “killer question” for you Christopher.

Were you previously aware that global sea ice area has recently reached its lowest ever level (since the Cryosphere Today satellite records began)?

The thing is, although Chris’s riposte to my gentle probing has just been published, my third explanatory comment has not. Here it is:

2016-02-12_2353-WUWT

and here is the good Viscount’s answer, quoted in full:

Mr Hunt, in his desperation to promote the purely political but now collapsing cause of shutting down fossil-fuel corporations that were once the major donors to his hated Republican opponents, displays a shameful disregard for, or ignorance of, elementary statistical method. He founds his case on a single data point, and one that is little different from similar data points in 2006 and 2011.

However, as he will learn when he attends his first Statistics 101 course, to place undue weight on a single data point is to err. Grown-ups determine trends on multiple data points. As Mr Hunt will learn from the graph helpfully posted by Mr Stealey, to whom he is as churlishly ungrateful as most of his sort are, the trend on the daily observations of global sea-ice extent by the satellites since 1979 is remarkably close to zero.

There has, of course, been some global warming since 1979, though only one-third of what the IPCC predicted in 1990. Naturally, one consequence of the little warming that has occurred might be a very small loss of global sea ice.

For life on Earth, of course, ice is not generally a good thing. The less of it the better.

Messrs Soon and Legates are currently keeping any thoughts they may have on the matter close to their respective chests.

[Edit – 23:30 UTC on Saturday February 13th 2016]

Intriguingly my 4th comment @WUWT is now plain for all to see, whereas despite my plaintive calls on Twitter the third shown above is not! Time for a brief flashback. On January 13th 2016 Yale Climate Connections published this video:

You will note that at around 6 minutes 30 seconds Carl Mears of Remote Sensing systems says that:

Senator Cruz focusses on one data set, mine, from one type of instrument, satellites, and he ignores all the other evidence. For example the surface temperature record, things like the Arctic sea ice declining….

On January 19th 2016 the Watts Up With That blog published an article by one “Christopher Monckton of Brenchley” entitled “20 false representations in one 10-minute video“. The 15th “false representation” read as follows:

That Arctic sea ice is declining, though Antarctic sea ice has been on a rising trend and reached a satellite-era record in early 2015, and though the decline in Arctic sea ice is chiefly only in a few late-summer weeks and is a small fraction of the seasonal variation in sea-ice extent, so that neither the extent nor the trend of global sea ice (from the University of Illinois) shows much change throughout the satellite era:

Moncktom-Global-Area

Does that graph look at all familiar?

[Edit – 16:45 UTC on Tuesday February 16th 2016]

I have posted two comments on the Watts Up With That blog today, but at present neither of them is visible. In the most recent one I endeavoured to inform Monckton et al. about the news that today the Cryosphere Today global sea ice area metric posted a new “*all time low” value. Here’s my comment:

2016-02-16_1639-WUWT

We’ll keep you posted about if and when it appears over there as well.

Global Sea Ice Area at Lowest *Ever Level

Regular readers will recall that we recently announced this “Shock News!” in a comment below our “Arctic Sea Ice Area and Extent Lowest ^Ever” article. Here is the graphic evidence again:

CT-Global-2016-02-08


And here is a story about what it takes to convince a “climate change skeptic” about the crysopheric facts of life:


There’s more on this sorry tale of woe over at Neven’s Arctic Sea Ice Blog.

This measure doesn’t tell us all that much about the health of either Arctic or Antarctic regions, if only because the seasons move in opposite directions (nevertheless, the Global sea ice trend is down). It’s just an interesting statistical factoid.

However, climate risk deniers often use the Global sea ice metric as an argument that nothing is wrong and AGW is a hoax. In other words, the recent growth in Antarctic sea ice offsets the loss of Arctic sea ice (it doesn’t), even though the poles are literally worlds apart and are pretty much incomparable (except for the sea ice bit).

Using this logic, it would seem that this new record minimum means there is something wrong with sea ice and AGW isn’t a hoax. I wonder how they will spin this one. If they report it to their loyal readers, that is.

So far none of the “climate risk deniers” I’ve pinged on Twitter have brought this “interesting statistical factoid” to the attention of “their loyal readers”.

* Since satellite records began
^ For the day of the year

Arctic Sea Ice Area and Extent Lowest *Ever for the Date

We’ve recently been speculating about the effect on the sea ice in the Arctic of varying amounts of weather borne heat, wind and waves. The cumulative effect of all the assorted storms is that today a variety of sea ice metrics are all at their lowest ever level for the date, since their respective records began.

The JAXA/ADS extent was the first to fall below all previous years, and here’s how it looks today:

vishop_extent-20160202

Note that it shows extent currently decreasing. Next came the Cryosphere Today area, which has also just decreased from the day before:

CT-2016-032

The latest metric to join the club is the 5 day averaged version of the NSIDC Arctic sea ice extent, which currently reveals:

NSIDC-20160202

Would any brave reader care to hazard a guess where and when the assorted Arctic sea ice metrics will eventually reach their maximum values for 2016?

P.S. The NSIDC average Arctic sea ice extent for January 2016 is also in the “lowest ever” club:

nsidc-2016-01

* Since satellite records began