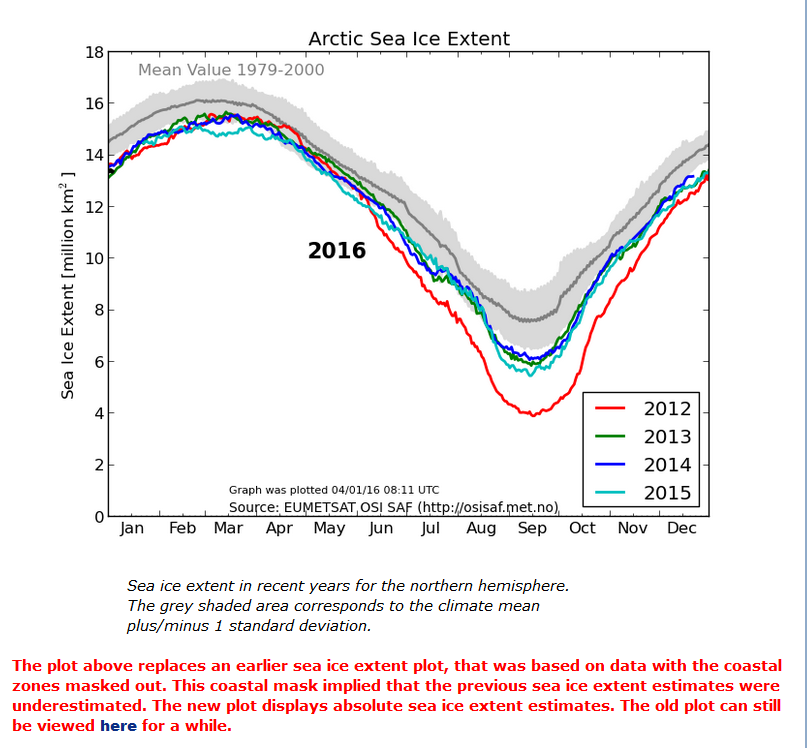
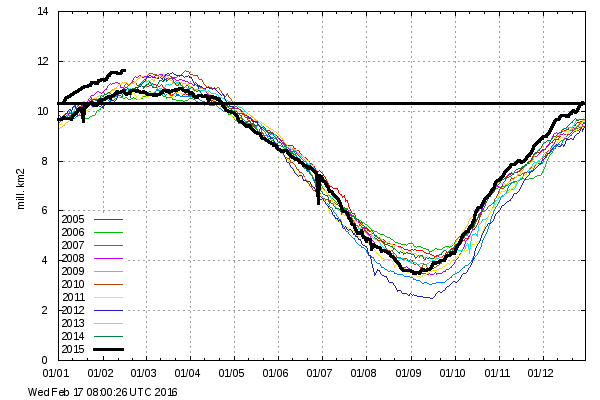
When I pose that question I’m not referring to the Danish Meteorological Institute’s long “deprecated” 30% concentration threshold Arctic sea ice extent metric so much as the reaction to its demise amongst the more “skeptical” of we cryospheric bloggers. Here once again is the “controversial” graph in question, archived from the start of the year:
No sooner had Paul Homewood moved on from that topic to finally reproduce on his blog an NSIDC Arctic sea ice graph I first brought to his attention last spring than across the Atlantic in the good ‘ol US of A a certain Mr. Anthony Watts suddenly loudly proclaims that he “tends to agree” with Mr. Homewood’s assertion that:
There has been so much skulduggery going on in the climate establishment in recent years that it is hard to avoid the conclusion that this graph has been withdrawn simply because it gives the “wrong” results.
Given the actual facts of the matter this is peculiar enough, but then things get positively surreal. Regular readers will realise that up here in the penthouse suite at the pinnacle of the tallest of the Great White Con Ivory Towers we pride ourselves on our surreal sensibilities. Today though, we are forced to admit that WUWT has beaten us at our own game. Whilst we were conducting a perfectly sane interview with one of the world’s top sea ice scientists Tony was concocting these perfectly formed surrealist fantasies.
In his update 1 to this already nonsensical story Anthony assures us that:
The typical haters, such as Neven Acropolis, are making claims in comments that I see this as some sort of “conspiracy”. I do not and any such claim is false and political in nature.
Mr. Watts is evidently a big fan of William Burroughs, and has used his celebrated “cut-up” technique to transform “Skulduggery going on in the climate establishment” into “magnets cued she got on the inimitably ginger skull” which is obviously not even slightly conspiratorial.
Let’s move swiftly on to update 2, wherein we are told:
DMI has an entire page dedicated to the use of the 30% concentration value that is still operational!
However if you read the small print on Anthony’s accompanying image it says that:
The maps are additionally overlayed with the corresponding multi-year monthly mean of the periods 1978-2014.
and if you click the accompanying link you will discover that there is no way on Earth to persuade the DMI web site to display “operational” data from 2015, let alone 2016.
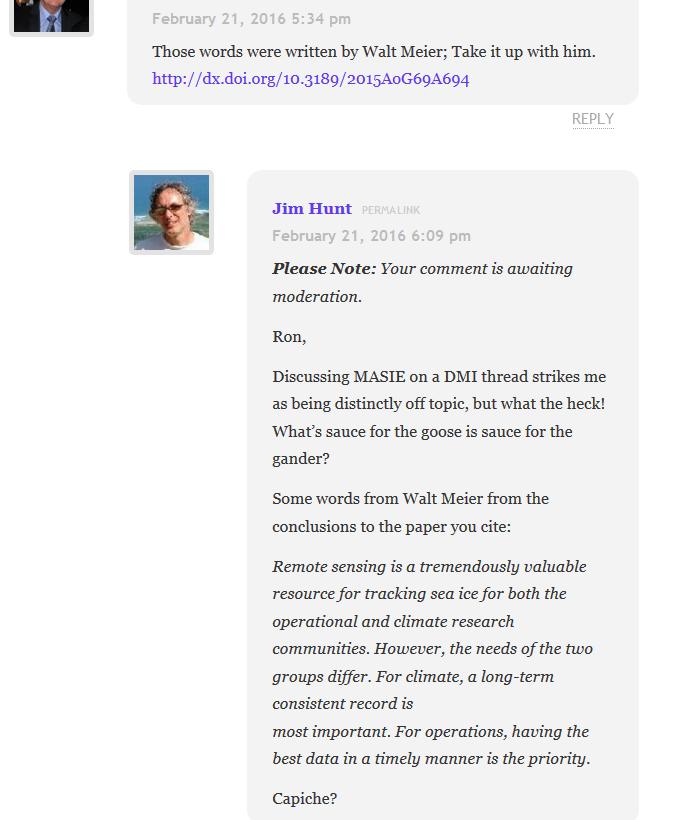
Whilst we eagerly await the no doubt imminent arrival of What’s up with that Watts DMIgate update 3 we will leave you with some words of wisdom from Dr. Walt Meier of NASA, the aforementioned top sea ice scientist, who informed us earlier today that:
Regarding DMI, the issue seems quite simple. The 30% plot is an older version that they stopped supporting as they transitioned to the 15% plot.
For some reason best known to himself Anthony Watts has jumped on the “DMIGate” bandwagon started by Paul Homewood over on this side of the Atlantic a few days ago. In his latest article Mr. Watts quotes with approval the “Not A Lot Of People Know That” article which we have already covered in some depth.
Here yet again is one of my comments that recently ended up on the NALOPKT cutting room floor:
You will note that I was suggesting that Ron Clutz’s extremely selectively interpretation of some of Walt Meier’s academic papers left a lot to be desired. Particularly given the additional fuel added to the “skulduggery” fire by the Watts Up With That article it seemed sensible to phone up NASA and ask Walt for his views on the second hottest Arctic sea ice topic on the planet at the moment, according to Messrs. Clutz and Homewood at least. That is the relative merits of Multisensor Analyzed Sea Ice Extent (MASIE for short) versus the National Snow and Ice Data Center’s Sea Ice Index (SII for short) for determining Arctic sea ice trends.
MASIE sea ice products are developed from National Ice Center (NIC for short) data with support from the U.S. Navy and from NOAA. MASIE is hosted by NOAA@NSIDC.
whereas:
The Sea Ice Index provides a quick look at Arctic- and Antarctic-wide changes in sea ice. It is a source for consistent, up-to-date sea ice extent and concentration images and data values from November 1978 to the present.
As luck would have I managed to get through to Walt on my second attempt, and he graciously agreed to be interviewed at extremely short notice. He told me that whilst he now worked at NASA he used to be at the NSIDC, and still collaborated with them. Here are the edited highlights of his thoughts on “MASIE v SII”:
MASIE repackages data from the NIC, and incorporates an ice edge hand drawn by analysts working with whatever satellite data they have available at the time. It is an “operational” product designed to produce a “best effort” ice edge each day, based on whatever data may be available at the time.
Visual data is obviously not available in winter, and the ice edge is often obscured by clouds in summer. Synthetic Aperture Radar can “see in the dark” and through clouds, but suffers from different limitations. The whole of the Arctic isn’t covered every day for example. In addition, and unlike the SII, data from different satellite sensors is incorporated which means there are inevitably inconsistencies from day to day and from year to year. There is also an element of “human subjectivity” because different analysts are working with different sources of data from one day to the next. Since the quantity and quality of data varies the time series will not be consistent over time.
On the other hand the SII was designed to use a consistent methodology over a long period of time using a single type of sensor. 100% automatically processed passive microwave data is the “gold standard” when it comes to determining sea ice trends. It is subject to some biases and thus is not necessarily as accurate on a given day as MASIE. However, the biases are consistent over time, so the time series will be consistent over time. This means that year-to-year comparisons and trend estimates will be more accurate in the passive microwave data than in MASIE.
So there you have it. If you’re on the bridge of a vessel sailing in Arctic waters then MASIE is the right tool for the job. If on the other hand you’re sat in front of a computer trying to get the best estimate of trends in Arctic sea ice extent then the Sea Ice Index is what you’ll grab from your toolkit.
Having had a chance to examine the “evidence” of DMI “skulduggery” presented by Messrs. Watts and Homewood, Walt sent me a follow up email. Here is what it says:
Regarding DMI, the issue seems quite simple. The 30% plot is an older version that they stopped supporting as they transitioned to the 15% plot. I don’t know specifically why the 30% plot went awry, but there is generally automatic quality control done to make sure the final results are accurate and consistent. If such QC is not done, a lot of incorrect values can occur. I suspect that since the older version was no longer supported, the QC wasn’t being watched and something went wrong that they didn’t bother to fix (or maybe didn’t even notice) because the new 15% version is the official DMI output.
Not a lot of people know that, because Watts, Homewood et al. have developed the nasty habit of “snipping” comments to that effect as and when the mood takes them, which based on my own experience seems to be remarkably often in this day and age.
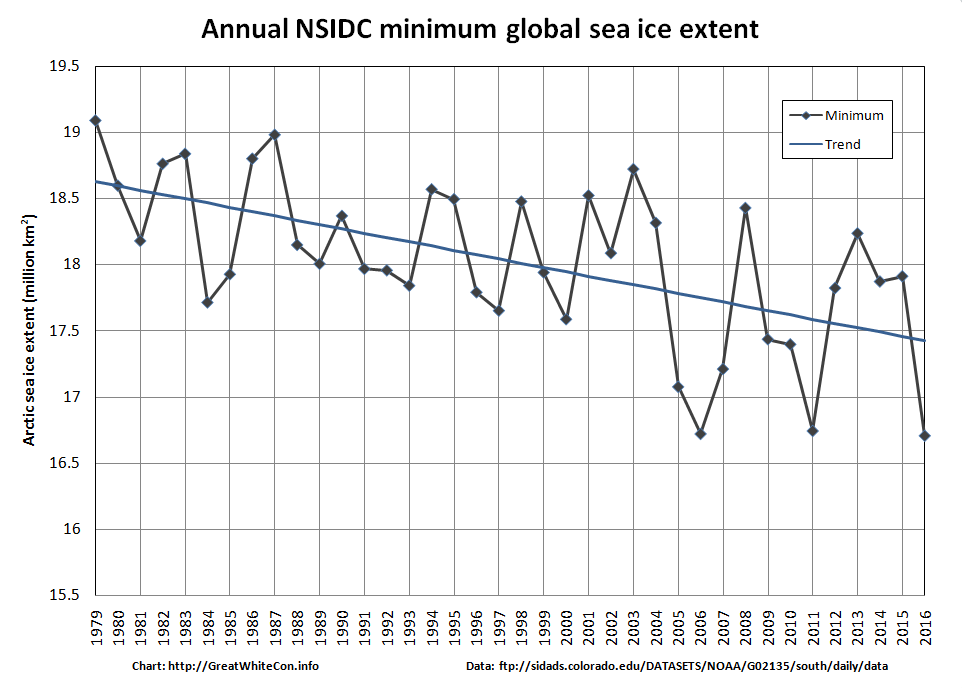
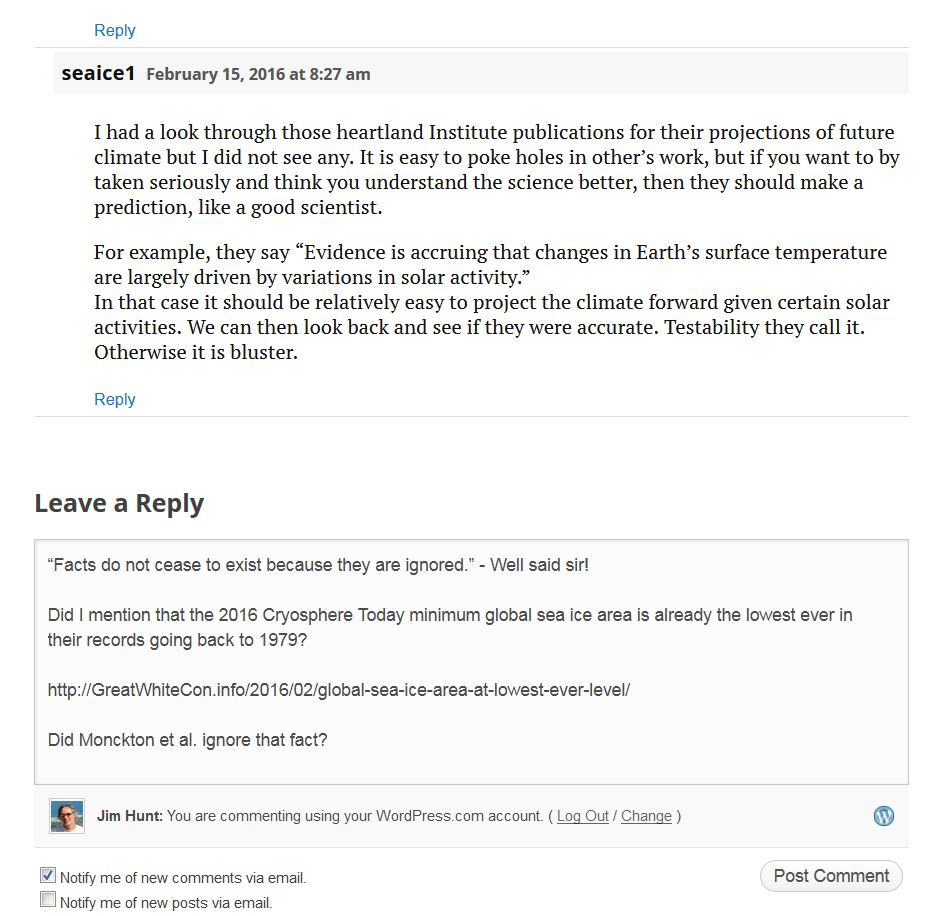
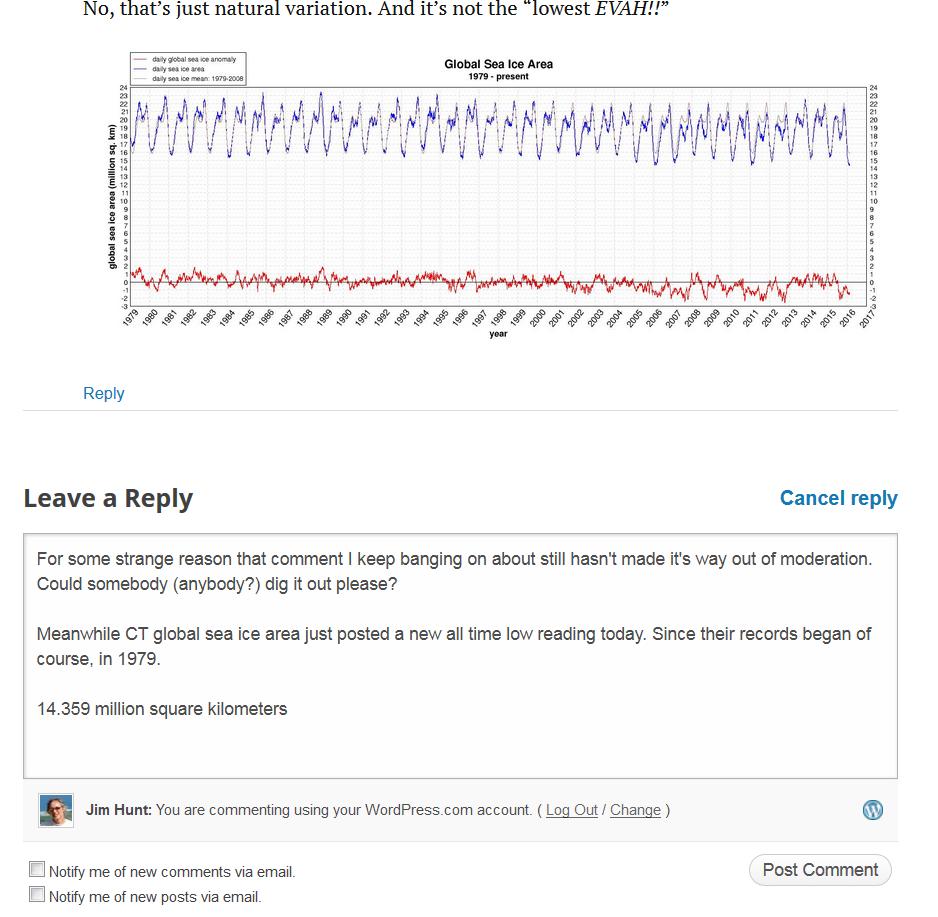
A few days ago we reported that the Cryosphere Today global sea ice area metric had fallen to the “lowest *ever” level since their records began in 1979. CT area just fell to yet another all time low once again. Today we are able to bring you the news that NSIDC global sea ice extent also achieved “lowest *ever” status today, at 16.707 million square kilometers. Here’s the graph to prove it:
As we discussed when global sea ice area reached its all time low level:
This measure doesn’t tell us all that much about the health of either Arctic or Antarctic regions, if only because the seasons move in opposite directions (nevertheless, the global sea ice trend is down). It’s just an interesting statistical factoid.
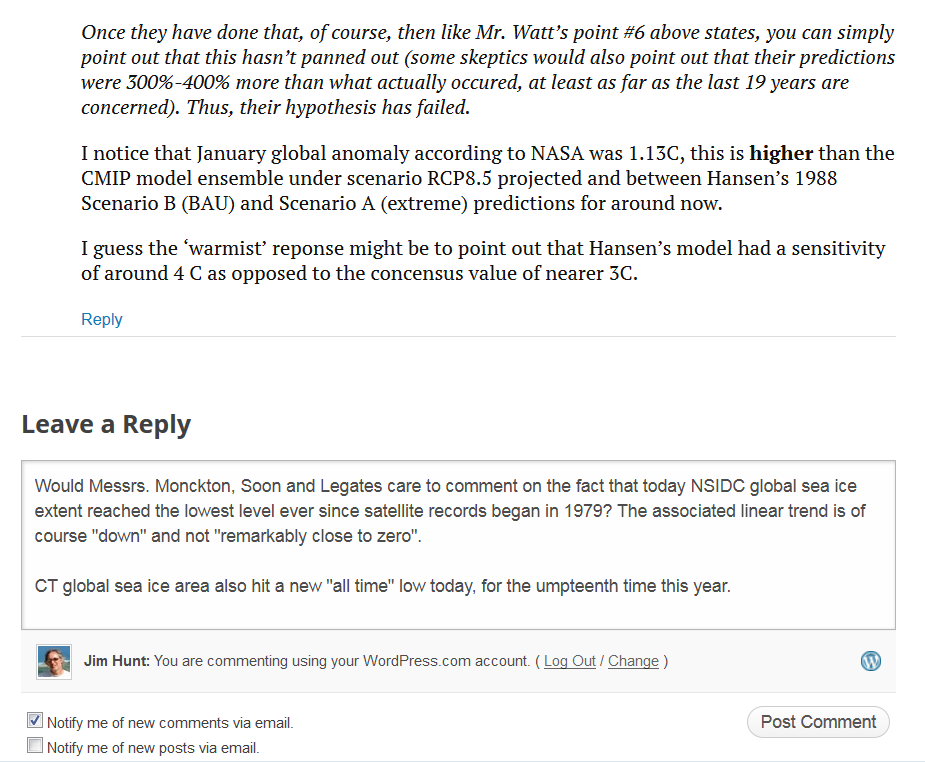
Rest assured that nonetheless we will attempt to bring this “statistical factoid” to the attention of those who have been merrily claiming for the past few years that “the trend on the daily observations of global sea-ice extent by the satellites since 1979 is remarkably close to zero.”
To begin with, let’s see when (if?) this comment sees the cold light of day shall we?
[Edit – 08:30 UTC February 19th 2016]
The comment shown above has now seen the light of day, whereas a number of others have not. Here’s the rest of the assorted conversations, so far:
Them:
I prefer this chart:
That’s at 30%, which eliminates most of the wind-blown bergs. It measures the thicker ice cover, so it’s a more accurate representation.
You can see 2016 starting to move up after a strong 2015 finish.
Us:
This one is currently still invisible over there:
That’s the one which the Danish Meteorological Institute no longer even mention on their website because it’s been deprecated and unsupported for so long:
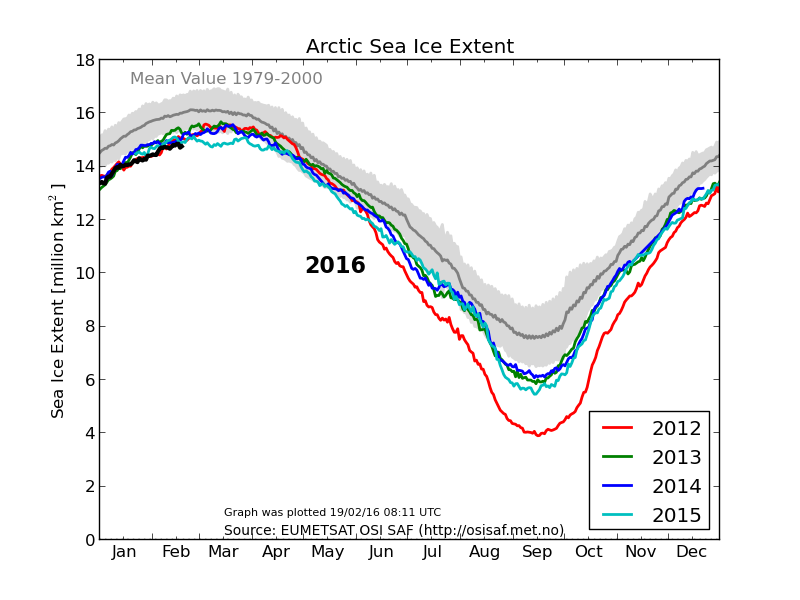
Here’s the graph (of Arctic sea ice extent only) which they currently recommend, which shows broadly the same thing as the NSIDC’s version:
Can we get back to GLOBAL sea ice area/extent now?
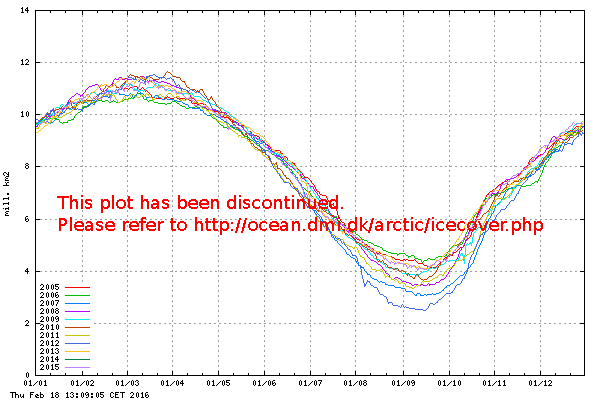
I didn’t want to use up my limited allocation of links over at WUWT, but here is what the Arctic sea ice chart that WUWT mods (and “Steve Goddard“) prefer currently looks like:
Maybe that’s why the WUWT moderator in question felt compelled to display Wednesday’s chart instead of Thursday’s?
Them:
[I don’t think any of [Monckton, Soon or Legates] with bother with your off-topic question. as said earlier, your entire m.o. is to launch a taunt, and it doesn’t merit a response since this isn’t any particularly noteworthy event. -mod]
Us:
This one is currently still invisible too:
Have you got something against Clive Best? Both my comments that link to our conversation about global area/extent are still invisible.
The “lowest EVAH!!” value of Christopher Monkton’s favourite sea ice metric doesn’t merit a response from him? On an article subtitled “killer questions that expose how wrong and ideologically driven they are”? Surely you jest?
On January 19th 2016 the Watts Up With That blog published an article by one “Christopher Monckton of Brenchley” entitled “20 false representations in one 10-minute video“. The 15th “false representation” read as follows:
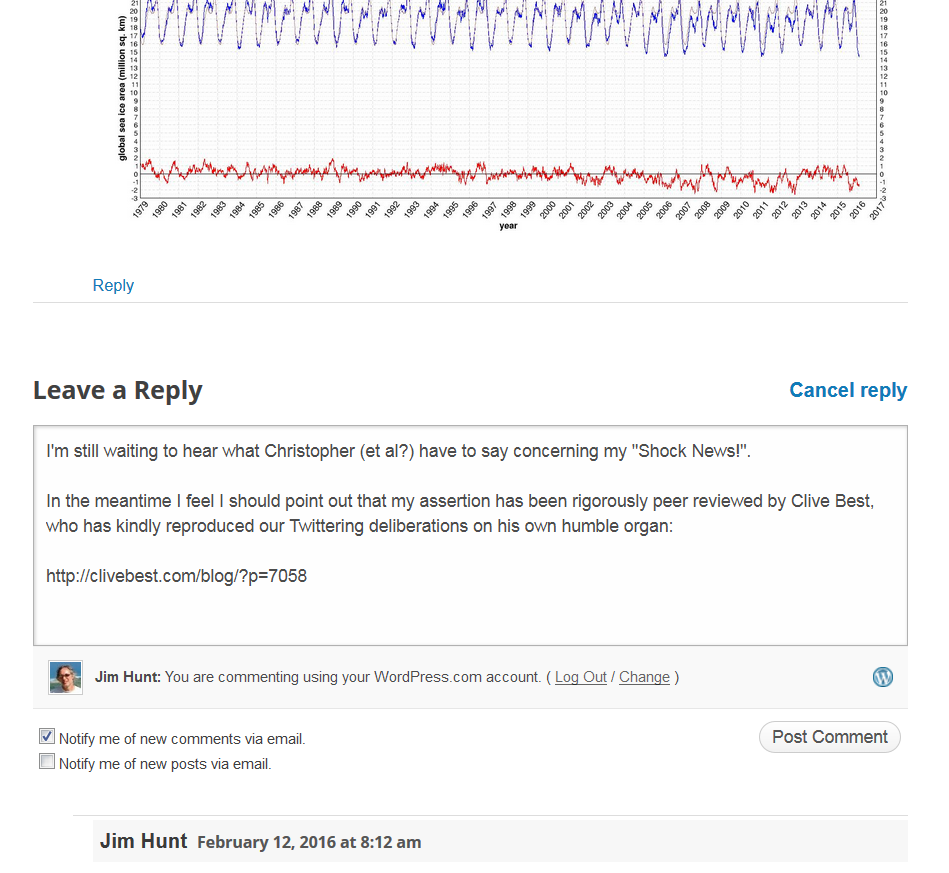
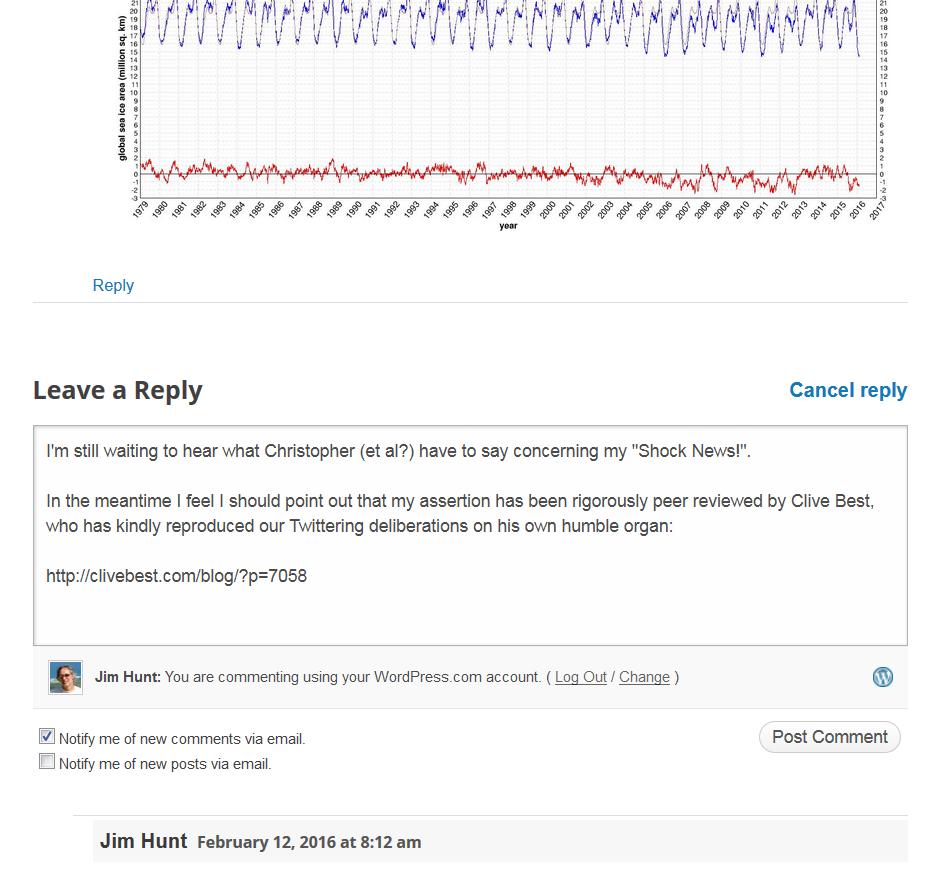
That Arctic sea ice is declining, though Antarctic sea ice has been on a rising trend and reached a satellite-era record in early 2015, and though the decline in Arctic sea ice is chiefly only in a few late-summer weeks and is a small fraction of the seasonal variation in sea-ice extent, so that neither the extent nor the trend of global sea ice (from the University of Illinois) shows much change throughout the satellite era.
Where is the Good Lord when you need him? Where is Willie Soon for that matter?
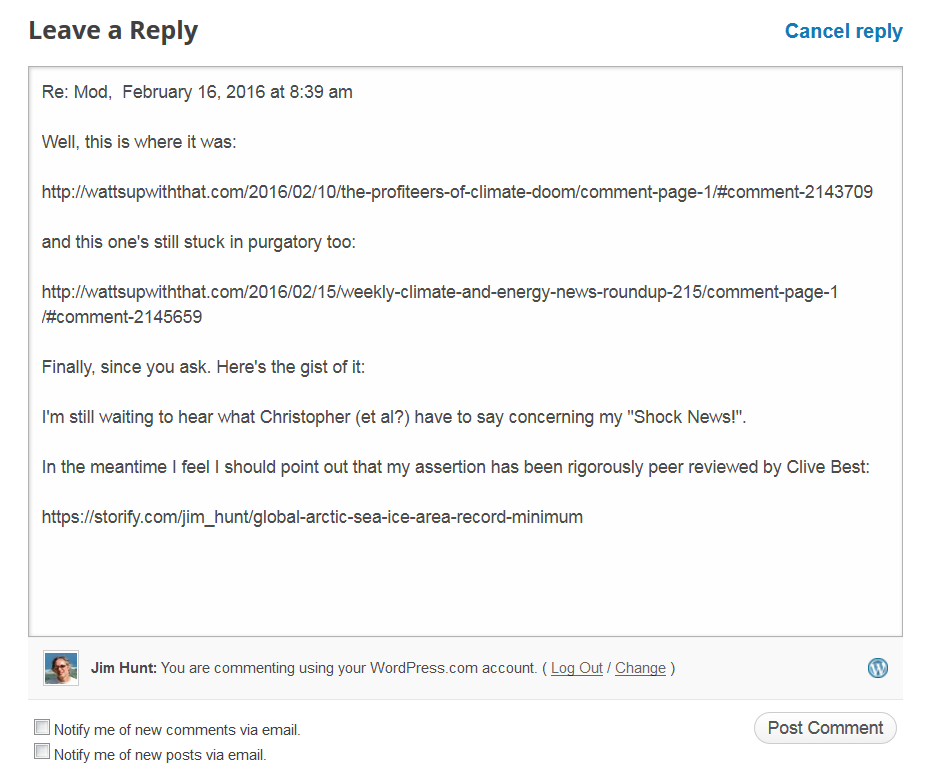
Here are my other comments that have yet to catch the eagle eyes of the Watts Up With That band of merry moderators:
Or so Viscount Christopher Monckton of Brenchley claims in answer to the question I recently put to him and his fellow authors in a comment below an article on the Watts Up With That blog entitled “The Profiteers of Climate Doom” and bylined “Christopher Monckton of Brenchley, Willie Soon and David R. Legates”. As I put it in my initial comment:
A “killer question” for you Christopher.
Were you previously aware that global sea ice area has recently reached its lowest ever level (since the Cryosphere Today satellite records began)?
The thing is, although Chris’s riposte to my gentle probing has just been published, my third explanatory comment has not. Here it is:
and here is the good Viscount’s answer, quoted in full:
Mr Hunt, in his desperation to promote the purely political but now collapsing cause of shutting down fossil-fuel corporations that were once the major donors to his hated Republican opponents, displays a shameful disregard for, or ignorance of, elementary statistical method. He founds his case on a single data point, and one that is little different from similar data points in 2006 and 2011.
However, as he will learn when he attends his first Statistics 101 course, to place undue weight on a single data point is to err. Grown-ups determine trends on multiple data points. As Mr Hunt will learn from the graph helpfully posted by Mr Stealey, to whom he is as churlishly ungrateful as most of his sort are, the trend on the daily observations of global sea-ice extent by the satellites since 1979 is remarkably close to zero.
There has, of course, been some global warming since 1979, though only one-third of what the IPCC predicted in 1990. Naturally, one consequence of the little warming that has occurred might be a very small loss of global sea ice.
For life on Earth, of course, ice is not generally a good thing. The less of it the better.
Messrs Soon and Legates are currently keeping any thoughts they may have on the matter close to their respective chests.
[Edit – 23:30 UTC on Saturday February 13th 2016]
Intriguingly my 4th comment @WUWT is now plain for all to see, whereas despite my plaintive calls on Twitter the third shown above is not! Time for a brief flashback. On January 13th 2016 Yale Climate Connections published this video:
You will note that at around 6 minutes 30 seconds Carl Mears of Remote Sensing systems says that:
Senator Cruz focusses on one data set, mine, from one type of instrument, satellites, and he ignores all the other evidence. For example the surface temperature record, things like the Arctic sea ice declining….
On January 19th 2016 the Watts Up With That blog published an article by one “Christopher Monckton of Brenchley” entitled “20 false representations in one 10-minute video“. The 15th “false representation” read as follows:
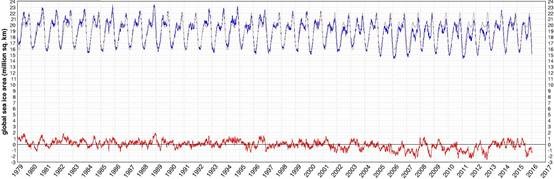
That Arctic sea ice is declining, though Antarctic sea ice has been on a rising trend and reached a satellite-era record in early 2015, and though the decline in Arctic sea ice is chiefly only in a few late-summer weeks and is a small fraction of the seasonal variation in sea-ice extent, so that neither the extent nor the trend of global sea ice (from the University of Illinois) shows much change throughout the satellite era:
Does that graph look at all familiar?
[Edit – 16:45 UTC on Tuesday February 16th 2016]
I have posted two comments on the Watts Up With That blog today, but at present neither of them is visible. In the most recent one I endeavoured to inform Monckton et al. about the news that today the Cryosphere Today global sea ice area metric posted a new “*all time low” value. Here’s my comment:
We’ll keep you posted about if and when it appears over there as well.
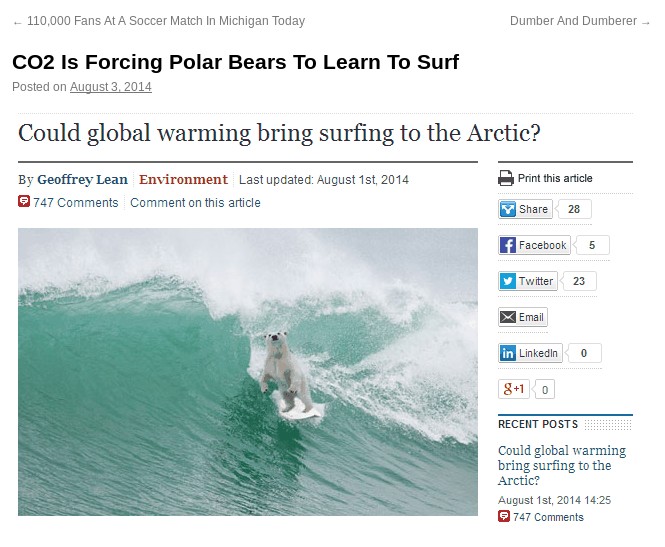
Our regular reader(s) will be already be all too familiar with the 2015 edition of our annual Great White Con 2016 “New Einstein” Award. The jury has now finished its deliberations in a smoke filled igloo just outside the Great White Con Ivory Towers. I am pleased to be able to announce that the first prize of the loan of a polar bear suit kindly donated by the Daily Telegraph plus a battered big board from Cotty’s quiver has been awarded to none other than Gail Combs with her:
Jim, How does it feel to be morally responsible for the deaths of thousands of people a year?
I’m not quite sure how we’ll get the good news to Gail in time for her to take part in the 2016 Great White Con Arctic Basin Big Wave (Fantasy?) Surfing Competition, since she abused us in her capacity as a regular commenter on “Steve Goddard’s” (un)RealScience blog, where imparting such messages is most certainly a non trivial task. Watch this space!
You will no doubt be overjoyed to learn that we already have a couple of several candidates in the running for our 2016 award, the first of which is in similar vein to Gail’s winning 2015 entry. Here they are:
1) Gary P Jackson, who claims in his Twitter profile to be a “Texan, Palinista, Conservative Activist, DragRacer Editor & Publisher”, with:
2) Anthony Watts, who is the proprietor of what he claims is “The world’s most viewed site on global warming and climate change”, has of course already “blocked” the message he doesn’t care to hear:
Without offering a single shred of evidence for his baseless assertions Anthony had this to say on the “Climate Etc.” blog of Professor Judith Curry:
You two guys are quite the pieces of work. You both operate under multiple identities. Jim Hunt has three I have been able to identify, Lawrence Martin/Martinez has two.
Both of you post off topic or disrupt threads with the sort of unsubstantiated nonsense you post above, and both demand to have these off topic comments heard and then play the “look Watts is censoring me!” game when your comments don’t meet our site comment policy and/or are abusive in nature.
Case in point- here you are making abusive off-topic comments on Dr. Curry’s site.
Plain and simple, if you comment under different identities, post off topic and/or thread disruptive comments you don’t get to participate. Mr. Hunt was warned months ago, yet he still persists in trying to get comments through under other identities such as V2G.
3) Chris Comber, who claims to be a “Mac User, ebay addict, Re-enactor & Designer” and who has of course already “blocked” the message (s)he doesn’t care to hear:
Chris is apparently keen on the #Brexit concept, and (s)he blasted out an extended sequence of (comparatively!) mild ad homs culminating in:
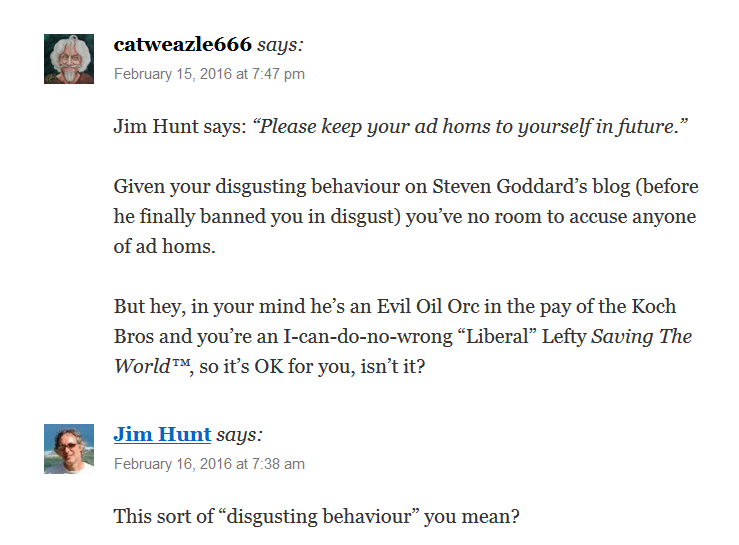
4) CatWeazle666, who is an expert emitter of ad hominem attacks on the blog of “Steve Goddard” and it now becomes apparent also on the blog of Roger Helmer MEP, the United Kingdom Independence Party’s spokesman on Energy & Industry. CatWeazle’s entry is a stream of invective which eventually culminated (for the moment at least) in:
As you can see, there was no way I was going to take that lying down, and I in all the circumstances I felt compelled to bring the attention of Mr. Helmer and his merry minions to this link:
where many moons ago there appeared a well documented account of how “Steve Goddard” really is “the dumbest man on the internet” when it comes to analysing Arctic sea ice. Either that or he does have some idea of what he’s talking about but is nonetheless more than content to pull the wool over the eyes of his very own band of merry minions.
P.S. In response to my request for considered comment concerning 3 million deaths per annum due to outdoor air pollution CatWeazle666’s reply was:
What a sad little troll you are, Jim.
5) Ben Pile, whose Twitter profile tells us that he is a “Researcher, writer, blogger. Sceptical of environmentalism, environmental policy and the fashion for ‘evidence-based policy’. For science, against scientism”. Inevitably Ben is yet another “blocker” of scientific messages he doesn’t care to hear:
Ben evidently has a high opinion of himself, and thinks he knows more about climate science than IPCC lead author Professor Richard Betts:
6) Gator69, who is yet another expert emitter of ad homs on the blog of Tony Heller (AKA “Steve Goddard”).
Over at (un)Real Climate Science I humbly suggested under an article alleging “More Arctic Fraud From Mark Serreze And NSIDC” that it is difficult to prove that Amundsen “could have gone through [the Northwest Passage] in a few weeks”. Gator’s response?
Jim “could have” helped save 21,000 innocent humans yesterday, but he didn’t did he?
Jim thinks that snuffing out 21,000 innocent humans every day for his agenda is ethical and laudable.
“Could have” is an interesting phrase. How do you intend to justify this genocide Jim?
Please feel free to provide feedback to our 2016 jury in the space provided below.
Yesterday Anthony Watts published a guest post on his “Watts Up With That” blog authored by Matt Manos. It is entitled “Why It’s So Hard to Convince Warmists“.
Being a somewhat lazy realist I reproduce it here in full, although be warned that I have used the search/replace function of my text editor a teensy-weensy bit:
Many of the posters and readers at GWC have expressed frustration at convincing pseudo-skeptics. Using facts and logic seem to fall on deaf ears. There are some interesting social sciences theories on why pseudo-skeptics are unresponsive. I know the social sciences aren’t a favoured science with this group but if you’ll bear with me, you’ll hopefully see how social science can be useful in describing why pseudo-skeptics are unreachable. And possibly, what to do about it.
In their latest speeches on global warming, Obama and the Pope weren’t trying to convince pseudo-skeptics that CAGW is real. Instead, they were sending signals to their supporters on what “all right thinking people” should be saying. This is classic in-group/out-group communication. Obama and the Pope were setting up the talking points for their in-group members to use to determine who can be considered part of the tribe and who should be rejected for being outside of it. This is a process called Othering. Othering turns political foes into non-beings. Others have no value. Others can be discounted and ignored. Others can be mocked.
Booker and Rose are examples of bellwethers; the sheep with the bell that the other sheep follow. Bellwether is not a derogatory term, it’s a descriptive term. The job of a political bellwether is to indicate the position that their followers should take in their everyday conversations. Booker and Rose’s latest articles function as position papers for the delegates of all right thinking people. You meet these people at work, church, school, at the coffee house, etc. The delegates will mirror the words that Booker or Rose used to identify other in-group members, normalize beliefs and mock out-group members. One of the main themes of both speeches was shame. Shame on those who aren’t right thinking people. Shame that they aren’t as intelligent and capable as “us.”
That type of smugness is almost impossible to penetrate. When a realist questions a pseudo-skeptic’s view on global warming/climate change, the pseudo-skeptic hears something vastly different than what the realist is saying. A realist might say, “There’s no evidence for an Arctic Ice Recovery.” What the pseudo-skeptic hears is how stupid warmists are because that’s what Anthony Watts told him he should think. If the pseudo-skeptic doesn’t prove that he thinks realists are stupid then he might be confused for a warmist! And no one wants to be identified with being a warmist because they’re mocked and don’t get invited to the right parties. No amount of science can penetrate the ROI the pseudo-skeptic has internalized in not believing in CAGW.
Many of the pseudo-skeptics are running on pure rational ignorance. Rational ignorance is a belief that the cost/benefit to researching every issue is so low as to be a net negative in time utilization. Thus the ignorance is rational and everyone utilizes this mental process on certain topics. People who are rationally ignorant about global warming look to bellwethers that support their gut stance. Rationally ignorant pseudo-skeptics would look to Australian leaders, mockutainers and denialist scientists for guidance on how to communicate their position on global warming.
Penetrating rational ignorance is tough because the position pseudo-skeptics have taken isn’t based on logic. Their position is actually based on an appeal to authority. To question the rationally ignorant denier is to question the field of science as a whole (to be a science realist) or to question the leadership of their favorite bellwether personalities. This will cause the rationally ignorant denier to become defensive and try to stand up for their favorite bellwether. The rationally ignorant will also point to their favorite bellwethers and say, “Who am I to doubt all these intelligent people?” It’s intellectually offshoring. It’s lazy. It’s human nature.
The scientific method rejects outright in-group/out groups, Othering, bellwethers and rational ignorance. A scientist is supposed to follow the results on an experiment even if the results don’t support his hypothesis. The scientist is clearly not supposed to rig the data to ensure he gets invited to a party with the right people or continued funding. But science has a poor track record on controversial topics. It often takes decades to accept new theories that are clear winners (e.g., continental drift).
Scientists are still social animals. Social animals follow hierarchy and incentives. If you really want to win the debate on global warming, change the opinions of the bellwethers. Change the economic incentives for the global warming scientific paper mill. Otherwise you’re stuck debating only the people who are unable to change their minds because it would cost them personally to do so. Rare is the person intellectually honest enough to bite the hand that feeds or is willing to violate social norms to speak the truth.
Please feel free to comment below should you spot any inadvertent errors that necessitate a bit more searching/replacing on my part. In the meantime you may be interested in watching this recording I made of a presentation by Dr. Darren Schreiber of Exeter University at a “Pint of Science” presentation last week, entitled “Your Brain is Built for Politics“:
Note in particular the part at 8 minutes 15 seconds where Darren says:
In a new study that just came out a couple of months ago they showed a single disgusting image, and one single disgusting image and measuring the brain activity and how the person responded to that was sufficient to allow you to identify if somebody was conservative or liberal. With a single brain image. With 95% accuracy!
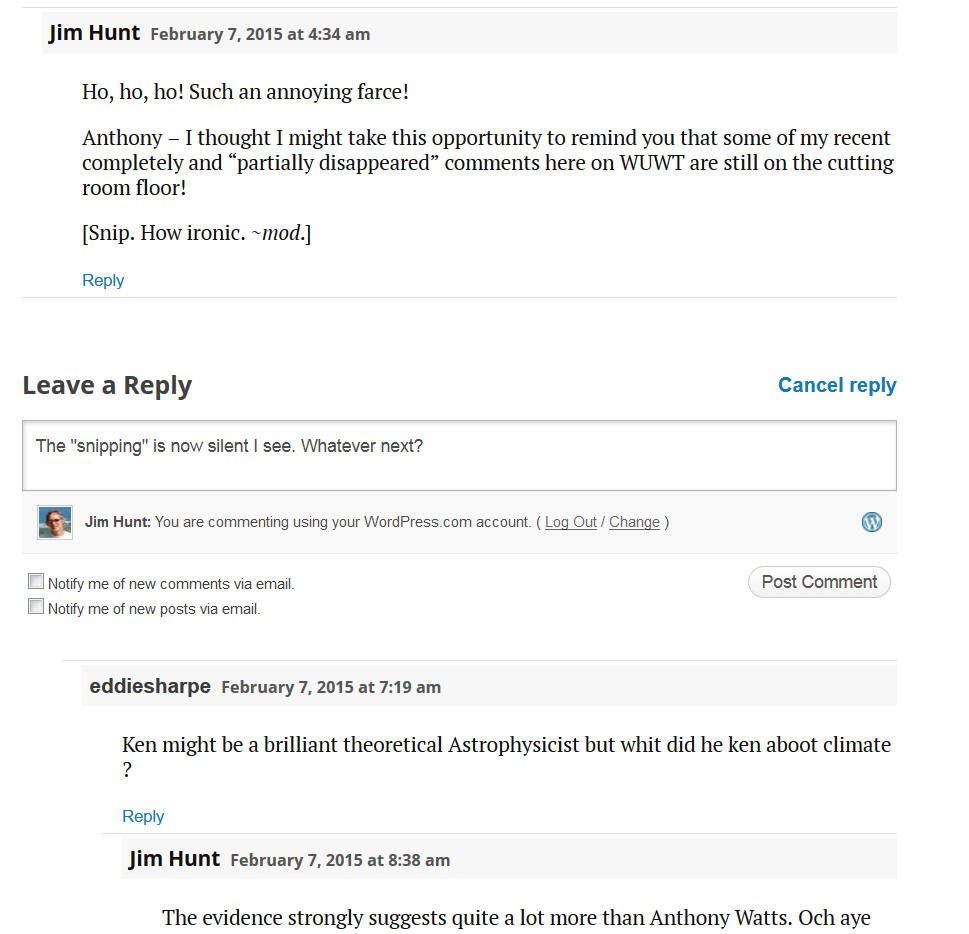
There’s an annoyance in the farce, and his moniker is “And Then There’s Physics” also known as “ATTP”
and continues to “out” ATTP by revealing his real name. Having previously fallen victim to the laser sharp investigative skills of Anthony Watts myself, I couldn’t help but wonder what Mr. Watts meant by:
I’ll have another article in the future about Dr. Ken Rice and his failures.
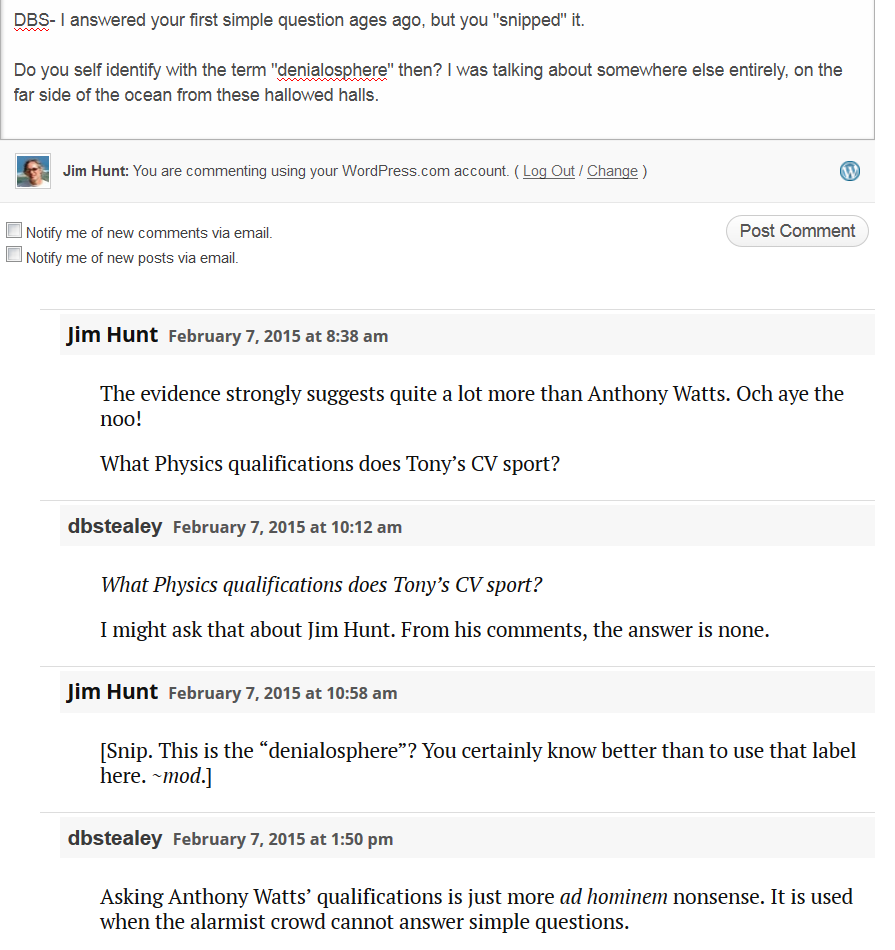
Perhaps he’s preparing one about the failures of “Snow White” and I as well? I tried to make the case that my alter ego and I are not total failures, but sadly for the two of us almost everything I said ended up on the WUWT cutting room floor. Here’s how the “snipping” operation went:
[Snip. This is the “denialosphere”? You certainly know better than to use that label here. ~mod.]
Us:
Them:
Jim Hunt
February 7, 2015 at 2:38 pm
Do you self identify with the term “denialosphere” then? I was talking about somewhere else entirely, on the far side of the ocean from these hallowed halls.
From the University of Colorado at Boulder, where they are apparently attempting to explain away why Arctic sea ice isn’t living up to previous wild claims such as those made by Dr. Mark Serreze of the National Snow and Ice Data Center, who famously said that the Arctic is in a ‘Death Spiral’ in response to my writing on WUWT:
Hence we are proud to be able to bring you this exclusive report on the “breathtaking ignorance” of the WattsUpWithThat blog! I’ve recently been publicly castigated on Twitter for our tongue in cheek “Us and Them” exposes:
I remain unrepentant, but just for once I’ll maintain a more conventional narrative. Anthony Watts continues his argument as follows:
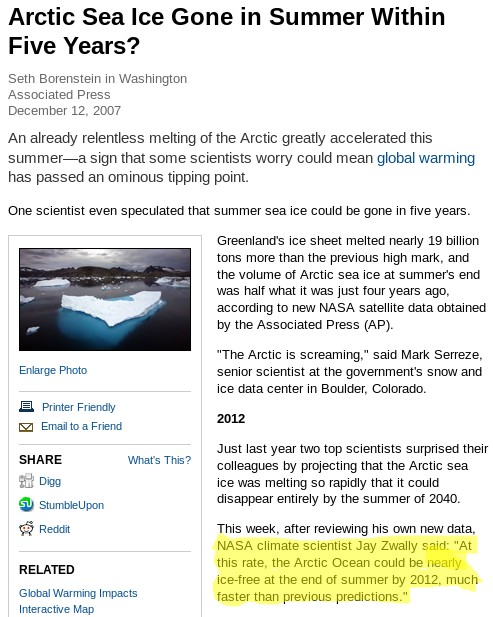
Serreze also famously said two years earlier that “The Arctic is screaming,” and that summer sea ice may be gone in five years, in an interview with the unquestioning and compliant Seth Borenstein at the Associated Press:
He helpfully highlights in yellow what Seth Borenstein said Mark Serreze said way back when in 2007. Note that no “predictions” or even “projections” are mentioned. So where do you suppose Tony’s “summer sea ice may be gone in five years” came from?
Here we provide our own screenshot of the National Geographic article in question, grabbing a slightly larger area of the screen, and highlighting a section slightly further down the page:
For those who have difficulty reading small print, such as Anthony Watts and his merry band of unquestioning and compliant followers over at WUWT, here is the unexpurgated transcript of our highlight in large letters:
NASA climate scientist Jay Zwally said: “At this rate, the Arctic Ocean could be nearly ice-free at the end of summer by 2012, much faster than previous predictions.”
Note firstly that this is a projection rather than a prediction, and secondly that it was reportedly uttered by Jay Zwally of NASA, not Mark Serreze of NSIDC!
Quod erat demonstrandum, and if so one cannot help but wonder how many similar blunders Mr. Watts has made over the course of his illustrious publishing career?
As luck would have it I interviewed Mark Serreze, who is currently director of the NSIDC, not so very long ago. I enquired whether the “Death spiral” story was apocryphal or not. Mark told me he did recall saying something along those lines to a journalist, but that he couldn’t recall the exact circumstances. I also asked if he was willing to make any “predictions” about the decline of sea ice in the Arctic. Mark told me that he still stood by his 2030 estimate for the onset of a seasonally ice free Arctic, although:
Most models say more like 2050
Doing my own due diligence (unlike the readers of Watts Up With That!) the earliest reference I could find to such a “prediction” involved a telephone interview much like the one I had just conducted. In an article dated August 27th 2008 the Reuters environment correspondent reported that:
This year’s Arctic ice melt could surpass the extraordinary 2007 record low in the coming weeks. Last year’s minimum ice level was reached on September 16, according to the National Snow and Ice Data Center.
Even if no records are broken this year, the downward trend in summer sea ice in the Arctic continues, the Colorado-based center said. Last year’s record was blamed squarely on human-spurred climate change.
“No matter where we stand at the end of the melt season it’s just reinforcing this notion that Arctic ice is in its death spiral,” said Mark Serreze, a scientist at the center. The Arctic could be free of summer ice by 2030, Serreze said by telephone.
So there you have it. Unless someone can come up with some evidence to the contrary (unlike Watts and the Watties), it looks to me like Mark Serreze has been consistently saying for many years:
The Arctic could be free of summer ice by 2030
or words to that effect. Expect more from me on my interview with Mark Serreze in due course.
[Edit – February 1st]
Without a word of thanks to yours truly Anthony Watts has now published an “Update” to his original article. The salient bits read as follows:
The original article implied that NISDC’s Mark Serreze made the statement about sea ice being gone in 5 years, ending in 2012, when it was actually NASA’s Jay Zwally that made the claim in the National Geographic article. The language has been clarified in the paragraph to reflect this.
Serreze also famously said two years earlier that “The Arctic is screaming,” and a Arctic research associate, Jay Zwally of NASA, said in the same article that summer sea ice may be gone in five years, in an interview with the unquestioning and compliant Seth Borenstein at the Associated Press.
Anthony obviously hasn’t taken on board my helpful remarks about the difference between a prediction and a projection, and hence he waxes lyrical about how the sea ice in the Arctic didn’t vanish in the summer of 2012. He signs off by saying:
To my knowledge, Dr. Serreze has never publicly corrected the National Geographic article claim of 2012 being the ice-free year that wasn’t, suggesting he endorsed the idea at the time.
Have I got news for you Anthony. It doesn’t suggest anything of the kind! In addition to suggesting strange things to the suggestible Mr. Watts has so far neglected to answer this question posed by a commenter on the article in question:
I look forward to seeing any substantive replies to Jim Hunt’s clarifying post.
and so far he has also neglected to publish my response to that question. It included this video of my namesake, James Hunt, conversing with a couple of clueless mechanics:
Anthony Watts has also thus far neglected to explain how he inexplicably (in all the circumstances) successfully attributed the supposed 2012 “prediction” to Jay Zwally in this 2012 article, that also included a highlighted screenshot much like mine above:
In four months, just 132 days from now at the end of summer on the Autumnal Equinox September 22nd 2012, the Arctic will be “nearly ice free” according to a prominent NASA scientist in a National Geographic article on December 12, 2007.
I don’t usually get involved in debates about “the global warming pause”, but as you will eventually see there is an Arctic connection, so please bear with me. Personally I reckon “global heat” is more relevant than “global surface temperature”, but nevertheless NASA and NOAA issued a “news release” a couple of days ago stating that:
The year 2014 ranks as Earth’s warmest since 1880, according to two separate analyses by NASA and National Oceanic and Atmospheric Administration (NOAA) scientists.
The 10 warmest years in the instrumental record, with the exception of 1998, have now occurred since 2000. This trend continues a long-term warming of the planet, according to an analysis of surface temperature measurements by scientists at NASA’s Goddard Institute of Space Studies (GISS) in New York.
In an independent analysis of the raw data, also released Friday, NOAA scientists also found 2014 to be the warmest on record.
The announcement was accompanied by this video:
I figured our old friend David Rose would have something to say about all that in the Mail on Sunday, and I was not disappointed. Yesterday David reported, in bold headlines:
Nasa climate scientists: We said 2014 was the warmest year on record… but we’re only 38% sure we were right
Nasa’s Goddard Institute for Space Studies claimed its analysis of world temperatures showed ‘2014 was the warmest year on record’
But it emerged that GISS’s analysis is subject to a margin of error
Nasa admits this means it is far from certain that 2014 set a record at all
David Rose includes this NASA video in the online version of his article:
which finishes up showing the Arctic blanketed in red for the period 2010-14. In the body of the article David suggests that:
GISS’s director Gavin Schmidt has now admitted Nasa thinks the likelihood that 2014 was the warmest year since 1880 is just 38 per cent.
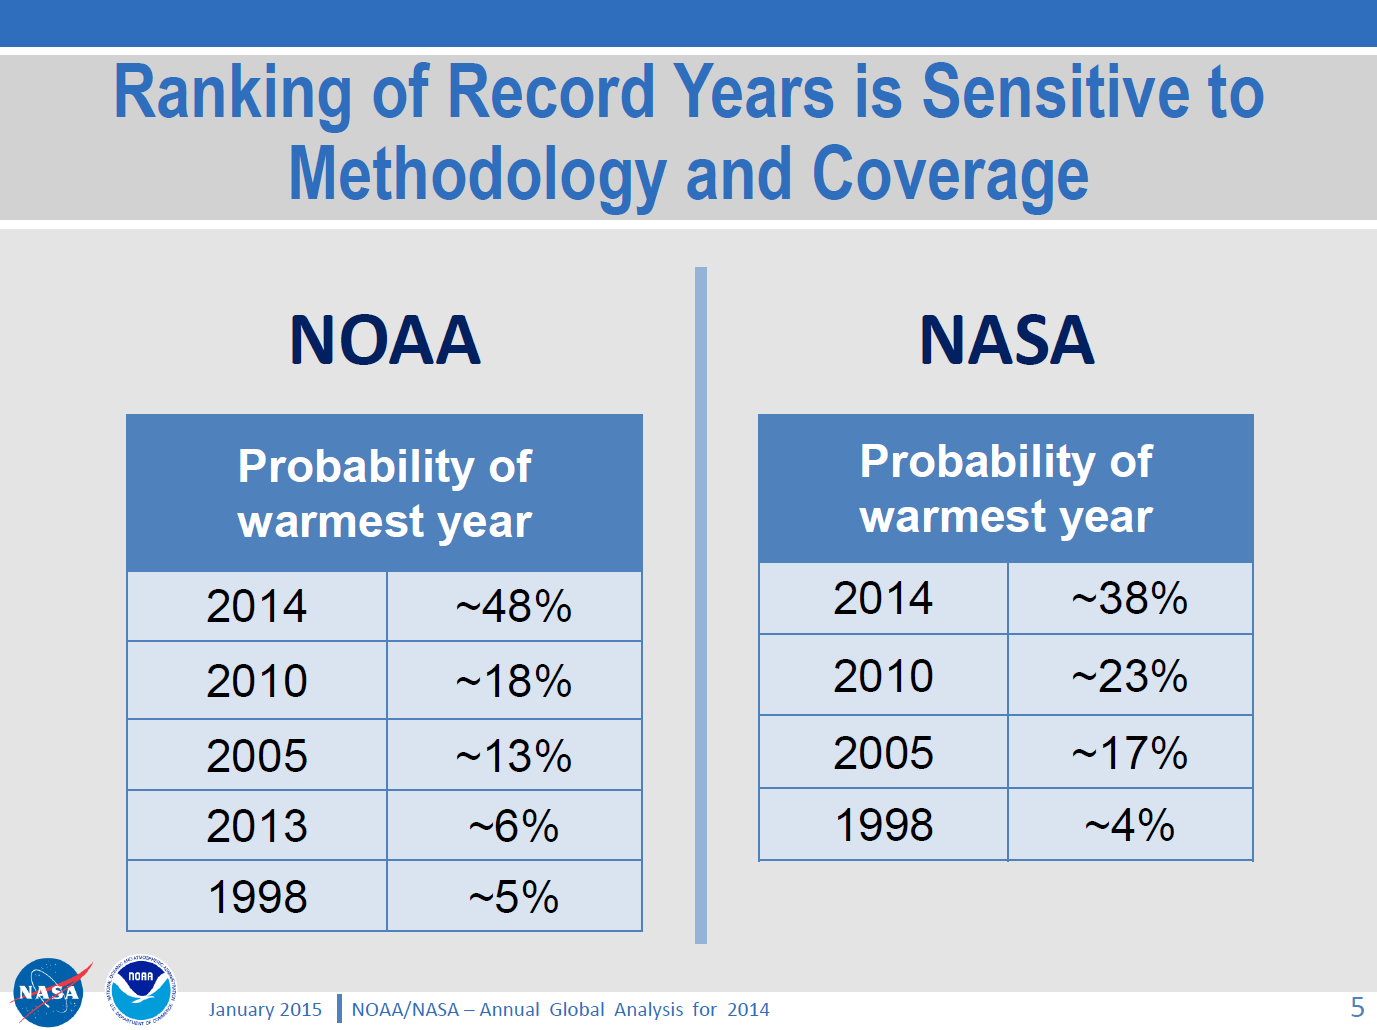
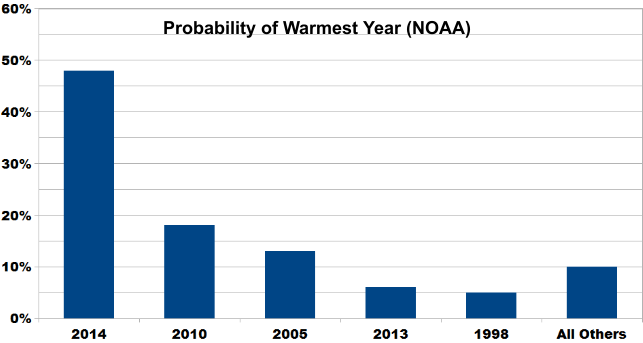
but for some strange reason David neglects to mention this NASA/NOAA “press briefing“, which includes the following figure:
As you can see and hear, Gavin Schmidt’s “admission” was pretty public, and available for anyone doing their due diligence on this thorny topic to see well before the Mail on Sunday published David Rose’s article. For still more from Gavin see also the second half of yet another video from NASA, which we’ve hastily made embeddable from YouTube since NASA’s Goddard Space Flight Center don’t seem to have done so themselves as yet:
[Edit – 23/01/2015]
By way of further elucidation of the NASA/NOAA table of probabilities above, here’s a new graphic courtesy of Skeptical Science:
The probability of 2014 being the warmest year (due to margin of uncertainty and the small differences between years) is almost ten times that of 1998. And the contrarians were very certain that year was warm!
Does that help make things clearer, for those who evidently have difficulty understanding statistics?
[/Edit]
I also figured that the likes of “Steve Goddard” and Anthony Watts would be jumping on the same bandwagon, so you can imagine my disappointment when I discovered that they have both, unlike Gavin, blocked me from their Twitter feeds! Venturing over to the so called “Real Science” blog instead I discovered that Steve/Tony does at least read Gavin’s Twitter feed, although apparently not NASA/NOAA press briefings:
Them:
Implausible Deniability
Gavin is playing his usual game, trying to cover his ass with “uncertainty” that wasn’t mentioned in the NASA press release.
They get the propaganda out there for the White House and major news outlets, then try to generate implausible deniability through back channels like twitter. None of this was mentioned in the NASA press release.
Us:
I take it you weren’t on the call either Tony? Have you by any chance seen this press briefing?
THE DATA ON WEATHER AND CLIMATE (NASA AND NOAA) CAN BE COMPARED TO THE STOCK MARKET ON WALL STREET, MUCH CORRUPTION AND ALTERING. WE ARE NOT GUARANTEED A CERTAIN TEMPERATURE EVERYDAY; ALTHOUGH, THAT IS WHAT THEY WOULD HAVE US THINK, JUST BECAUSE OF SEASONS IN GENERAL.
Further to previous correspondence on similar matters, on January 27th 2015 I received the following email from the Personal Assistant to John Wellington, David Rose’s managing editor at the Mail on Sunday:
Dear Jim,
Thank you for your email.
I am afraid the best person to deal with your question is John Wellington who will reply on his return at the beginning of March.
Thank you for your patience.
Kind regards
Poppy Hall
Us:
CC: IPSO.co.uk
Dear Poppy,
Thanks for that information, but I am afraid my almost infinite patience in this matter is exhausted.
In John’s absence perhaps I might reiterate a question posed by Bob Ward of The Grantham Institute on Twitter yesterday:
Predictable that Mail on Sunday censored all letters pointing out errors in last week's article by @DavidRoseUK about @NASAGISS
Please would you ask whoever owns the desk on which the buck currently stops for the article entitled “Nasa climate scientists: We said 2014 was the warmest year on record… but we’re only 38% sure we were right” by David Rose to communicate with me as soon as possible. FYI – Here it is:
As I’m sure you must realise by now, unfortunately it includes some inaccurate and/or misleading statements which as far as I can ascertain have still not been publicly corrected.
Best wishes,
Jim Hunt
Post Script:
Bob Ward lodged a formal complaint with the Independent Press Standards Organisation about the Mail on Sunday article. Their conclusion?
The complaint was not upheld.
Remedial Action Required – N/A
Date complaint received: 13/02/2015
Date decision issued: 22/06/2015
Their “reasoning”?
The Committee noted that information about the margin of error had been made available by GISS, but that it was not in dispute that these details had been omitted from the press release. The article had made clear that this specifically was the basis for its criticism of Nasa, and the newspaper was entitled to present its view that this omission represented a failure on the part of the organisation. While the information had been released by Nasa, it had been released to a limited selection of people, in comparison to those who would have had access to the press release, and had not been publicised to the same level as the information in the release. The press briefing images referred to by the complainant were available on Nasa’s website, but were not signposted by the press release. In this context, it was not misleading to report that the information relating to the margin of error had emerged in circumstances where the position was not made clear in the press release. While these details of the margin of error may have been noted in a press briefing two days previously, rather than “yesterday”, as reported, this discrepancy did not represent a significant inaccuracy requiring correction under the terms of the Code.
My title today refers to the fact that the summer Arctic sea ice forecasting season is with us once again. The ARCUS Sea Ice Outlook (SIO for short) started in 2008, with the aim of gathering together and publishing “community predictions of the September sea ice extent”. The SIO is now part of the recently created Sea Ice Prediction Network, and the deadline for submission for the first set of forecasts of 2014 was June 10th.
I have a professional interest in UK and international energy policy, and as a consequence I have been commenting on the recent attempts of Professor Richard Tol to debunk the so called “97% climate change consensus” elsewhere in the blogosphere. As luck would have it I allowed myself to become engaged in what was supposedly a conversation about that very topic on the What’s Up With That blog. Feel free to read all about it if you’d like to see a pseudo-skeptical gish gallop in full swing:
Whilst over there I couldn’t help but notice that Anthony Watts had left things until the eleventh hour before asking his faithful followers to contribute to the Sea Ice Outlook June survey. I also couldn’t help but notice that despite assurances to the contrary a few short weeks ago (and even after my recent “extra heads up“!) the WUWT “Sea Ice Reference Page” is still sadly lacking in a wide range of information about Arctic sea ice thickness and volume. Consequently I figured I would be performing a valuable public service by bringing this to the attention of Anthony and his readers. Here’s what happened after that:
Us:
Them:
June 10, 2014 at 8:55 am
[snip no, we are not going to have you thread-jack again by pushing your own website and own views – Anthony]
Us:
June 10, 2014 at 9:32 am
Re: @Anthony says: June 10, 2014 at 8:55 am
It’s not my “own views” Anthony. In fact it’s a long list of useful facts and figures for anybody attempting to forecast the future of Arctic sea ice. A long list of useful information still noticeable only by its absence from the WUWT sea ice reference page.
Them:
REPLY: We aren’t forecasting volume, we are forecasting extent, so again, your views that we should pay attention to volume graphs on your website (your favorite hobby horse) in this extent forecasting exercise are irrelevant. Don’t clutter up this thread further – Anthony.
Them & Us:
@wattsupwiththat What’s up with my “commenting style”? What’s up with my “own self” for that matter?
In the absence of a wide range of scientific information concerning the current thickness distribution of sea ice in the Arctic, and after due deliberation about the likely value of the NSIDC Arctic sea ice extent metric in September 2014, Anthony concluded:
A value of 6.12 million sq km will be sent to ARCUS.
Us:
We’ll keep you posted!
This website uses cookies to improve your experience. We'll assume you're ok with this, but you can opt-out if you wish. Cookie settingsACCEPT
Privacy & Cookies Policy
Privacy Overview
This website uses cookies to improve your experience while you navigate through the website. Out of these, the cookies that are categorized as necessary are stored on your browser as they are essential for the working of basic functionalities of the website. We also use third-party cookies that help us analyze and understand how you use this website. These cookies will be stored in your browser only with your consent. You also have the option to opt-out of these cookies. But opting out of some of these cookies may affect your browsing experience.
Necessary cookies are absolutely essential for the website to function properly. This category only includes cookies that ensures basic functionalities and security features of the website. These cookies do not store any personal information.
Any cookies that may not be particularly necessary for the website to function and is used specifically to collect user personal data via analytics, ads, other embedded contents are termed as non-necessary cookies. It is mandatory to procure user consent prior to running these cookies on your website.