Regular readers will no doubt recall that I have previously been “banned” on trumped up charges at the “Watts Up With That” blog. It thus came as a pleasant surprise when I recently popped back there and tried to pass comment on a “reprint” of an article by Professor Byron Sharp in Medium entitled “How I changed my mind… about global warming“:
Most, if not all, people would consider themselves to be open-minded. Yet, if you ask someone to name an important belief that they have changed their mind about, in response to evidence and/or logic, most struggle to give even one example.
This is the first in a series of blogs where I describe how and why I changed my mind about something. I hope to encourage myself to change my mind more often. And to encourage others.
Short summary: I now worry less about global warming than I did, the scientific evidence is that it’s not going to be catastrophic. PS Our best course of action is to adapt to the effects and to invest in R&D to develop new low carbon energy.
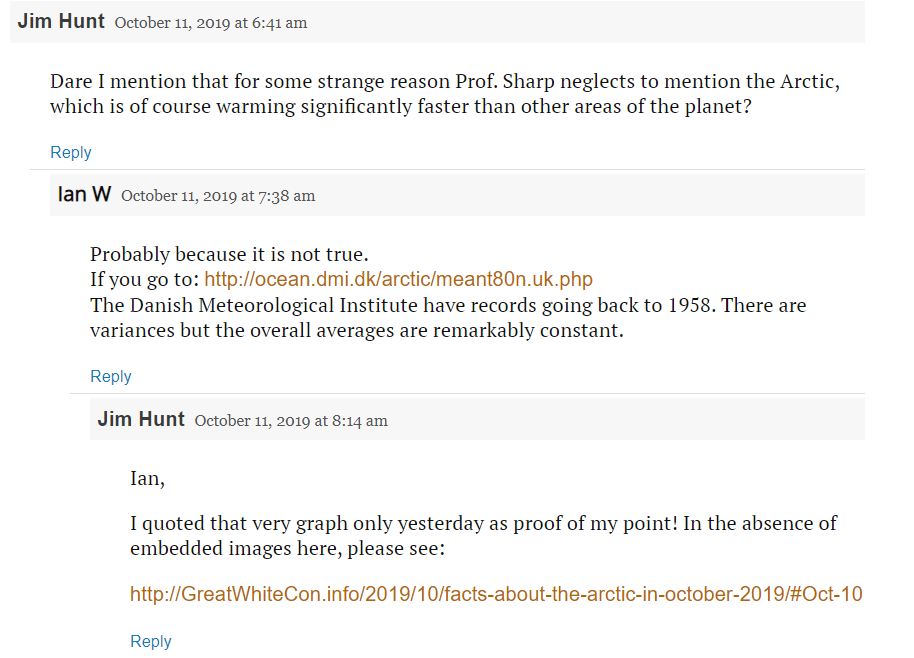
My initial comments survived the onerous WUWT moderation process and several of them were published without undue delay. The gist of my argument was quite simple:
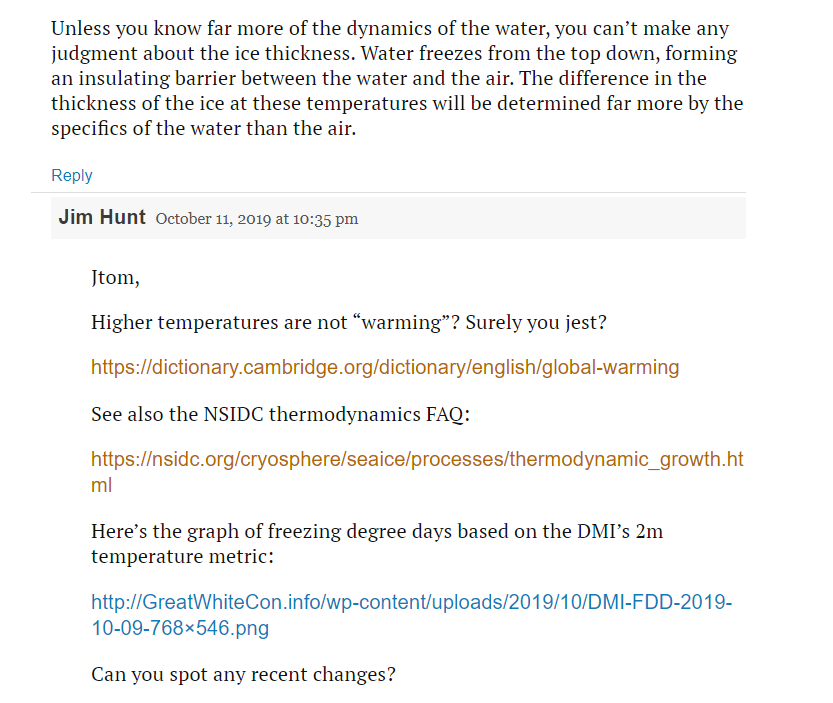
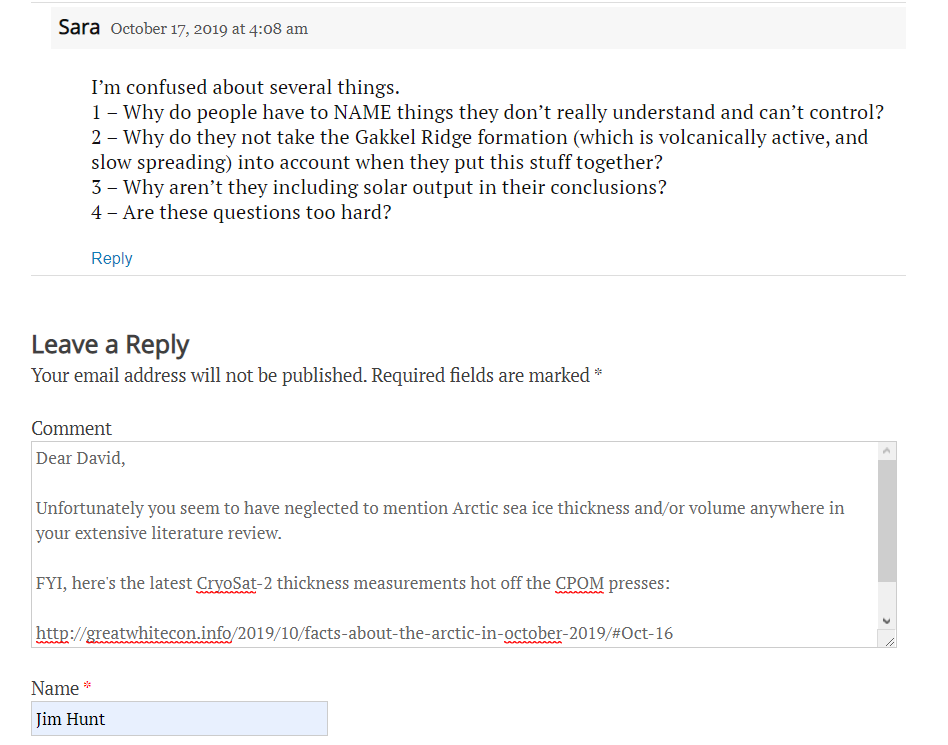
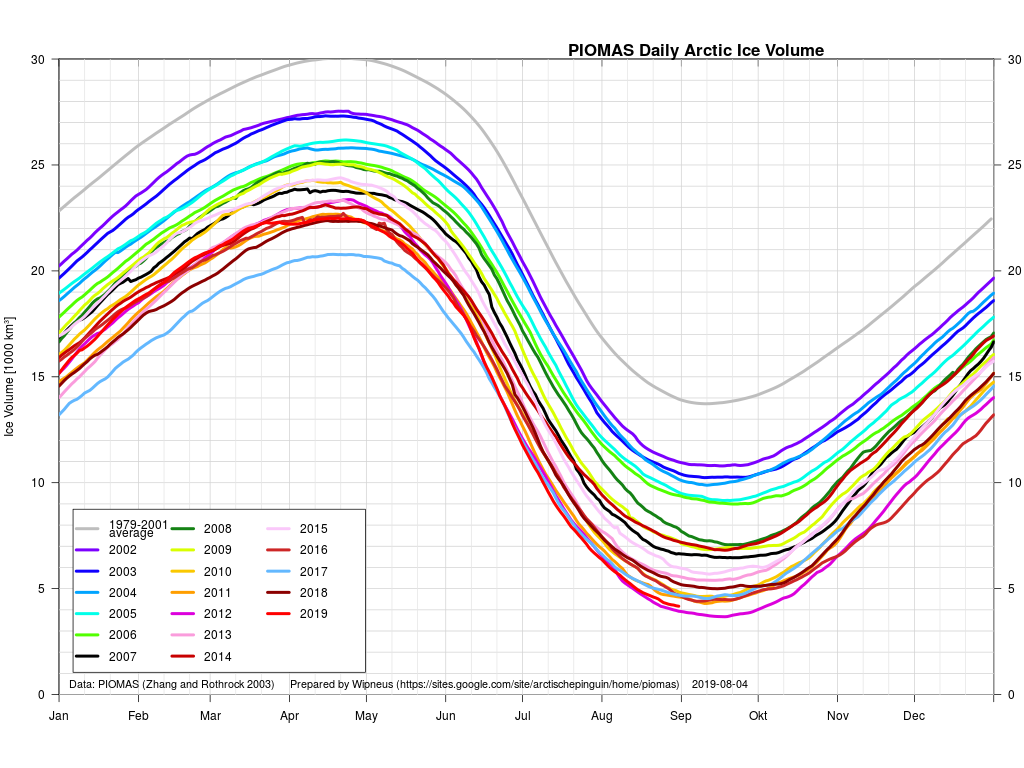
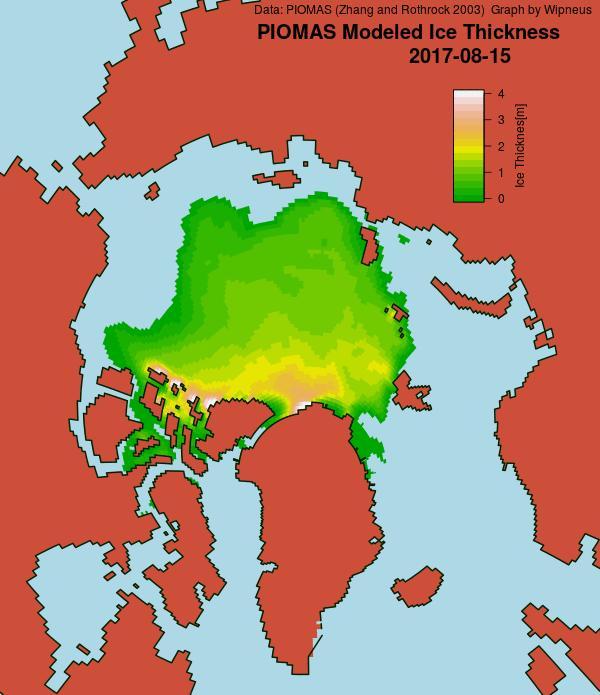
I even managed to comment when somebody introduced the word “thickness” into the discussion:
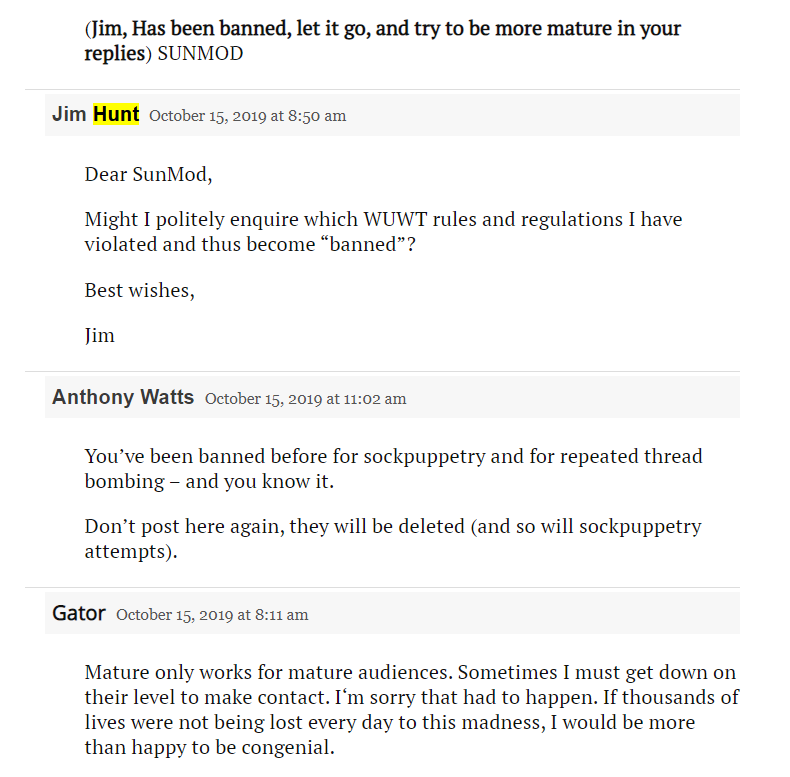
Needless to say my good fortune couldn’t last forever, and eventually Anthony himself was on my case:
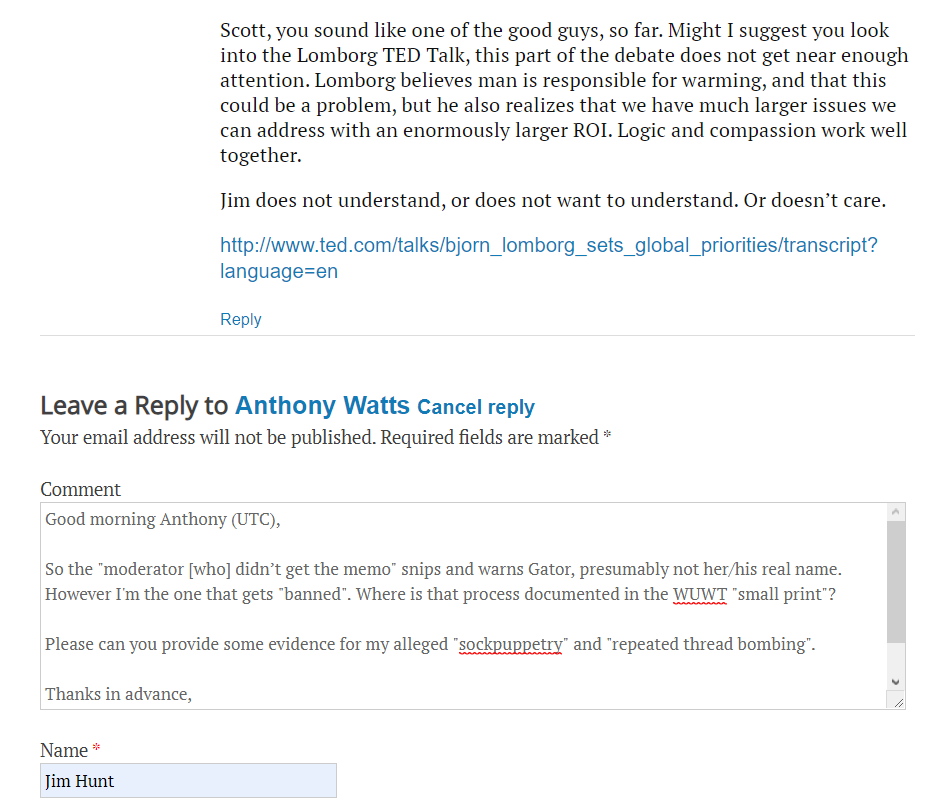
My request for an explanation has thus far been ignored:
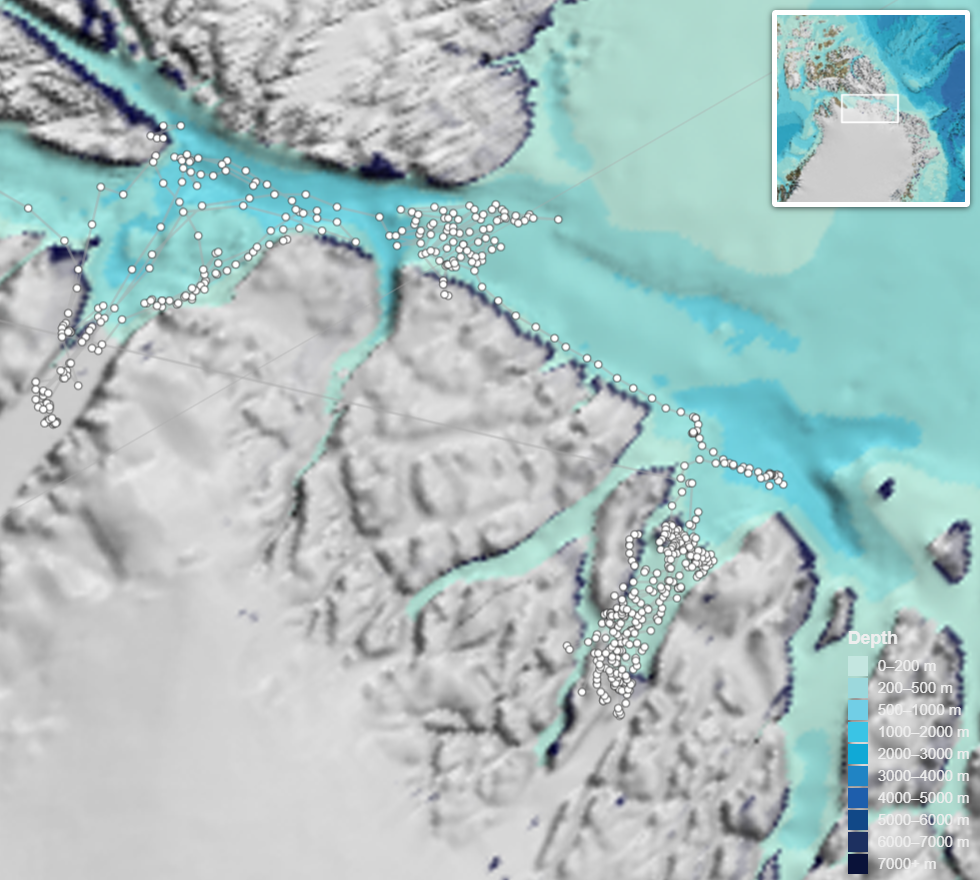
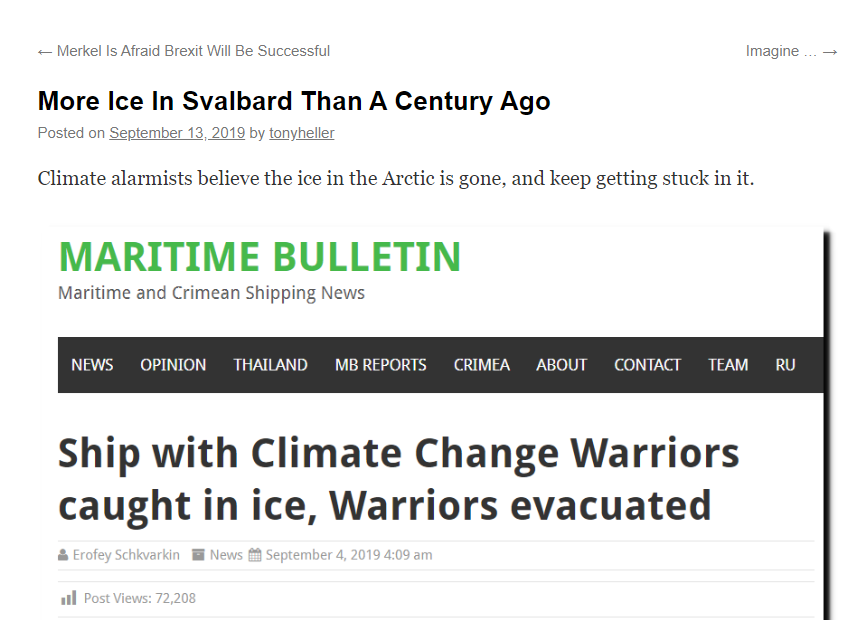
How “unfortunate” it is then, that a couple of days after my “banning” on yet more trumped up charges WUWT published an article by David Middleton entitled “Back to the Anthropocene! Arctic Sea Ice Edition”, telling a familiar tale:
Two key takeaways:
Maximum Holocene sea ice extent occurred within the past 500-1,000 years at every location.
The current sea ice extent is higher at all of the locations than over 50% to 85% of the Holocene.
A significant reduction in Arctic summer sea ice relative to today, would be returning to Early Holocene conditions. If we currently have an “Anthropocene in the Arctic,” it’s actually icier than most of the Holocene’s “Goldilocks conditions.”
David’s article once again neglected to mention Arctic sea ice thickness and/or volume. My plaintive cries were made in vain:
Amongst other things my recent “banning” from Watts Up With That means I am unable to ask David the same question my Arctic alter ego “Snow White” recently put to Down Under’s favourite skeptical senator, Malcolm Roberts:
What were the sea levels in London like at the time @MRobertsQLD? Or Miami, or Manhattan, or Dhaka?
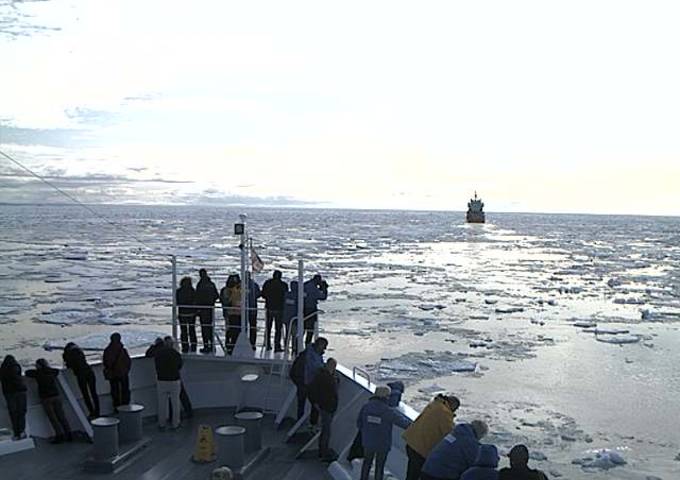
Arctic tours ship MS MALMO with 16 passengers on board got stuck in ice on Sep 3 off Longyearbyen, Svalbard Archipelago, halfway between Norway and North Pole. The ship is on Arctic tour with Climate Change documentary film team, and tourists, concerned with Climate Change and melting Arctic ice. All 16 Climate Change warriors were evacuated by helicopter in challenging conditions, all are safe. 7 crew remains on board, waiting for Coast Guard ship assistance.
Something is very wrong with Arctic ice, instead of melting as ordered by UN/IPCC, it captured the ship with Climate Change Warriors.
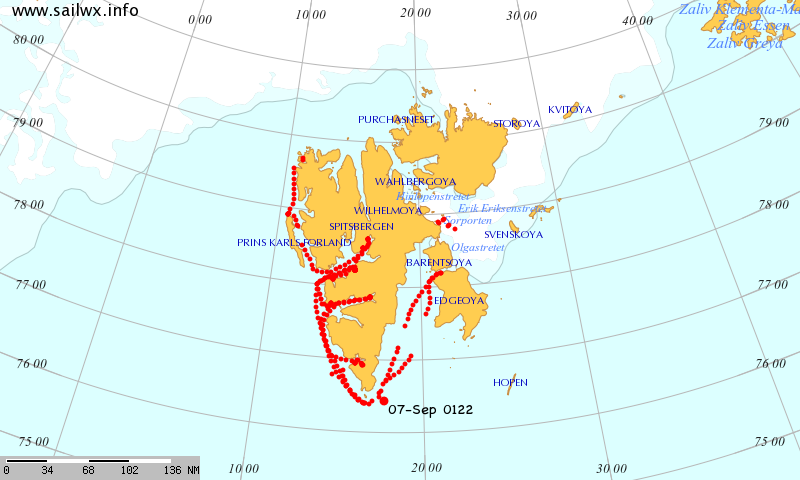
Not a lot of people know that despite all that purple prose Malmö has somehow managed to emerge unscathed from the clutches of the sea ice on the other side of Svalbard from Longyearbyen:
It will come as no surprise to our regular readers that the web site of our even older friend Anthony Watts has also published the self same story, also without the happy ending.
Whilst it is reasonable to assume that Paul and Anthony are not fluent in Norwegian, it seems they are also unfamiliar with Google. If they had performed the merest modicum of due diligence and employed the services of Google translate before pressing the “publish” button they would have discovered the coverage of the “massive false information” about the Malmö’s story in the Svalbard Post, published on September 5th:
Trygve Monsen and expedition leader Tore Toppe were among the 16 who were evacuated when MS Malmö got stuck in the ice on Tuesday. They respond strongly to what they call misinformation on the right-wing website document.no
Those who were on board MS Malmö have a completely different version of events.
“First, we are not Swedish. We are a group of middle aged Norwegians following the route of the Ahlmann expedition of 1931“, says Trygve Monsen. He himself has worked for the Norwegian press for a long time, particularly Aftenposten, where he has been both digital manager and correspondent in Berlin.
Together with Expedition Chief Tore Topp, Monsen arrived at the Svalbard Post on Thursday. He had tried to contact document.no many times before that, to correct the false information. They also say that they are not climate activists.
“No way. But when you are in the Arctic, and have been here many times over several years, you can’t help but notice what is happening to the environment up here”, says Topp. This is the seventh expedition he has led in the Arctic.
The evacuation of MS Malmö on Tuesday took place without significant drama. The boat was surprised by harsh ice conditions and eventually got stuck. The captain decided to ask for evacuation, for safety. The Governor came by helicopter and after a few minutes all the passengers were evacuated. The crew on the boat remained on board, and later got help from KV “Andenes” to get out of the sea ice.
In other old news the southern route through the Northwest Passage opened on August 15th this year, although with the assistance of the icebreaker CCGS Terry Fox the MS Bremen made it through a few days earlier:
[Edit – September 11th]
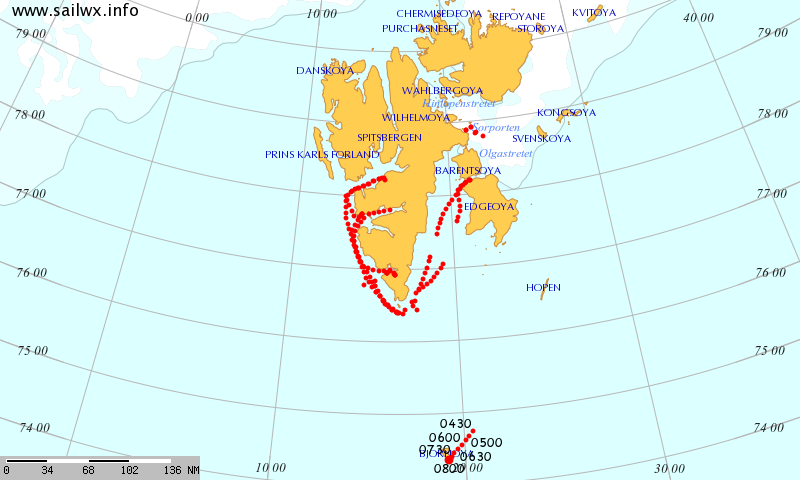
MS Malmö is now back in the range of an AIS receiver, whilst apparently en route back to Norway:
[Edit – September 12th]
I ventured onto Twitter this morning, where I discovered Matt Ridley regurgitating the same nonsense about MS Malmö, plus this news from the Norwegian Coastguard:
Kystvakten fikk melding om at MS Malmø trengte assistanse sør i Hinlopen-stredet. Da KV Andenes kom frem til området hadde MS Malmø klart å komme seg løs fra isen i åpen råk. Fartøyet ble eskortert ut av området og MS Malmø går nå for egen maskin tilbake til Longyearbyen. pic.twitter.com/ZFpa6fEmCN
Perhaps Paul, Anthony, Matt et al. would care to click @Jack’s helpfully provided “Translate Tweet” button?
I’ve also discovered that document.no eventually published a “correction” to their original story on September 9th. Perhaps Paul, Anthony, Matt et al. would care to follow suit?
Yet another greenie expedition to the Arctic to raise awareness of ‘global warming’ has been scuppered by unexpected large quantities of ice.
Furthermore James has brought my attention to the fact that my foolish numbering system is out of date. According to his reckoning MS Malmö is actually “Ship of Fools IV”. Mind you he’s also claiming that Northabout was “Ship of Fools II”, which is obviously another porkie pie of epic proportions.
James also repeats the “stuck in ice off Longyearbyen” nonsense. For Donald, James, Paul, Anthony, Matt et al. here’s the current view of all the sea ice off Longyearbyen, via Joss Stone on Twitter:
Wow, this place is stunning. Feel very lucky to be here. Cant wait to share our experiences with you. Now, where can I get a cup of tea? #arcticpic.twitter.com/JpjbS48Ebj
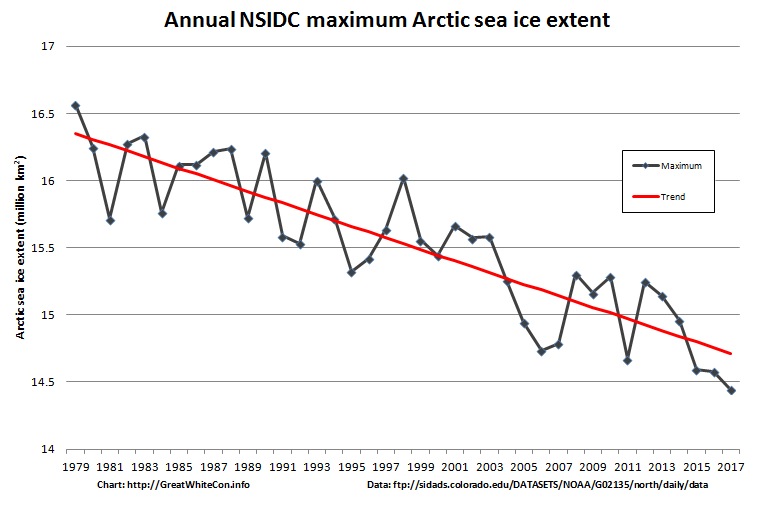
In actual fact there is of course currently less sea ice in the Arctic than in any previous year (in the satellite record) apart from 2012:
[Edit – September 13th]
Today on Twitter I’ve found myself in conversation about #MalmoGate with Ken. He doesn’t say an awful lot, but he appears to think that MS Malmö being “surprised by harsh ice conditions” is significant in some way:
What’s that supposed to prove Ken?
According to #WUWT “MS Malmo… got stuck in ice on Sep 3 off Longyearbyen”
The captain would have been very surprised to encounter such conditions, because that’s unadulterated ballcocks! #MalmoGate
One of the things that is actually significant about the 2019 melting season is quite the reverse of that. The Swedish icebreaker Oden spent a couple of weeks pootling around in the Sherard Osborn Fjord in North Greenland without getting “stuck in the vanishing Arctic ice”:
[Edit – September 14th]
What Ken, Paul Joseph, Donald, James, Paul, Anthony, Matt et al. evidently fail to comprehend is that the sea ice covering the Arctic Ocean doesn’t merely expand and contract with the seasons. It also moves. Just in case any of them do get around to doing a modicum of due diligence, take a good long look at this animation of Arctic sea ice age from the September 2015 minimum to the end of August this year:
[Edit – September 15th]
It has just come to my attention that our very old friend Tony Heller (the artist formally known as Steve Goddard) has somewhat belatedly jumped on the MalmoGate bandwagon:
The celebrated web site of our old friend Anthony Watts published an article yesterday entitled “The polar ice melt myth“. As a self styled expert on that particular topic I popped over there expectantly, only to discover that it is an actual fact a cut ‘n’ paste of an April 30th article by Dr. Jay Lehr at CFACT. Part of that article reads as follows:
Al Gore predicted in 2007 that by 2013 the Arctic Ocean would be completely ice free. In the summer of 2012 ice levels did reach all time lows in the Arctic. Emboldened by this report Australian Professor Chris Turney launched an expedition in December of 2013 to prove that the Antarctic Sea Ice was also undergoing catastrophic melting only to have his ship trapped in sea ice such that it could not even be rescued by modern ice-breakers.
The Professor should have known that a more accurate estimate of sea ice can be had from satellite images taken every day at the Poles since 1981. These images show that between summer and winter, regardless of the degree of summer melting, the sea ice completely recovers to its original size the winter before for almost every year since the pictures were taken. The sea ice has been stubbornly resistant to Al Gore’s predictions. In fact the average annual coverage of sea ice has been essentially the same since satellite observations began in 1981. However that has not stopped global warming advocates and even government agencies from cherry picking the data to mislead the public.
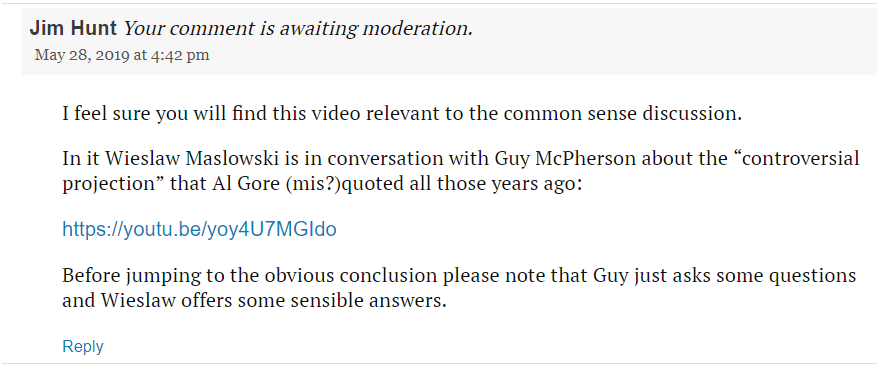
I also like to think that I’m something of an expert on the way “skeptical” folks cherry pick the data to mislead the public. For example I once wrote a post about David Rose‘s Mail on Sunday article concerning Al Gore’s interpretation of Prof. Wieslaw Maslowski’s research into Arctic sea ice decline. Hence I felt compelled to comment on this most recent of misleadling WUWT articles about polar ice!
As luck would have it Guy McPherson recently interviewed Wieslaw about events back in 2007 and his more recent research on Arctic sea ice melt. Here is a video recording of their conversation:
I endeavoured to bring this most relevant piece of information to the attention of Anthony’s loyal readership last night (UTC) as follows:
This morning my pertinent comment is still “awaiting moderation”.
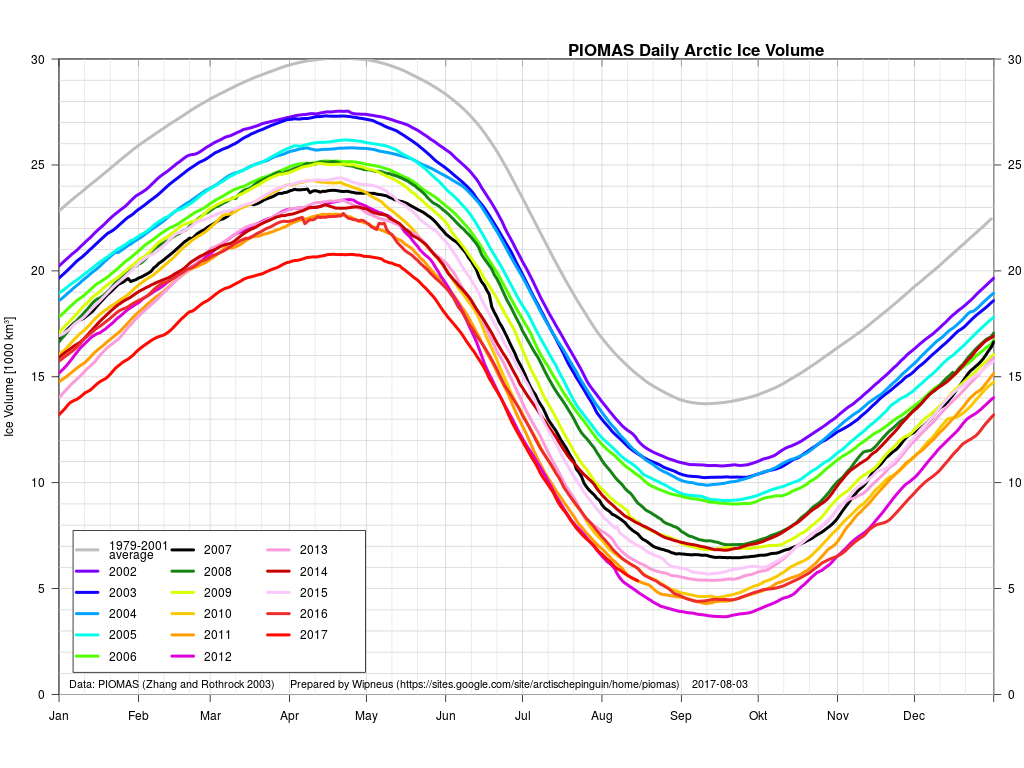
What seems likely to be the most interesting period of the 2017 Arctic sea ice melting season is upon us! The PIOMAS gridded data hasn’t been released yet, but the overall volume numbers reveal that 2017 has now relinquished its “lowest ever” position to 2012. Here’s Wipneus’ graph of the volume data:
plus his anomaly plot:
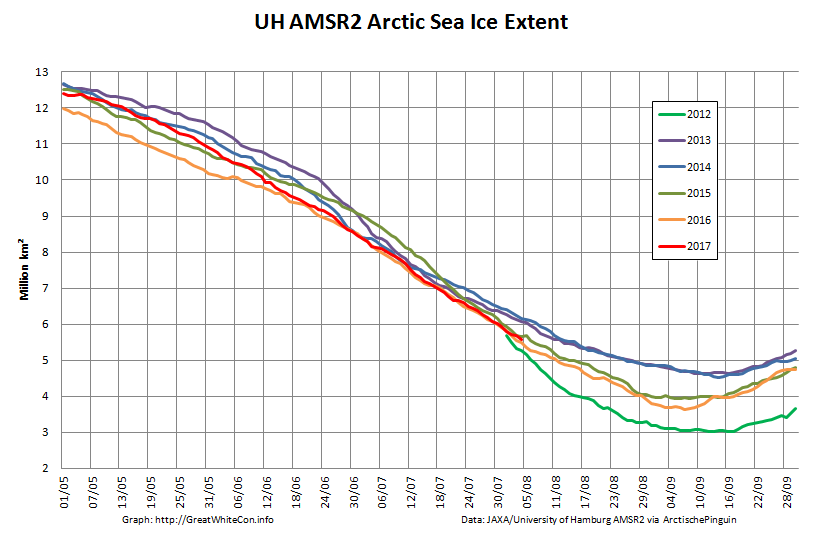
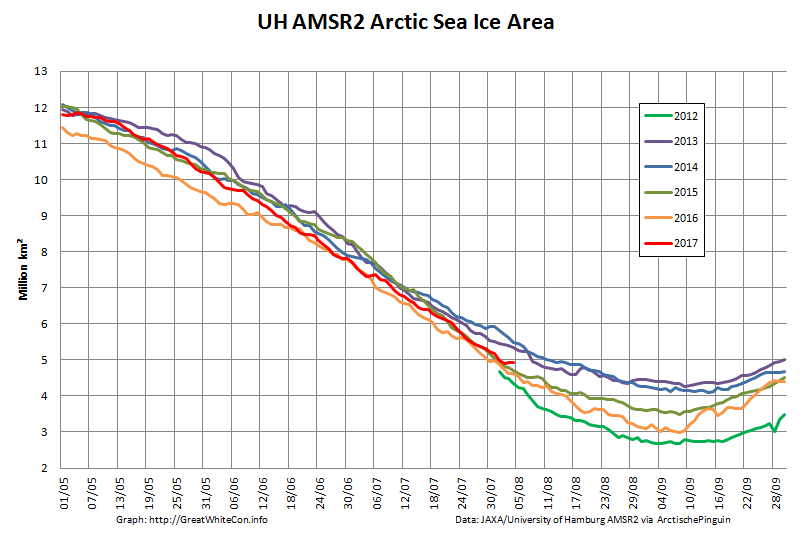
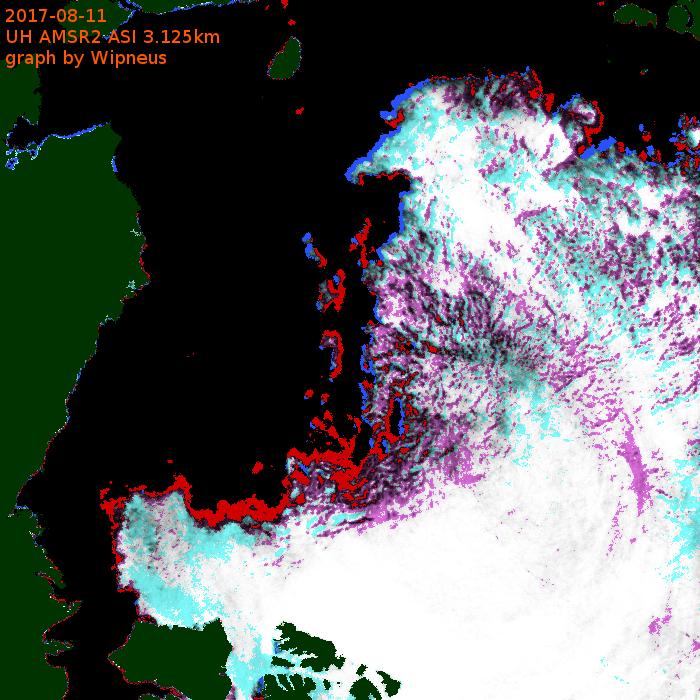
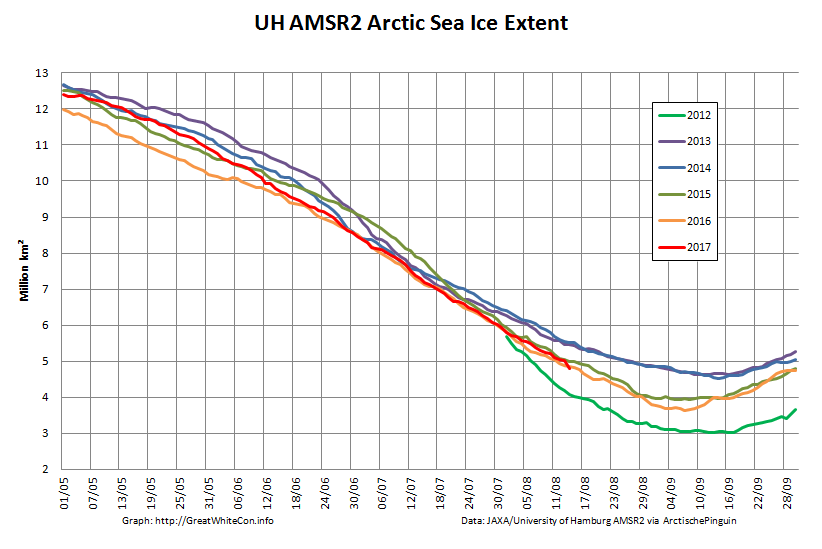
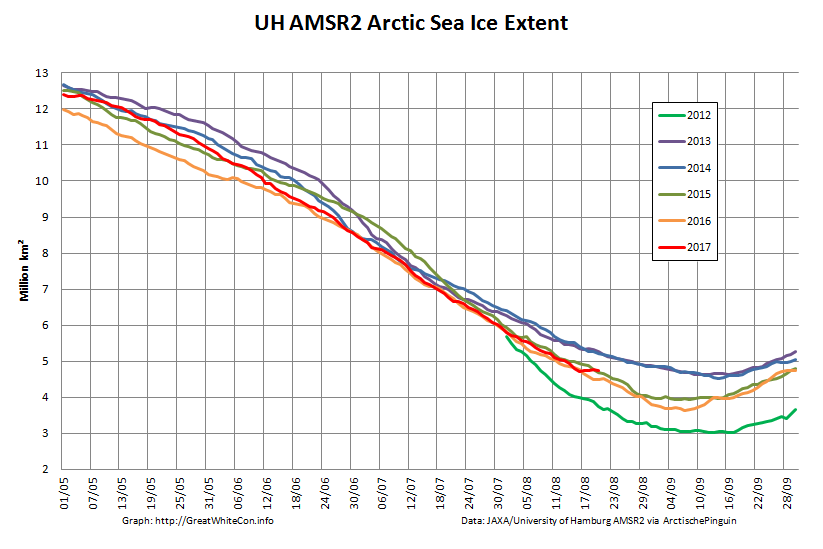
Our favourite high resolution AMSR2 area and extent graphs now also allow comparison with 2012. Here’s how they look at the moment:
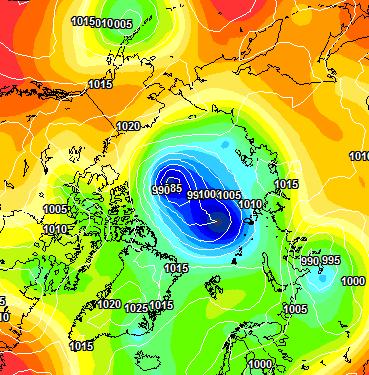
As you can see, round about now is when 2012 Arctic sea ice extent started to noticeably race ahead of the rest of the pack. Will 2017 follow suit? Are there any Arctic cyclones on the horizon for example? Well, the one forecast for August 4th hasn’t materialised. Here’s this morning’s Environment Canada synopsis:
However both ECMWF and GFS agree that a sub 985 hPa storm should have arrived by Sunday morning. Here’s the ECMWF version from MeteoCiel:
There’s stronger storms in the forecast further out, but once again we’ll believe them if and when we see them!
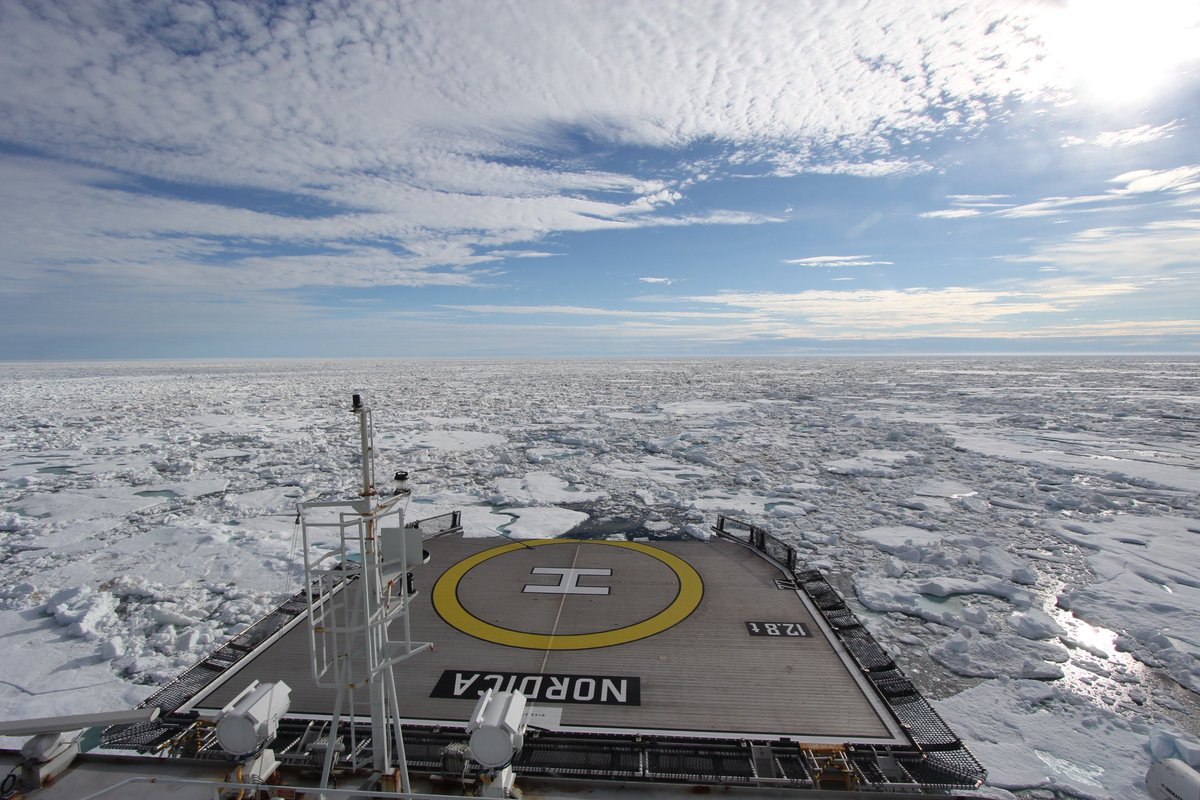
We’re keeping a close eye on the Northwest Passage once again this year. Most of the southern route is open already, but as we predicted the old ice in Larsen Sound has a lot of melting still to do. Here’s how it looked from the icebreaker Nordica a few days ago:
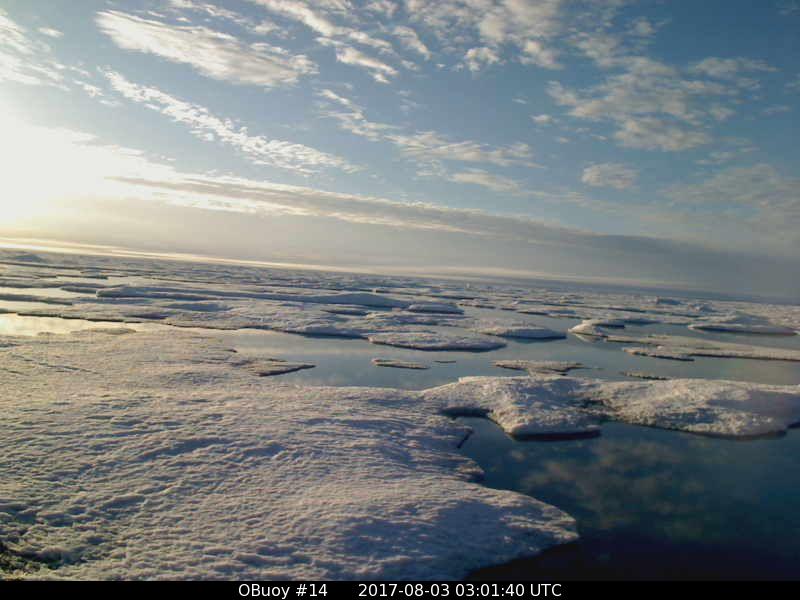
On top of that the old ice around O-Buoy 14 is currently rushing south down the McClintock Channel to replenish it. Here’s how that looks at the moment:
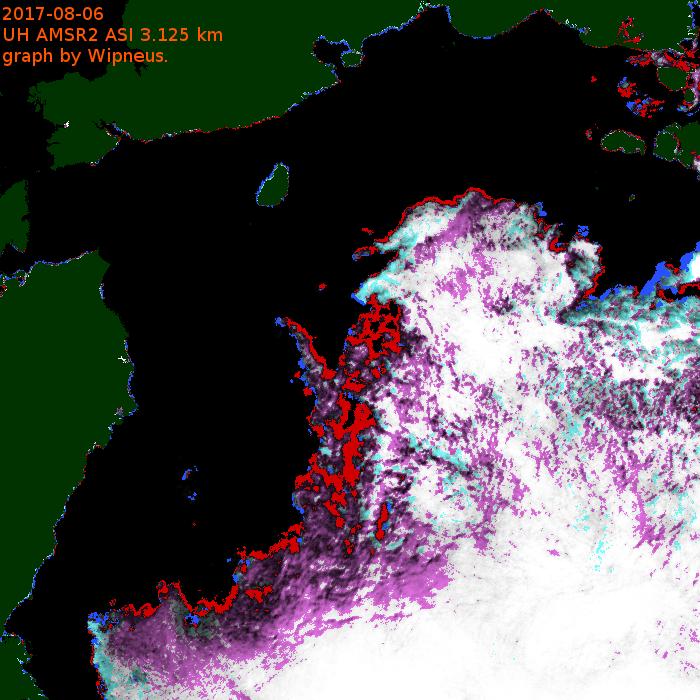
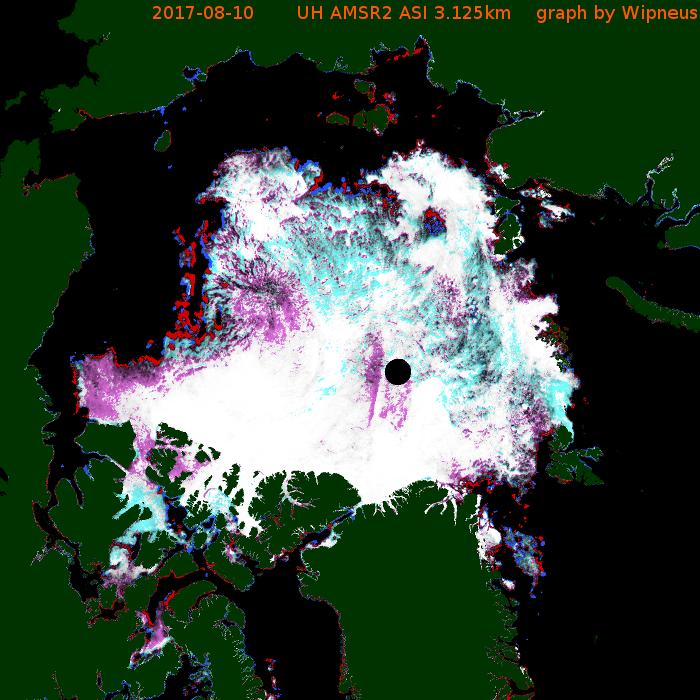
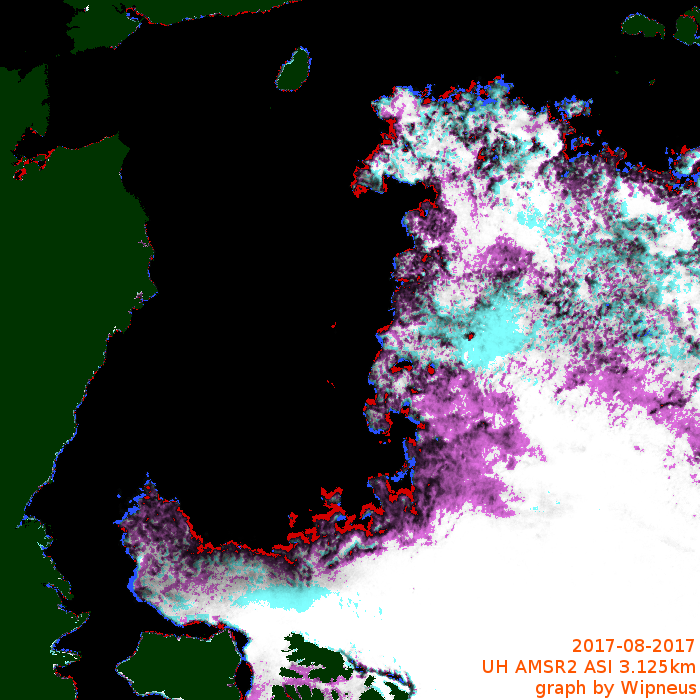
Meanwhile the melt along the Northern Sea Route is well ahead of last year. Here’s the University of Hamburg AMSR2 concentration map of the area:
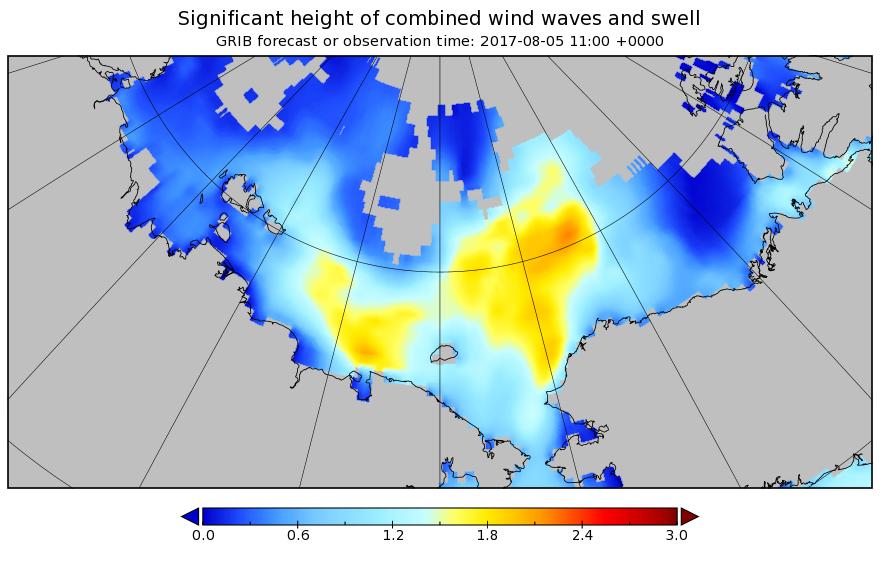
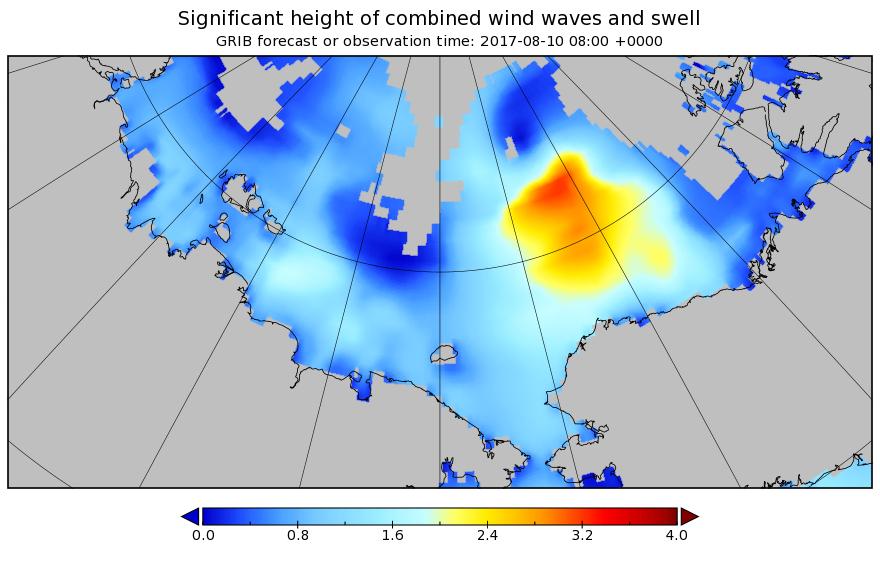
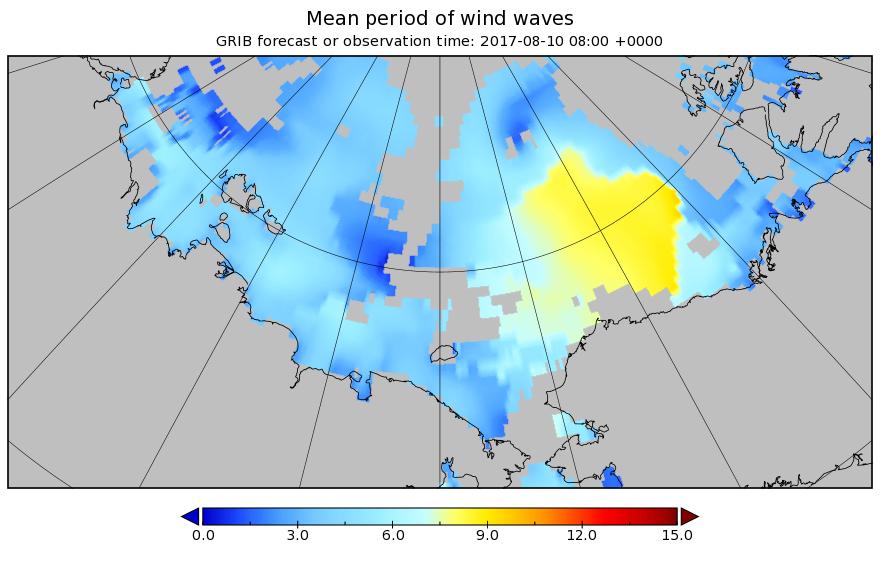
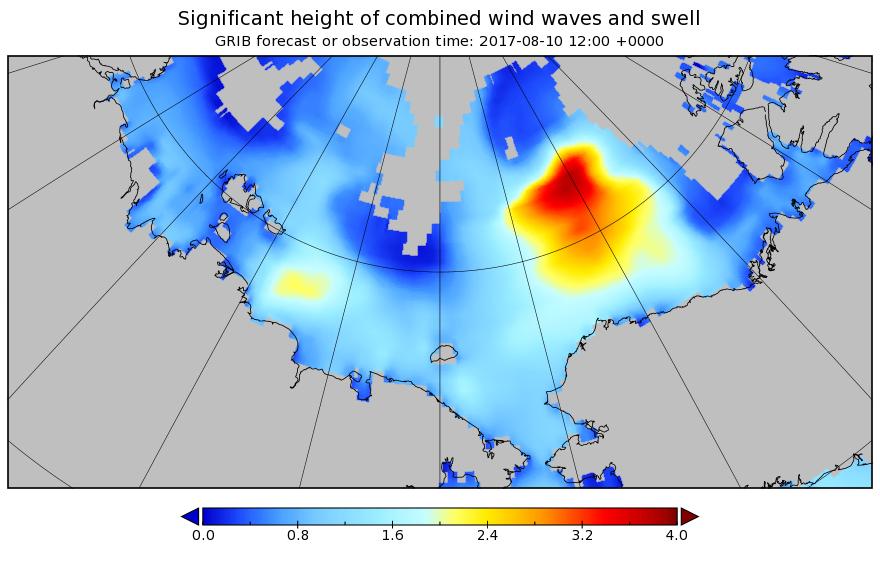
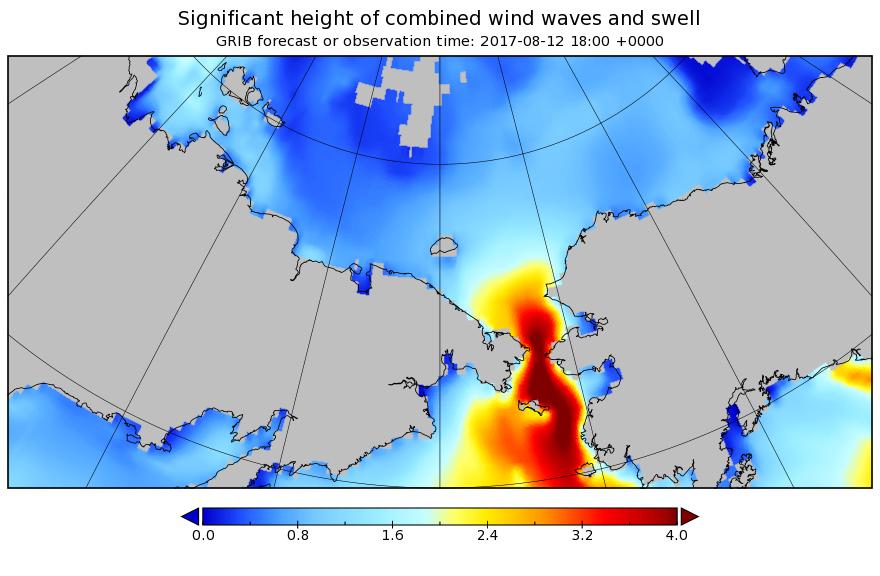
There’s also now a lot of open water on the Pacific side of the Arctic, and Sunday’s cyclone is forecast to create a large area of 2 meter plus waves heading in the direction of the ice edge:
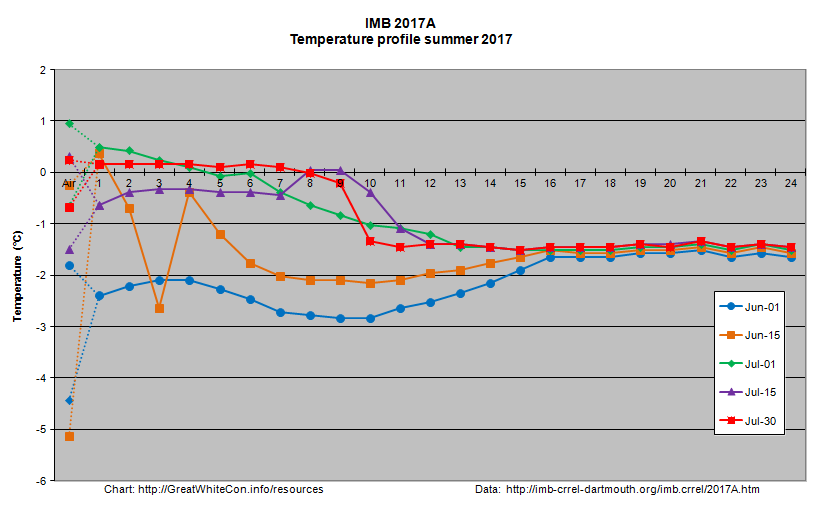
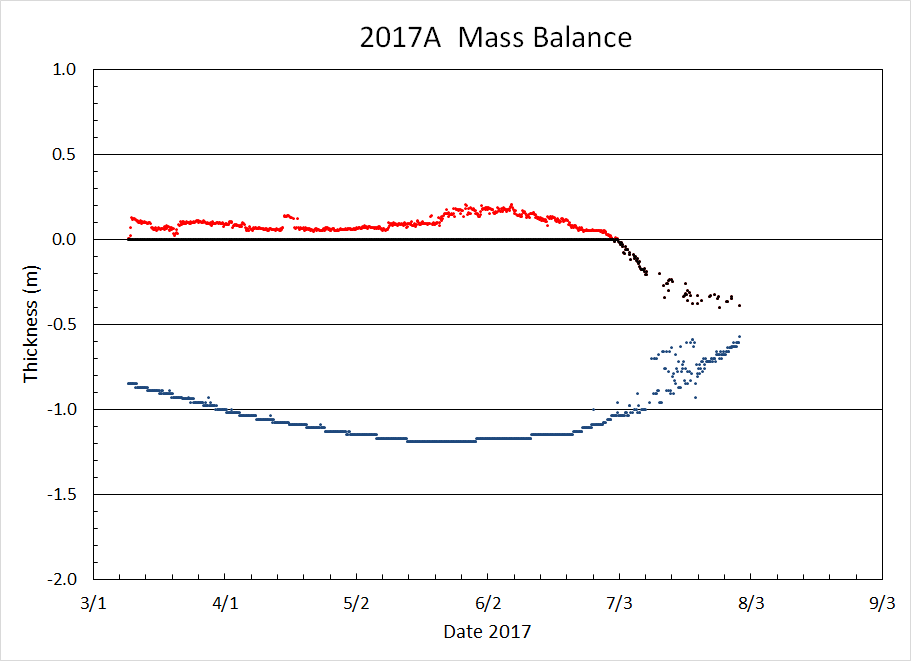
I expect that to have a noticeable effect on the already fragile sea ice by early next week, assuming the storm arrives as forecast! There is an ice mass balance buoy handily placed out on the ice in the path of the storm. Buoy 2017A is currently located near 77 N, 147 W, and its assorted sensors suggest the ice underneath it is now less than 20 cm thick:
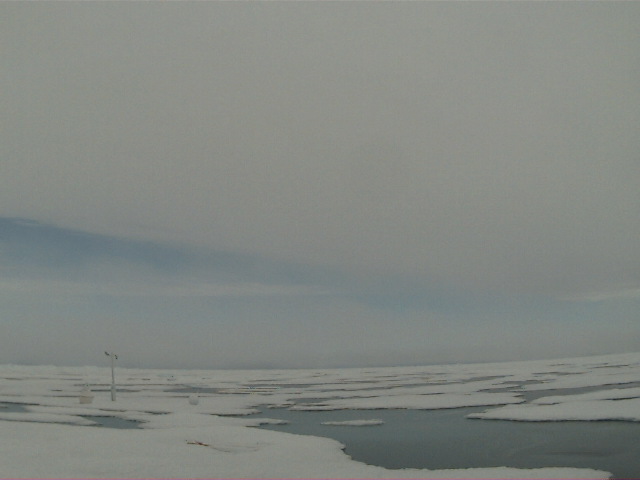
Here’s how the area around the buoy looked a couple of weeks ago:
Image of 2017A from WARM 6 on July 18th 2017. NSF project: NSF OPP #1603548
The $64,000 question now is will the 2017 Arctic sea ice metrics stay in amongst the recent pack, or race after 2012 instead?
[Edit – August 6th]
This morning’s synopsis from Environment Canada suggests the cyclone has bottomed out at a MSLP of 982 hPa:
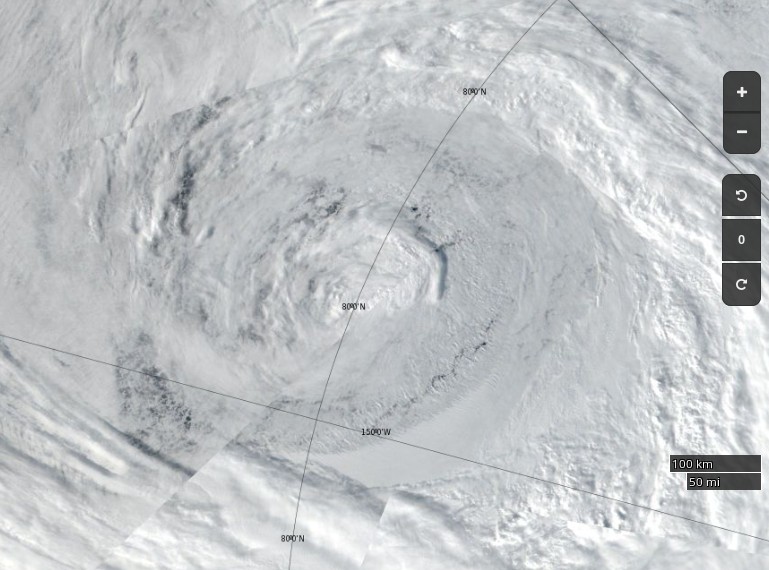
Here’s how the cyclone looked from space yesterday:
NASA Worldview “true-color” image of the sea ice north of the Beaufort Sea on August 5th 2017, derived from the VIIRS sensor on the Suomi satellite
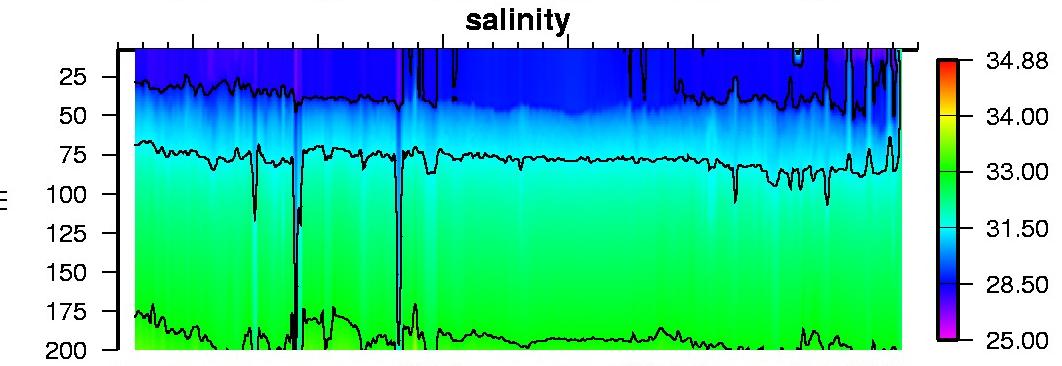
I think that I can convince myself that the salinity profile from ice tethered profiler 97, currently located at 73° N, 134° W, reveals mixing from depth in the wake of the storm:
The synthetic aperture radar on the Sentinel 1B satellite can certainly see through the clouds, and reveals open water in the Central Arctic north of the Beaufort Sea yesterday evening (UTC):
Sentinel 1B image of Arctic sea ice at 79° N, 160° W on August 5th 2017
The effects of this weekend’s storm are readily apparent! Just in case you’re wondering Wipneus reports:
Area: -172.0 (+324k vs 2016, +138k vs 2015, -669k vs 2014, -523k vs 2013, +493k vs 2012)
[Edit – August 8th]
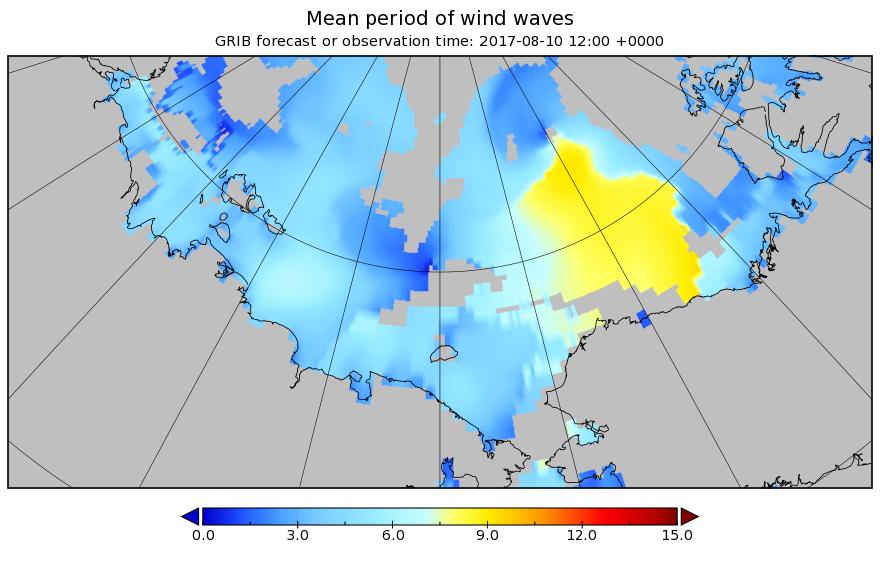
The next pulse of swell is currently forecast to be somewhat higher and longer period than the last one. This one is also taking aim at the Beaufort Sea MIZ:
[Edit – August 9th]
According to Environment Canada the latest cyclone is already down to 980 hPa MSLP:
[Edit – August 9th PM]
The MSLP of the current cyclone is now down to 976 hPA:
The latest WaveWatch III forecast has increased the predicted peak height and period of the resulting waves once again:
[Edit – August 10th]
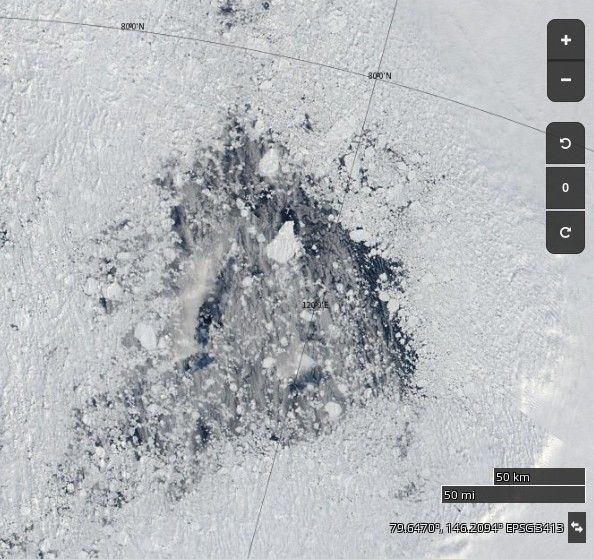
Large holes are appearing in the sea ice on the other side of the Arctic too. Take a look north of the Laptev Sea for example:
NASA Worldview “true-color” image of the “Laptev Bite” polynya on August 10th 2017
Meanwhile the current cyclone on the Pacific side of the North Pole appears to have bottomed out at 974 hPa:
[Edit – August 11th]
Here’s the latest sea ice concentration one day delta map from Wipneus:
Despite the expected divergence caused by a low pressure area crossing the ice, both are and extent of sea ice on the Pacific side of the Arctic are still falling.
[Edit – August 12th]
The waves are considerably smaller in the Beaufort Sea today, but not in the Bering Strait!
Here’s the latest one day delta map:
and here’s video showing the motion of sea ice in the Beaufort & Chukchi Seas so far this summer:
[Edit – August 13th]
Here’s an animation from Wipneus revealing the effect of the two recent cyclones on the Pacific side, plus everything else that’s been going on in the Arctic:
Click the image to see a much larger (3.3 Mb) version.
[Edit – August 16th]
AMSR2 Arctic sea ice extent has taken another tumble, and has dropped below 2016:
Only 2012 left to beat!
[Edit – August 18th]
A PIOMAS mid month update has been released, including gridded thickness data. 2017 modelled volume has failed to follow 2012’s trajectory towards the September minimum, and is now on a par with 2011:
[Edit – August 21st]
After a “brief hiatus” in the wake of the recent cyclones Arctic sea ice area has posted a new low for the year:
Extent has yet to follow suit:
The main loss of area has been in the “Beaufort Bite” once again:
Regular readers will be aware that Snow White and I have long been banished from the hallowed halls of Watts Up With That. What is one to do, then, when Anthony Watts publishes these scurrilous allegations about one’s character by the pseudonymous “Sunsettommy” under an article by David Middleton on a topic under much discussion here?
Your ice obsession is destroying you and Jim Hunt,who was exposed as a dishonest person over his absurd cherry picking of a small area while Tony was covering the ENTIRE Arctic region. Tony just today exposed Hunts dishonesty, by showing that his small Canadian region is actually thicker than last year.
The two of you are gaining a stellar reputation as wild eyed warmist morons,who will lie or distort the topic presented, Tony has effectively destroyed your low Arctic ice baloney, to the point that you now get derision there, since your replies are free of any science information,meaning you have no effective counterpoint to offer,just brainless opinions, nothing more.
With the usual channels of communication solidly blocked our very good friend Alice F. helpfully leapt into the breach:
SST – It seems as though you’ve been unable to confirm Aphan’s conjecture with evidence of an accurate prediction [from Tony Heller]? Meanwhile your aforementioned “Mr. Hunt” posted this “data based presentation” earlier:
“You don’t even need to be familiar with the satellite products to understand that the sea ice edge to the north of the Barents Sea doesn’t currently consist of multi-year ice.”
Any comment?
Much witty banter about Arctic sea ice maps and metrics ensued! Here is one of the more inventive comments, from the pseudonymous “2hotel9”:
Every time leftarded c*nts like you get caught being leftarded c*nts all you do is cry. Wahwahwahwahwahwahwah. Too f*cking funny.
That sort of thing apparently does not violate any of the carefully crafted house rules at WUWT, whereas this comment of Alice’s does:
Unabashed by her love letter being so swiftly trampled underfoot on the WUWT cutting room floor Alice valiantly pursued the matter with Anthony on Twitter, where in his habitual fashion he gleefully unfrocked her in public view of the whole of cyberspace:
Anthony Watts has finally [snip]ped the four letter words uttered by “2hotel9”.
However there’s still no sign of him allowing yours truly a right of reply to SST’s libellous attacks upon my unblemished (outside the cryodenialosphere) character:
Our title for today is borrowed then modified from the title of a Global Warming Policy Foundation report entitled “The State of the Climate in 2016”. The associated GWPF press release assures us that:
A report on the State of the Climate in 2016 which is based exclusively on observations rather than climate models is published today.
Compiled by Dr Ole Humlum, Professor of Physical Geography at the University Centre in Svalbard (Norway), the new climate survey is in sharp contrast to the habitual alarmism of other reports that are mainly based on computer modelling and climate predictions.
Prof Humlum said: “There is little doubt that we are living in a warm period. However, there is also little doubt that current climate change is not abnormal and not outside the range of natural variations that might be expected.
However it seems as though the sharp contrast to other reports is that the GWPF’s effort is evidently hot off their porky pie production line. By way of example, Prof. Humlum’s “white paper” is not “based exclusively on observations rather than climate models” nor is it “The World’s first” such “State of the Climate Survey”. As Dr. Roy Spencer of the University of Alabama in Huntsville pointed out on Watts Up With That of all places:
Ummm… I believe the Bulletin of the AMS (BAMS) annual State of the Climate report is also observation-based…been around many years.
Meanwhile on Twitter Victor Venema of the University of Bonn pointed out that:
Sorry Benny Peiser, if you use satellite temperature estimates, you are using a (radiative transfer) model.
All in all there are several “alternative facts” in just the headline and opening paragraph of the GWPF’s press release, which doesn’t augur well for the contents of the report itself!
Date: Wednesday, March 29, 2017 – 10:00am
Location: 2318 Rayburn House Office Building
Dr. Judith Curry
President, Climate Forecast Applications Network; Professor Emeritus, Georgia Institute of Technology
Dr. John Christy
Professor and Director, Earth System Science Center, NSSTC, University of Alabama at Huntsville; State Climatologist, Alabama
Dr. Michael Mann
Professor, Department of Meteorology and Atmospheric Science, Pennsylvania State University
Dr. Roger Pielke Jr.
Professor, Environmental Studies Department, University of Colorado
John Christy doesn’t seem to have a Twitter account, but the other three “expert witnesses” announced there involvement, as revealed in this slideshow of learned (and not so learned!) comments on Twitter:
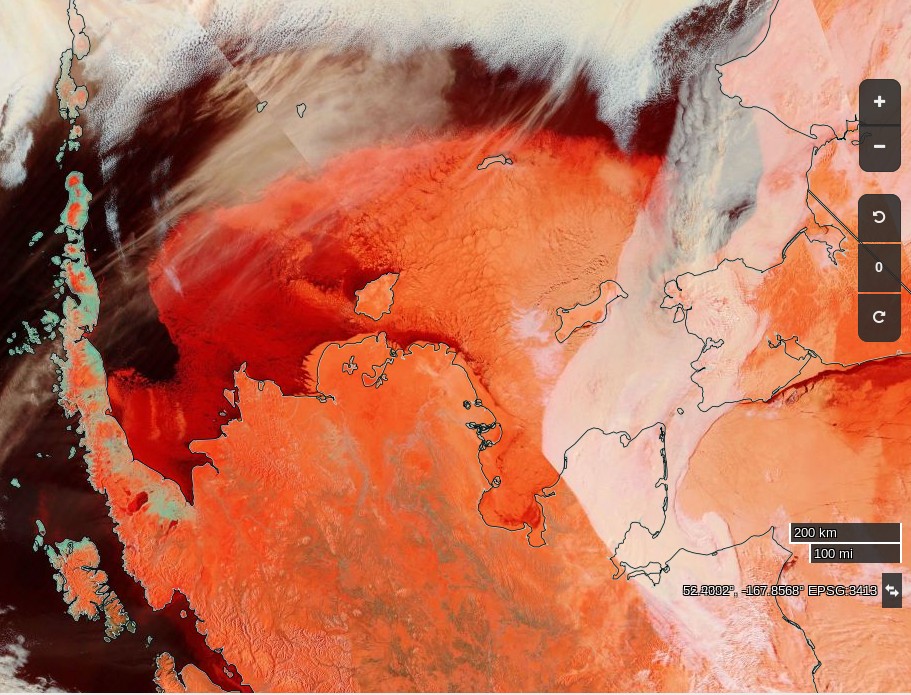
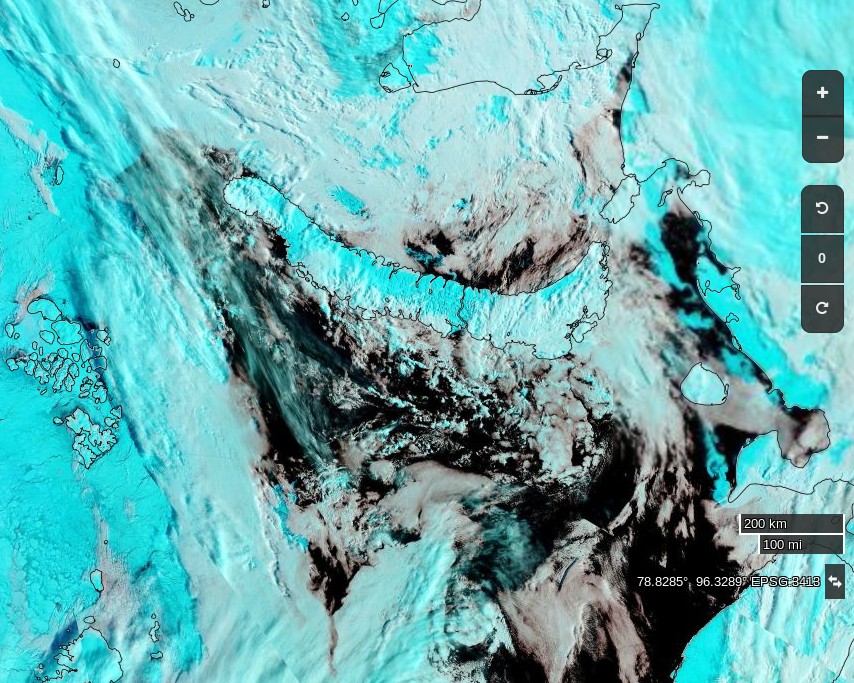
You may have noticed that in response to the GWPF’s propaganda I pointed them at a “State of the Arctic in 2017” report of my own devising which is in actual fact “based exclusively on observations rather than climate models” and looks like this:
NASA Worldview “false-color” image of the Bering Sea on March 22nd 2017, derived from the MODIS sensor on the Terra satelliteNASA Worldview “false-color” image of the Kara Sea on March 22nd 2017, derived from the MODIS sensor on the Terra satelliteSynthetic aperture radar image of the Wandel Sea on March 21st 2017, from the ESA Sentinel 1B satellite
We feel sure that Lamar Smith and the House Committee on Science, Space and Technology won’t comprehend the significance of those observations, but will nonetheless be pleased to see the GWPF’s report become public knowledge shortly before their planned hearing next week.
We also feel sure they were pleased to view the contents of another recent “white paper” published under the GWPF banner. The author was ex Professor Judith Curry, and the title was “Climate Models for the Layman“. Lamar Smith et al. certainly seem to qualify as laymen, and Judith’s conclusion that:
There is growing evidence that climate models are running too hot and that climate sensitivity to carbon dioxide is at the lower end of the range provided by the IPCC.
will no doubt be grist to their climate science bashing mill next Wednesday. Unfortunately that conclusion is yet another “alternative fact” according to the non laymen.
This report, however, does little to help public understanding; well, unless the goal is to confuse public understanding of climate models so as to undermine our ability to make informed decisions. If this is the goal, this report might be quite effective.
That certainly seems to be the goal of the assorted parties involved, and consequently we cannot help but wonder if the David and Judy Show will put on another performance this coming Sunday morning? Paraphrasing William Shakespeare:
Friends, Romans, countrymen, lend me your ears;
Lamar Smith comes to bury Michael Mann, not to praise him
Our old friend Tony Heller has been publishing a glorious Gish gallop of articles showing OSI-SAF Arctic sea ice type maps and claiming amongst other things:
A decade after declaring the end of Arctic multi-year sea ice, it has increased 116% and now covers nearly half of the Arctic.
That is of course not true. In actual fact it’s an “alternative fact” par excellence!
I have been endeavouring to point out to Tony the error of his ways for weeks now, but my words have wisdom have fallen on deaf ears. My graphic graphics have been viewed only by “snow blind” eyes. My incontrovertible arguments have been misapprehended by purpose built dumb and dumberer wetware illogic. By way of example, here’s a refreshingly ad hom free riposte from a typical commenter:
Jimmy Boy actually thinks his honesty and integrity are equally to that of Anthony Watts???
No doubt we’ll get around to discussing Anthony Watts “honesty and integrity” again soon, but for now let’s see if we can finally set this particular badly warped record straight shall we?
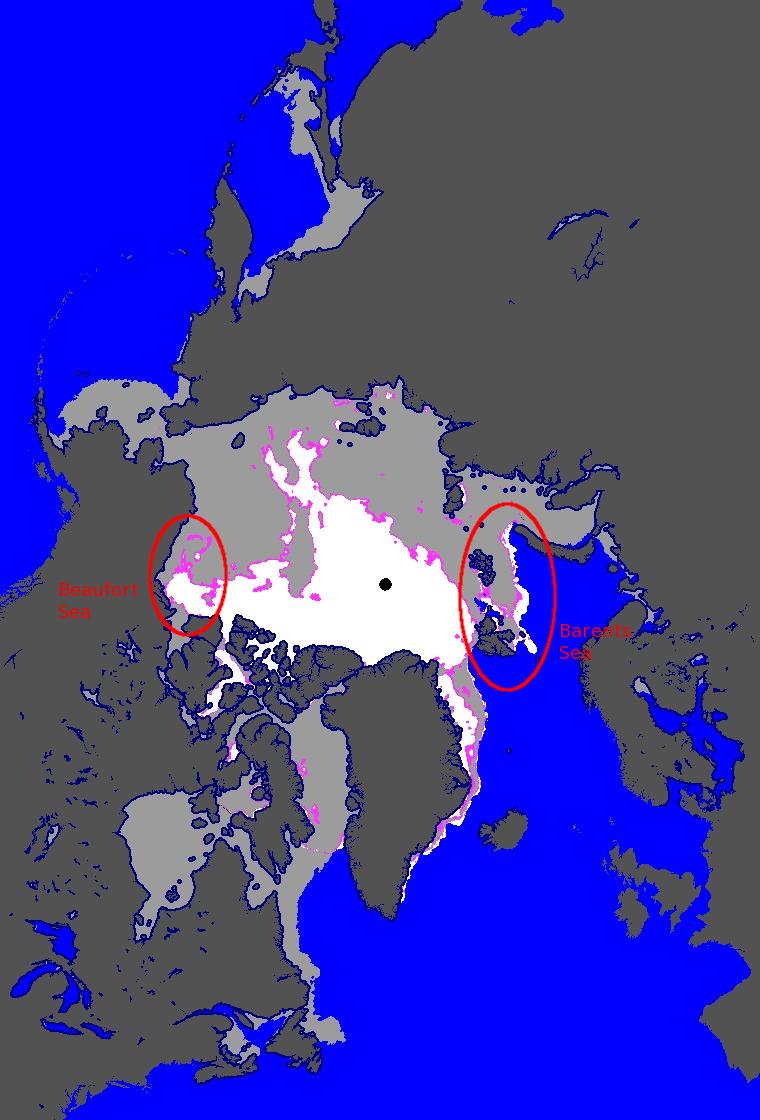
Here is the latest OSI-SAF ice type map, for March 16th 2017:
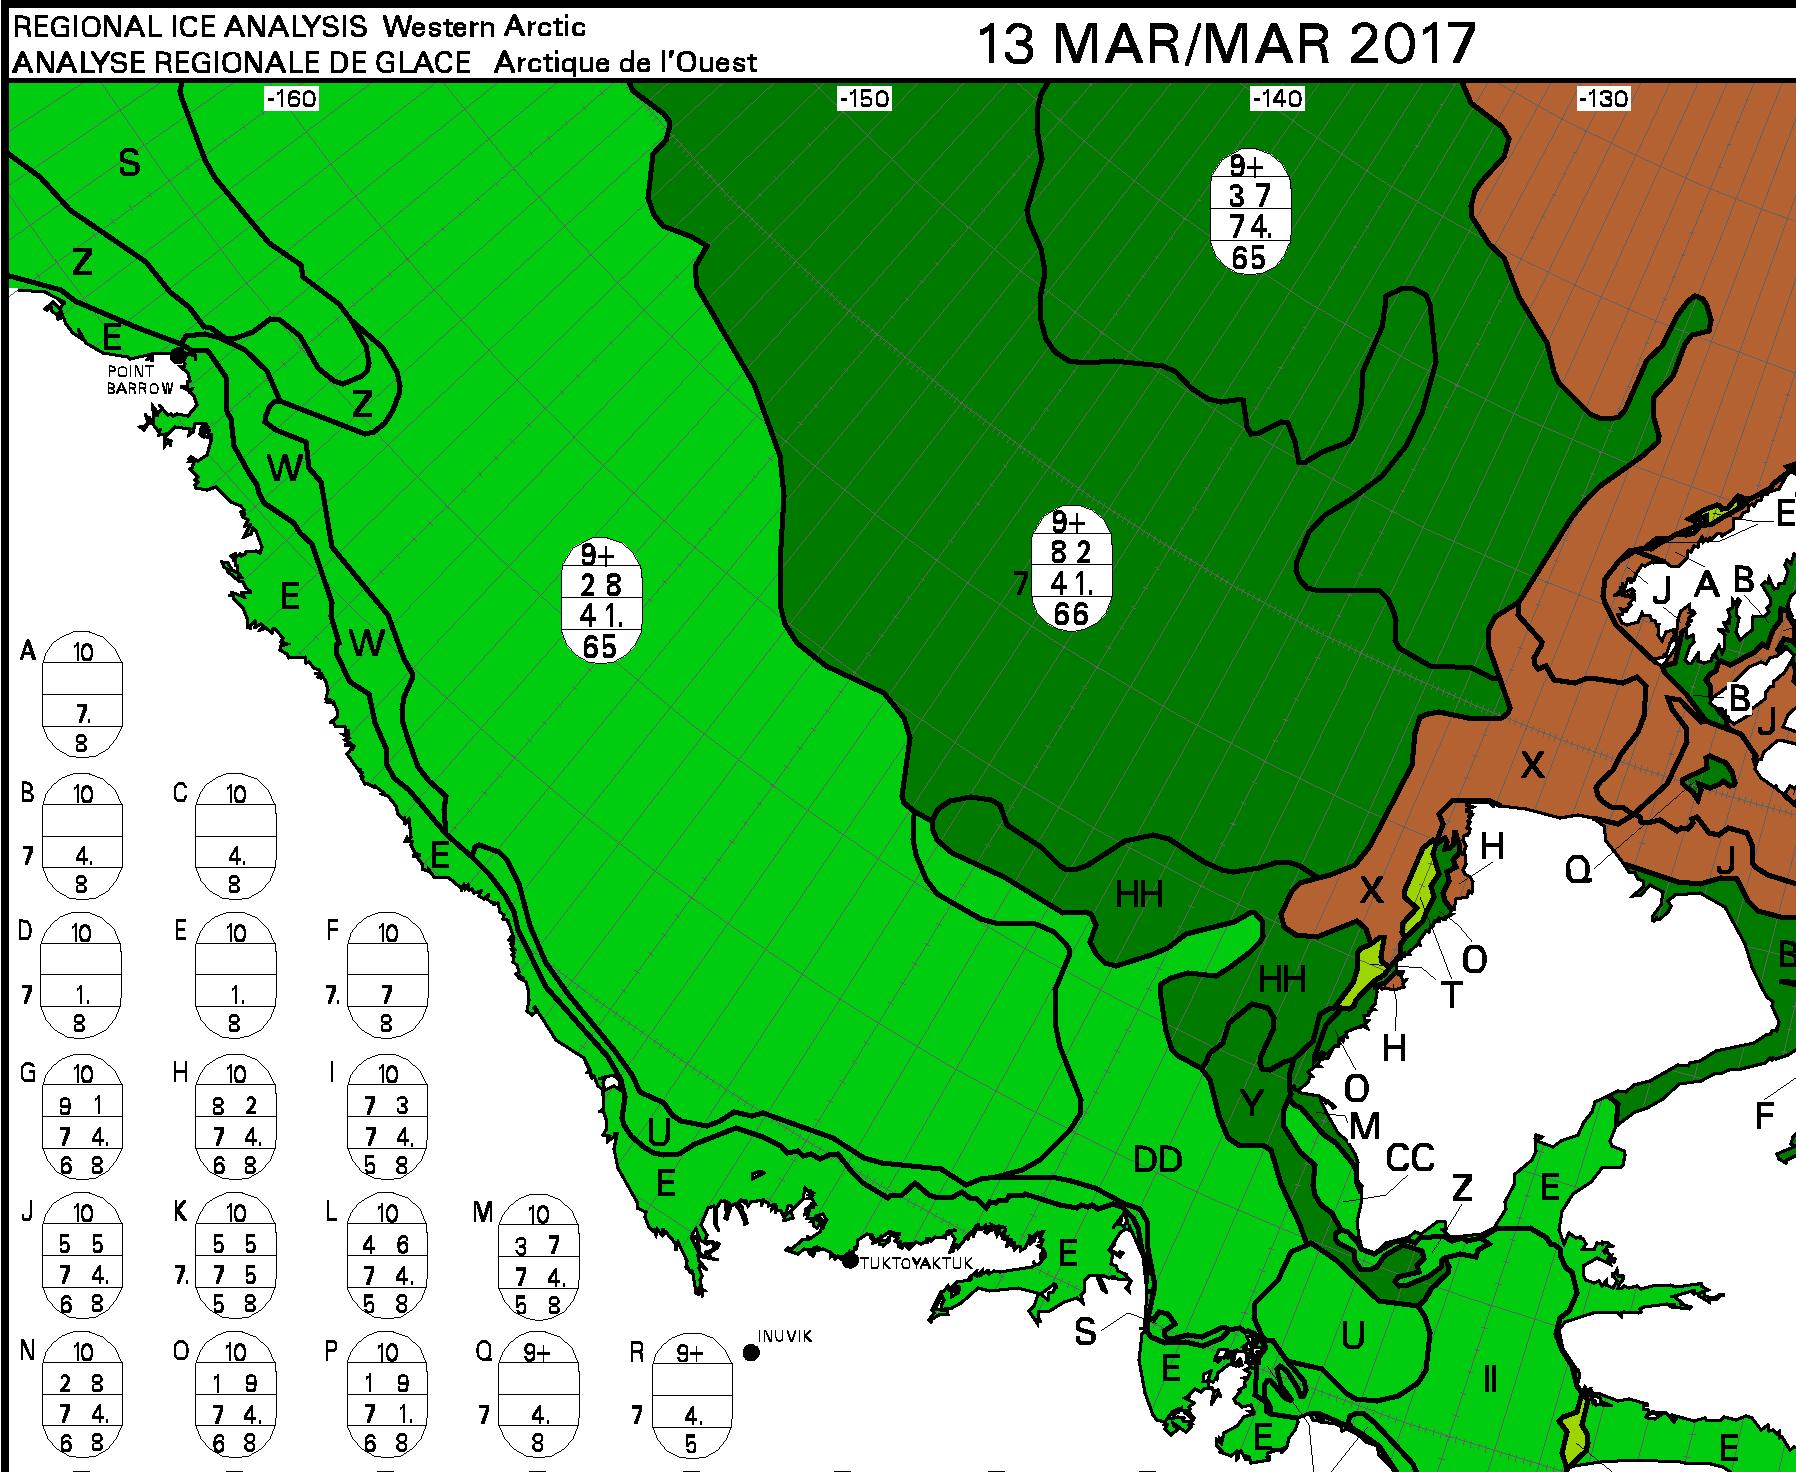
The highlighted area on the left is the Beaufort Sea to the north of Canada. If you’re not “snow blind” you can no doubt readily perceive a large area of allegedly “multi-year sea ice” coloured white. Let’s now take a look at the most recent Canadian Ice Service map of the same area, for March 13th 2017:
Canadian Ice Service sea ice stage of development on March 13th 2017
Can you see a large area of brown “old ice” covering most of the surface of the Beaufort Sea?
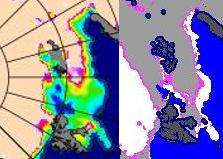
Now let’s take a look on the other side of the Arctic at the area north of the Barents Sea. Can you see a large area of allegedly “multi-year sea ice” coloured white inside the red ellipse on the OSI-SAF map? Next let’s take a look at the most recent University of Bremen SMOS map of the Arctic, for March 15th 2017:
On this map the brightly coloured areas show sea ice that’s less than 50 cm thick. Even when two people explain this point slowly to them the “deplorable denizens” at Mr. Heller’s blog do not manage to get the message! So now let’s look at a closeup comparison between the OSI-SAF ice type map and the University of Bremen SMOS sea ice thickness map:
As I popped the question to the deplorable denizens over on Tony Heller’s Deplorable Climate Science blog:
For anybody else here who isn’t deaf, dumb and blind, please note all the young, thin sea ice around Svalbard identified by SMOS that OSI-SAF currently classifies as “multi-year” ice.
At the risk of (repeating myself)^n, n → ∞:
Why do Tony, Tommy and Andy persist with this nonsense?
Although positive feedbacks between sea ice and the Arctic circulation exist, we find that these are small during summer. Instead, circulation variations over the Arctic have been a significant factor in driving sea-ice variability since 1979, and have had a non-trivial contribution to the total surface temperature trend over Greenland and northeastern Canada39 . The potentially large contribution of internal variability to sea-ice loss over the next 40 years reinforces the importance of natural contributions to sea-ice trends over the past several decades. The similarity of high-latitude circulation variability associated with sea-ice loss to the teleconnections with the tropical Pacific suggests a contribution of sea-ice losses from SST trends across the tropical Pacific Ocean. Decadal trends in the hemispheric circulation are an important driver of Arctic climate change, and therefore a significant source of uncertainty in projections of sea ice. Better understanding of these teleconnections and their representation in global models under increasing greenhouse gases may help increase predictability on seasonal to decadal timescales.
As you may already be able to imagine, this paper (PDF as submitted) is already the source of considerable controversy! Firstly let’s take a look at an overview of the paper from the University of Washington, entitled “Rapid decline of Arctic sea ice a combination of climate change and natural variability”:
“The idea that natural or internal variability has contributed substantially to the Arctic sea ice loss is not entirely new,” said second author Axel Schweiger, a University of Washington polar scientist who tracks Arctic sea ice. “This study provides the mechanism, and uses a new approach to illuminate the processes that are responsible for these changes.”
[First author Qinghua] Ding designed a new sea ice model experiment that combines forcing due to climate change with observed weather in recent decades. The model shows that a shift in wind patterns is responsible for about 60 percent of sea ice loss in the Arctic Ocean since 1979. Some of this shift is related to climate change, but the study finds that 30-50 percent of the observed sea ice loss since 1979 is due to natural variations in this large-scale atmospheric pattern.
Now let’s take a look at another overview of the paper, this time from Roz Pidcock at Carbon Brief and entitled “Humans causing up to two-thirds of Arctic summer sea ice loss, study confirms”:
Rising greenhouse gas emissions are responsible for at least half, possibly up to two-thirds, of the drop in summer sea ice in the Arctic since the late 1970s, according to new research. The remaining contribution is the result of natural fluctuations, say the authors.
The paper, published today in Nature Climate Change, confirms previous studies which show how random variations in the climate have acted to enhance ice loss caused by rising CO2.
Importantly, the authors state clearly in the paper that their work does not absolve human activity as a driver of Arctic sea ice loss. A News and Views article that accompanies the paper, by Dr Neil Swart from Environment and Climate Change Canada, adds:
“The results of Ding et al. do not call into question whether human-induced warming has led to Arctic sea-ice decline — a wide range of evidence shows that it has.”
There has already been much debate about the paper on Twitter! Here’s the “scientific” edition:
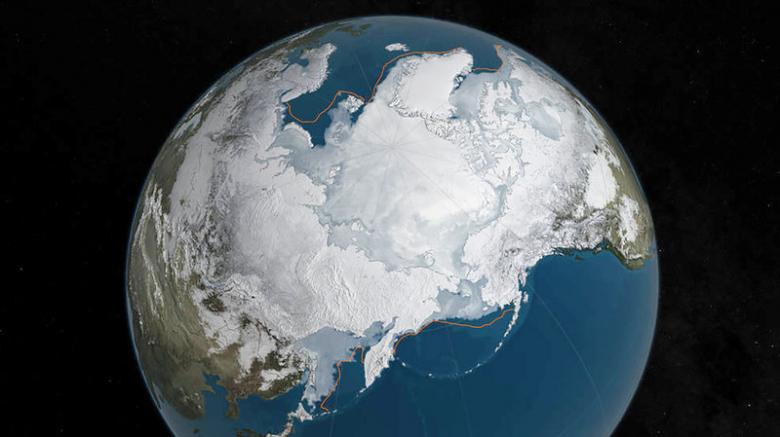
FILE PHOTO: An undated NASA illustration shows Arctic sea ice at a record low wintertime maximum extent for the second straight year, according to scientists at the NASA-supported National Snow and Ice Data Center (NSIDC) and NASA. NASA/Goddard’s Scientific Visualization Studio/C. Starr/Handout via Reuters/File Photo
Natural swings in the Arctic climate have caused up to half the precipitous losses of sea ice around the North Pole in recent decades, with the rest driven by man-made global warming, scientists said on Monday.
The study indicates that an ice-free Arctic Ocean, often feared to be just years away, in one of the starkest signs of man-made global warming, could be delayed if nature swings back to a cooler mode.
Natural variations in the Arctic climate “may be responsible for about 30–50 percent of the overall decline in September sea ice since 1979,” the U.S.-based team of scientists wrote in the journal Nature Climate Change.
David embellished his article with some “humorous” asides such as:
“This is the worst of the worst catastrophes in the world! Oh, it’s crashing … Oh, the humanity! Honest, I can hardly breathe. I’m going to step inside where I cannot see it.”
Please say it ain’t so!!!
“The melt of the Arctic is disrupting the livelihoods of indigenous peoples and damaging wildlife such as polar bears and seals while opening the region to more oil and gas and shipping.”
Eskimos, seals and polar bears!!! Oh My!!! And more oil and gas shipping!!! Aiiieeee!!!!
which some of us took exception to:
David – An Arctic indigenous person of my acquaintance asks me to tell you to “go f(r)@ck yourself”!
What should I reply on your behalf?
No answer has yet been received to that (im)pertinent question!
All this excitement in the Twittosphere and elsewhere leads one to wonder whether Ding, Schweiger et al. saw (or should have seen?) all this coming, and if so what might have been done differently? In any event this story is set to run and run and run and……
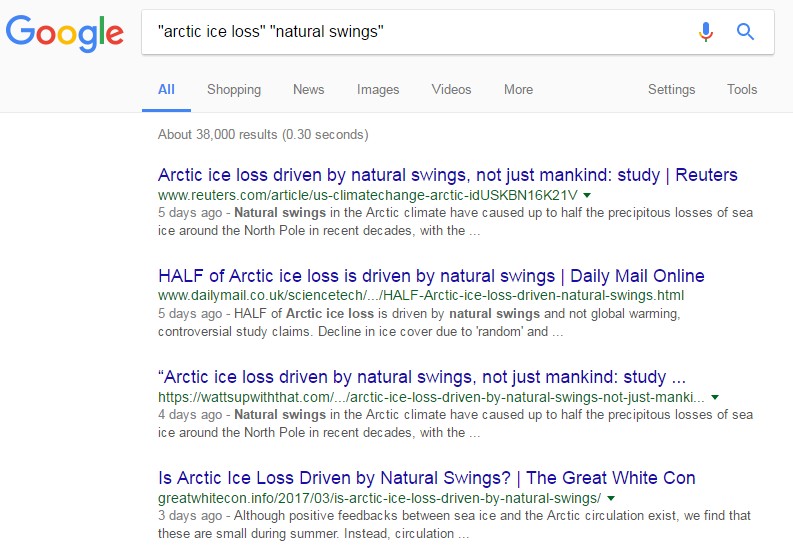
38,000 results. We’re number 4. If you repeat the exercise please feel free to experiment with the search phrase(s) you employ. Make sure to only click on the link that leads you back here!
Without being able to pick any obvious holes I feel somewhat uncomfortable with that; the idea that September ice depends just on JJA circulation doesn’t feel at all right. Having decided that, though, they then run a variety of model experiments, for example “nudging” the circulation back to re-analysis, with and without an ocean-ice model underneath. And the result seems to be that it is mostly the circulation forcing the sea ice, rather than the sea ice changes forcing the atmosphere. This kinda-fits the “information flow” meme from way back so I should be prepared to accept that mostly. Having done that they then convince themselves that most of the circulation changes that matter to the ice are not GW forced, and so must be natural variability; and hence the conclusion. If you took all of this at face value then they’d have solved one of the puzzles, that on the whole models show much less ice decline that reality. But of course if the decline is substantially a freak of variation, not forced, that would fit.
The flaw in this overall, without looking at the details, is that it’s hard to see a near-40-year trend and being so much natural variability. That seems to be asking for an awful lot of one-way variation.
Prof. Andrew Shepherd, Director of the Centre for Polar Observation and Modelling at the University of Leeds, said:
“According to this new research, the dramatic decline in Arctic sea ice that we have witnessed over recent decades is primarily due to anthropogenic (man-made) climate warming.
“Although this finding may not come as a surprise, being able to separate this from the effects of natural climate variability is an important step forwards, and paves the way for an improved understanding of what we should expect in future decades.”
Dr Ed Hawkins, Climate research scientist at the University of Reading, said:
“Recent summer Arctic sea ice extents have all been amongst the lowest on record but this is not necessarily all due to warming global temperatures – part of the sea ice decline is also because of changes in the atmospheric circulation.
“It is challenging to determine how much of the change in the circulation is itself due to warming temperatures, but this study suggests that a substantial fraction is due to natural fluctuations.
“Looking ahead, it is still a matter of when, rather than if, the Arctic will become ice-free in summer, but we expect to see periods where the ice melts rapidly and other times where it retreats less fast.”
The Arctic icecap is shrinking – but it’s not all our fault, a major study of the polar region has found. At least half of the disappearance is down to natural processes, and not the fault of man made warming.
Part of the decline in ice cover is due to ‘random’ and ‘chaotic’ natural changes in air currents, researchers said.
The rest has been driven by man-made global warming, scientists said.
The research means that although it is widely feared that the Arctic could soon be free of ice, this could be delayed if nature swings back to a cooler cycle.
Colin Fernandez’ Daily Mail article reproduced at Mark Morano’s “Climate Depot”
Study in journal Nature: HALF of Arctic ice loss driven by natural swings — not ‘global warming’
The five earliest years of data plot near +2 standard deviations. The five most recent full years of data plot near or just outside of -2 standard deviations. Ding et al., 2017 conclude that up to half of the difference is due to the NAO and other natural climate fluctuations.
Astonishingly though, the study makes no mention of the Atlantic Multidecadal Oscillation, which also has a significant effect on Arctic sea ice extent.
Since the late 1970s, the AMO has moved from the coldest point of its cycle to its highest, coinciding with a decline in Arctic sea ice coverage.
Considering that the climate models are already performing poorly as it is, the new finding means that they are actually faring even worse than has been generally realized. And accounting for this strengthens the case for a lukewarming future from greenhouse gas emissions.
Ring up another strike against the climate models, and another reason why basing government policy on their output is a bad idea.
Shock News! The David and Judy Show took to the road once again last night, aided and abetted by all the usual suspects. We’ll skip the Breitbarts, Hellers and Watts of this world and head straight for the now ex Prof. Judith Curry‘s “Climate Etc.” blog. There we will discover “Climate scientists versus climate data“, a guest post by ex NOAA scientist John Bates. According to John:
The most serious example of a climate scientist not archiving or documenting a critical climate dataset was the study of Tom Karl et al. 2015 (hereafter referred to as the Karl study or K15), purporting to show no ‘hiatus’ in global warming in the 2000s (Federal scientists say there never was any global warming “pause”). The study drew criticism from other climate scientists, who disagreed with K15’s conclusion about the ‘hiatus.’ (Making sense of the early-2000s warming slowdown). The paper also drew the attention of the Chairman of the House Science Committee, Representative Lamar Smith, who questioned the timing of the report, which was issued just prior to the Obama Administration’s Clean Power Plan submission to the Paris Climate Conference in 2015.
Regular readers of our humble scribblings will be well aware that here in Great White Con Ivory Towers we are firmly of the opinion that there never was a ‘hiatus’. Exhibit 1:
Animation by izen
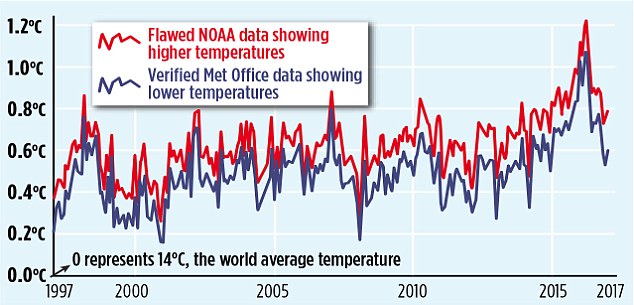
What’s all the fuss about then? Perhaps our old friend David Rose can explain in layperson’s terms? In his latest article for the Mail on Sunday, catchily entitled “Exposed: How world leaders were duped into investing billions over manipulated global warming data”, he assures us that amongst many other things:
The [K15] report claimed that the ‘pause’ or ‘slowdown’ in global warming in the period since 1998 – revealed by UN scientists in 2013 – never existed, and that world temperatures had been rising faster than scientists expected. Launched by NOAA with a public relations fanfare, it was splashed across the world’s media, and cited repeatedly by politicians and policy makers.
But the whistleblower, Dr John Bates, a top NOAA scientist with an impeccable reputation, has shown The Mail on Sunday irrefutable evidence that the paper was based on misleading, ‘unverified’ data.
It was never subjected to NOAA’s rigorous internal evaluation process – which Dr Bates devised.
Now “never subjected to NOAA’s rigorous internal evaluation process” isn’t quite the same thing as “manipulated global warming data”, but Mr. Rose has more!
The misleading ‘pausebuster chart’: The red line shows the current NOAA world temperature graph – which relies on the ‘adjusted’ and unreliable sea data cited in the flawed ‘Pausebuster’ paper. The blue line is the UK Met Office’s independently tested and verified ‘HadCRUT4’ record – showing lower monthly readings and a shallower recent warming trend
That graph looks convincing enough, doesn’t it? However there is a teensy weensy little upward adjustment in there that Mr. Rose is apparently unaware of, as NASA’s Gavin Schmidt pointed out late last night:
This morning Carbon Brief has published a much longer takedown of the aforementioned purple prose by Zeke Hausfather, who points out amongst other things that:
What [David Rose] fails to mention is that the new NOAA results have been validated by independent data from satellites, buoys and Argo floats and that many other independent groups, including Berkeley Earth and the UK’s Met Office Hadley Centre, get effectively the same results.
As per usual Mr. Rose doesn’t stick to science, however dubious. He also dabbles in politics. On that front we are assured:
Karl’s ‘Pausebuster’ paper was hugely influential in dictating the world agreement in Paris and sweeping US emissions cuts. President Trump, above right, has pledged to scrap both policies – triggering furious claims by Democrats he is a climate ‘denier’ and ‘anti-science’.
Thanks to today’s MoS story, NOAA is set to face an inquiry by the Republican-led House science committee.
We’ll have much more to say on this controversy in the context of our “Alternative Facts” investigation in due course, but for the moment at least it looks to us as though the nth iteration of “Climategate 2” barely made it out of the starting gate. However Mr. Rose’s loyal army of “rebloggers, retweeters, plagiarisers and other assorted acolytes” and that “Republican-led House science committee” may of course have other ideas?
[Edit – February 5th PM]
Commentary on Judith Curry’s blog brought to light an article by Peter Thorne. He says, amongst many other things:
I worked for three and a bit years in the NOAA group responsible in the build-up to the Karl et al. paper (although I had left prior to that paper’s preparation and publication). I have been involved in and am a co-author upon all relevant underlying papers to Karl et al., 2015.
The ‘whistle blower’ is John Bates who was not involved in any aspect of the work. NOAA’s process is very stove-piped such that beyond seminars there is little dissemination of information across groups. John Bates never participated in any of the numerous technical meetings on the land or marine data I have participated in at NOAA NCEI either in person or remotely. This shows in his reputed (I am taking the journalist at their word that these are directly attributable quotes) mis-representation of the processes that actually occured. In some cases these mis-representations are publically verifiable.
See if you can spot where Dan & Dan mention the term #Climategate.
[Edit – February 6th]
It’s been a busy day! Several of my carefully crafted comments have ended up on Judy’s cutting room floor, but this one has eluded the red pencil thus far. I bring you this warming and educational nightcap created by an ad hoc team of celebrity international chefs for “warmists” around the planet:
You have to keep clicking through to the very bottom of the virtual mug in order to experience the full benefit of the beverage.
Thank you and good night from May or May Not Land. I’ll see you all in the morning (UTC).
[Edit – February 7th]
Lot’s of pertinent papers just in from Great White Con guest author Kevin Cowtan of York University. Kevin is part of the by now world famous team of Cowtan & Way, who have long championed the cause of accurate Arctic temperature measurements. Kevin tells us:
The paper by Karl and colleagues corrected two known problems with the temperature observations: poor coverage of the Arctic, and a change from ships to buoys. Both had been known about since 2008:
It took NOAA seven years to produce a paper correcting their temperature data, and even now their monthly updates still omit much of the Arctic. The UKMO temperature record is also missing much of the Arctic and only partially corrects the ship problem. Both lead to an underestimation of recent warming.
The agencies face an impossible dilemma – on one hand they have to slowly and carefully evaluate new results, and on the other they have to provide an up-to-date temperature record. Rather than rushing out corrections, they appear to have been extremely conservative.
So there you have it. For more accurate Arctic temperature metrics turn to Cowtan & Way and/or the Berkeley Earth Surface Temperature study! The long delay in improving the quality of the data published by NOAA and the UK Met Office has led to confusion amongst the public, politicans, and even other scientists. All three groups have been trying to understand a supposed “pause” in warming, which in our (humble?) opinion never actually happened. If you disagree with that assessment please feel free to take a good long look at izen’s animation at the top and then explain to us very slowly where you see a “hiatus”.
You may also wish to take a good long look at another guest post on the topic of “the pause”, this time authored by our very good friend Bill the Frog.
[Edit – February 8th]
Watch this video to discover how “The Land of the Free” has morphed into “TrumpLand” in a matter of weeks. The “interrogation” of Rush Holt of the AAAS:
A show trial of the American Association for the Advancement of Science? Congressman Lamar Smith presiding!
[Edit – February 9th]
We like the UK Met Office’s new style. They have taken off the kid gloves, rolled up their sleeves, and they’re extracting the Michael from David Rose on Twitter with great glee:
It looks like we’ve now got a serious contender for our surrealist crown. We’ll have to try and up our game!
[Edit – February 10th]
I was beginning to think he’d retired, but no such luck for David Rose! Peter Hadfield (AKA Potholer54) is back with avengeance. Essential viewing:
If you have the time take a good long look at Peter’s takedowns of the Good “Lord” Christopher Monckton.
This website uses cookies to improve your experience. We'll assume you're ok with this, but you can opt-out if you wish. Cookie settingsACCEPT
Privacy & Cookies Policy
Privacy Overview
This website uses cookies to improve your experience while you navigate through the website. Out of these, the cookies that are categorized as necessary are stored on your browser as they are essential for the working of basic functionalities of the website. We also use third-party cookies that help us analyze and understand how you use this website. These cookies will be stored in your browser only with your consent. You also have the option to opt-out of these cookies. But opting out of some of these cookies may affect your browsing experience.
Necessary cookies are absolutely essential for the website to function properly. This category only includes cookies that ensures basic functionalities and security features of the website. These cookies do not store any personal information.
Any cookies that may not be particularly necessary for the website to function and is used specifically to collect user personal data via analytics, ads, other embedded contents are termed as non-necessary cookies. It is mandatory to procure user consent prior to running these cookies on your website.