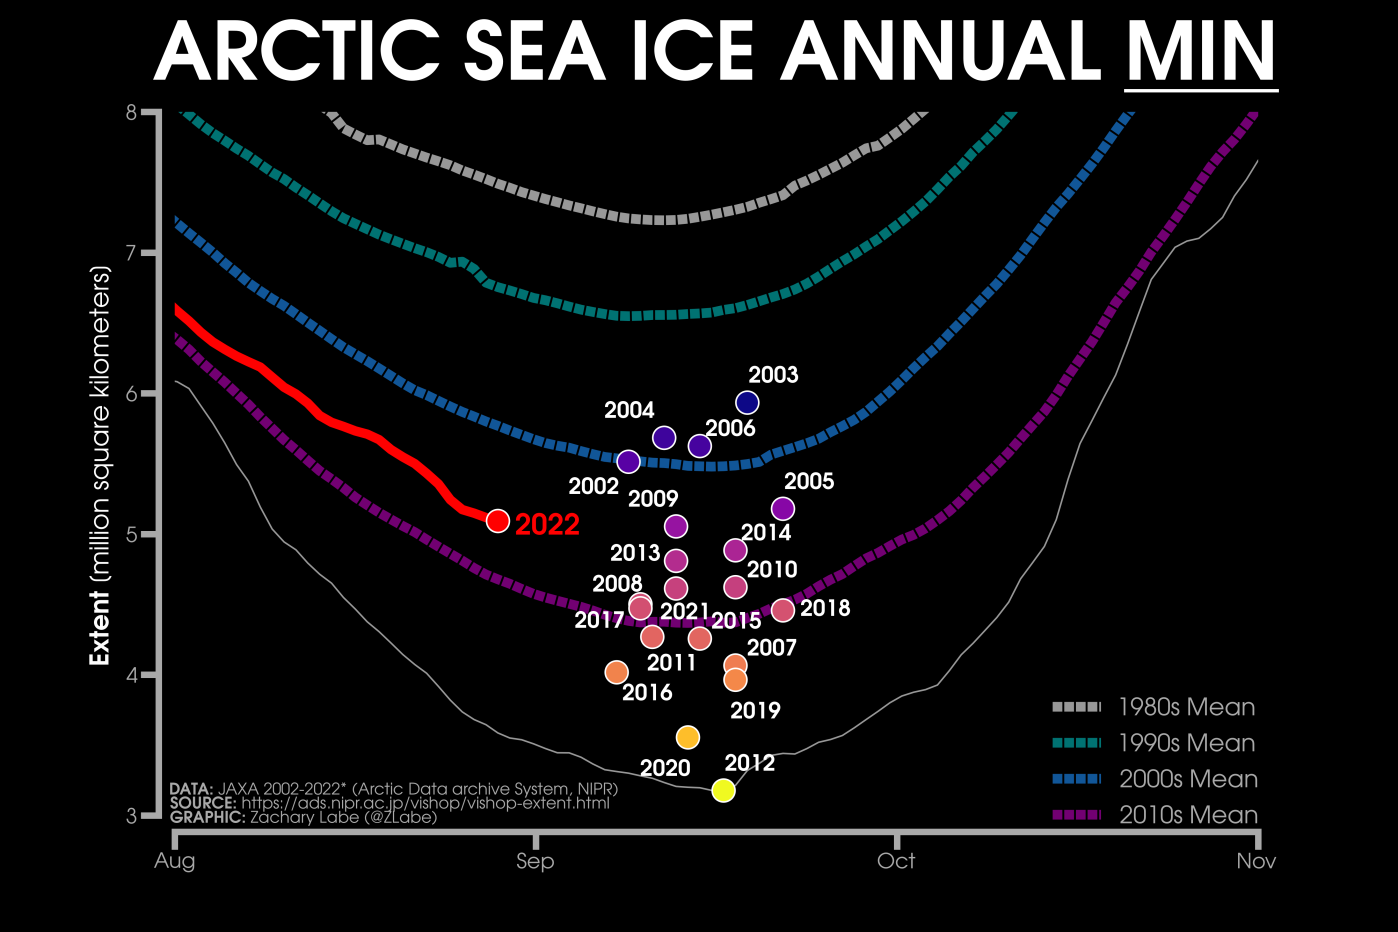
September has arrived and it’s time to start speculating about when and at what level this summer’s minimum Arctic sea ice extent will occur. Here’s a helpful summary of previous years’ JAXA AMSR2/AMSR-E extent minima courtesy of Zack Labe:
Here too is JAXA’s current graph of extent, including a selection of previous years:
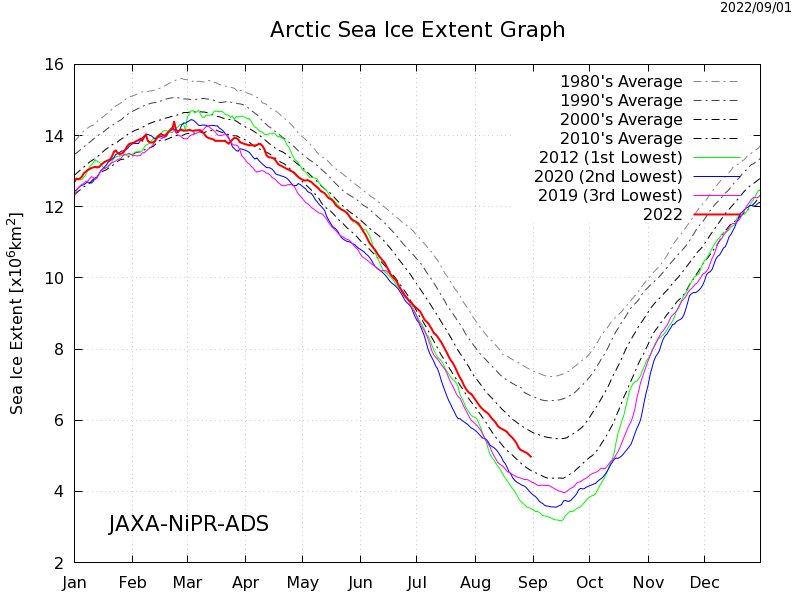
JAXA extent on August 31st was 4.96 million km2, marginally below last year’s value of 4.99 million km2 on the same date.
Of course JAXA isn’t the only organisation that produces graphs of Arctic sea ice extent! Here too is the NSIDC’s 5 day average extent:
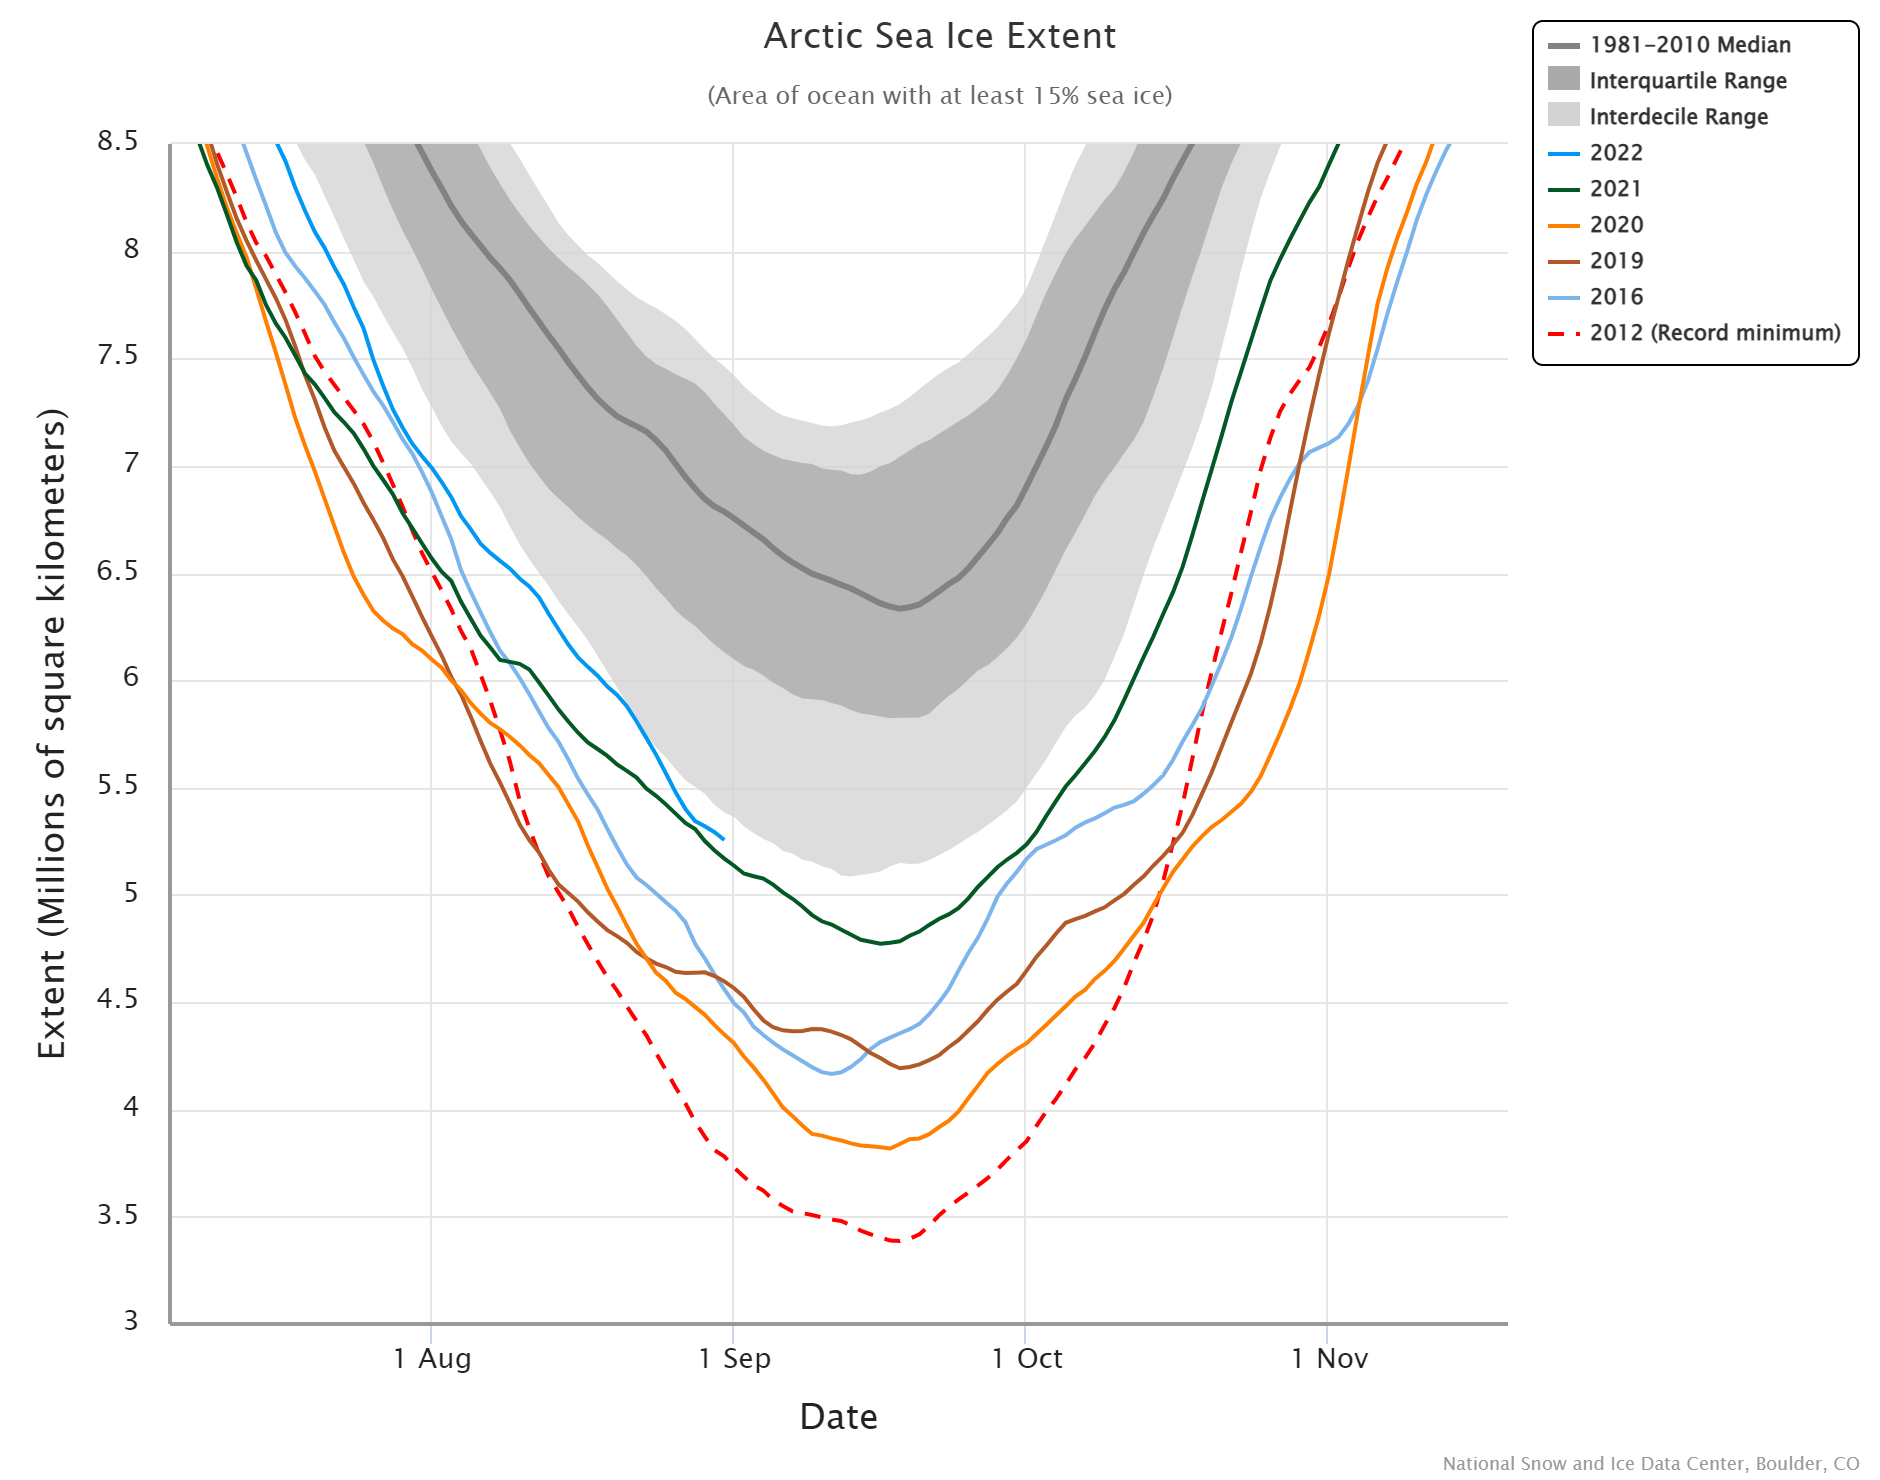
The coarser resolution of the SSMIS instrument produces a higher value for extent, 5.256 million km2 on August 31st compared to 5.169 million km2 last year.
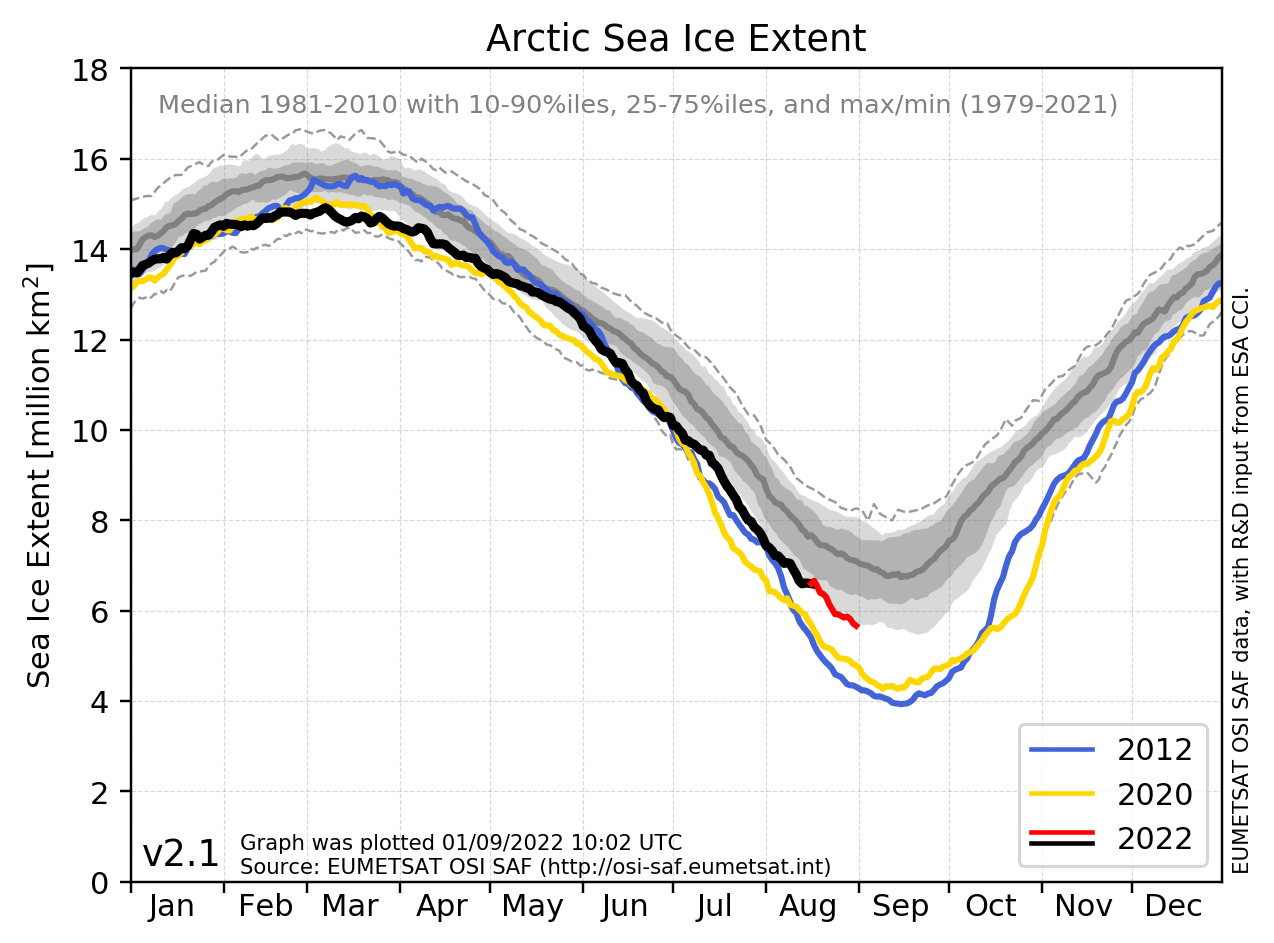
Then there are some European sea ice extent metrics. Here’s the EUMETSAT OSI-SAF SSMIS based extent. 5.67 million km2 on August 31st compared to 5.56 million km2 last year.:
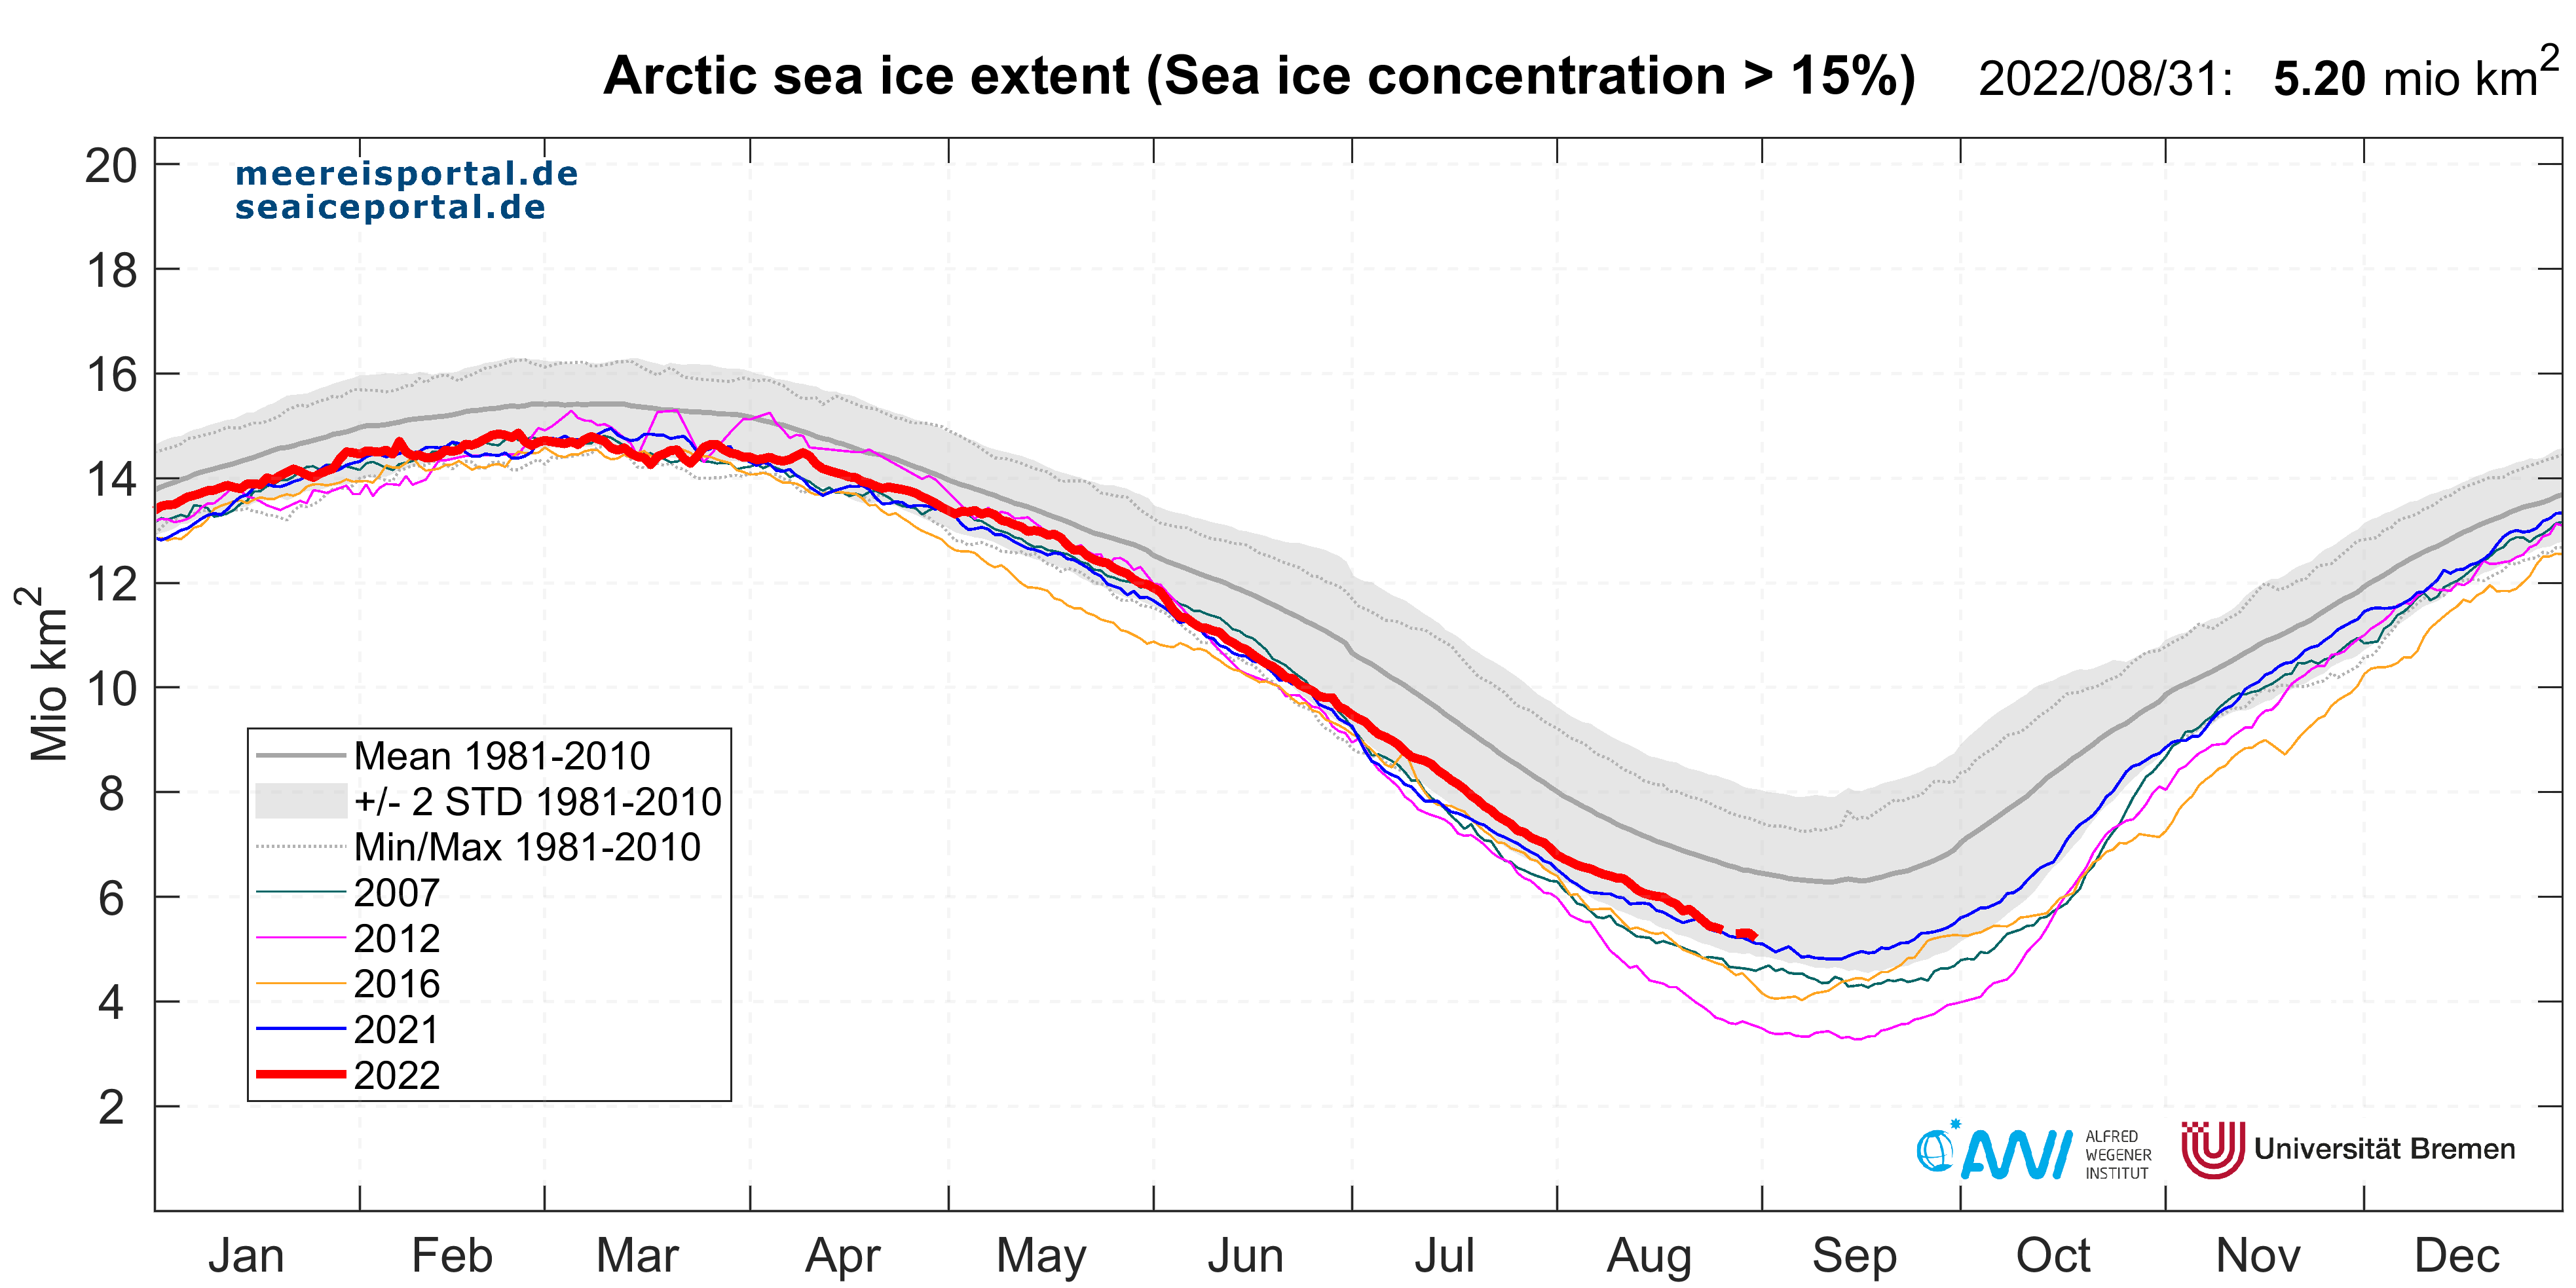
Here too is the Alfred Wegener Institute / University of Bremen AMSR2 based extent. 5.20 million km2 on August 31st compared to 5.11 million km2 last year.:
Finally, for the moment at least, here are the end of August numbers for the “high resolution” AMSR2 metrics:
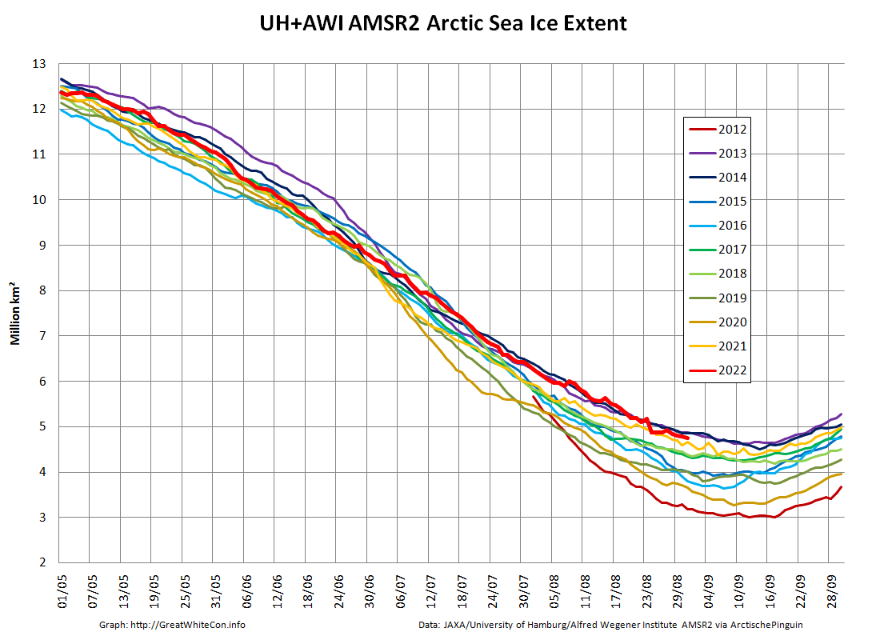

Extent on August 31st 2022 was 4.76 million km2 compared to 4.66 million km2 on the same date last year.
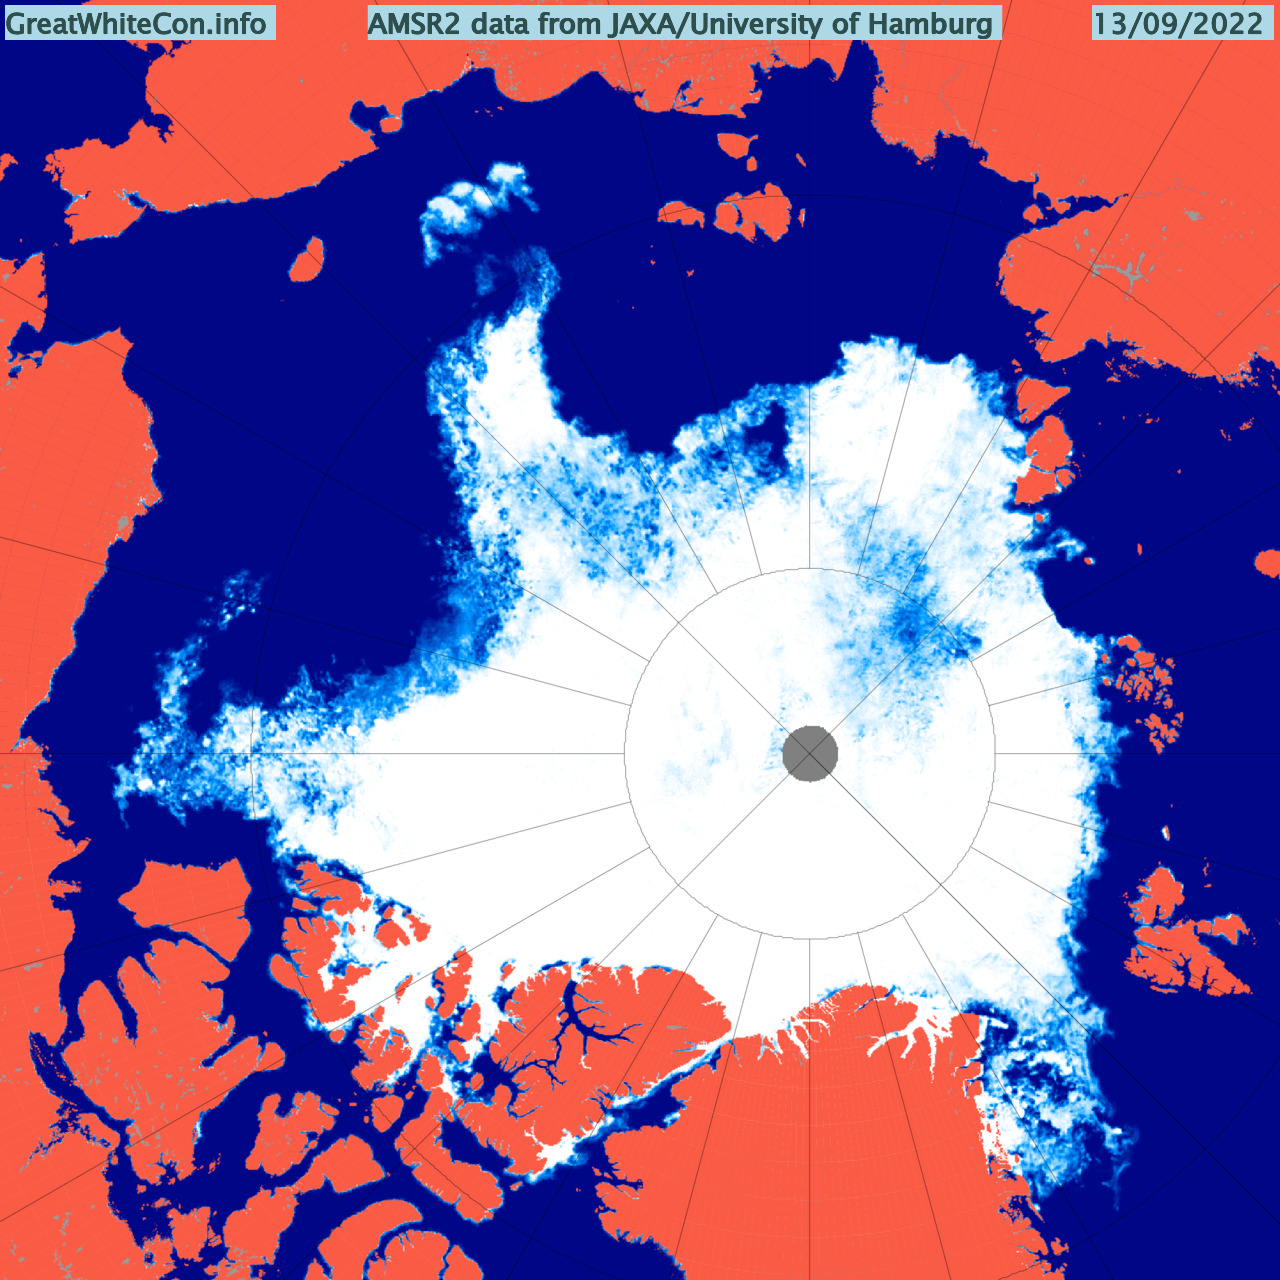
[Edit – September 14th]JAXA and NSIDC daily extent are both still declining, so 2022 is certainly not going to deliver the earliest minimum in the satellite record. The areas of open water north of 85 degrees are freezing over:
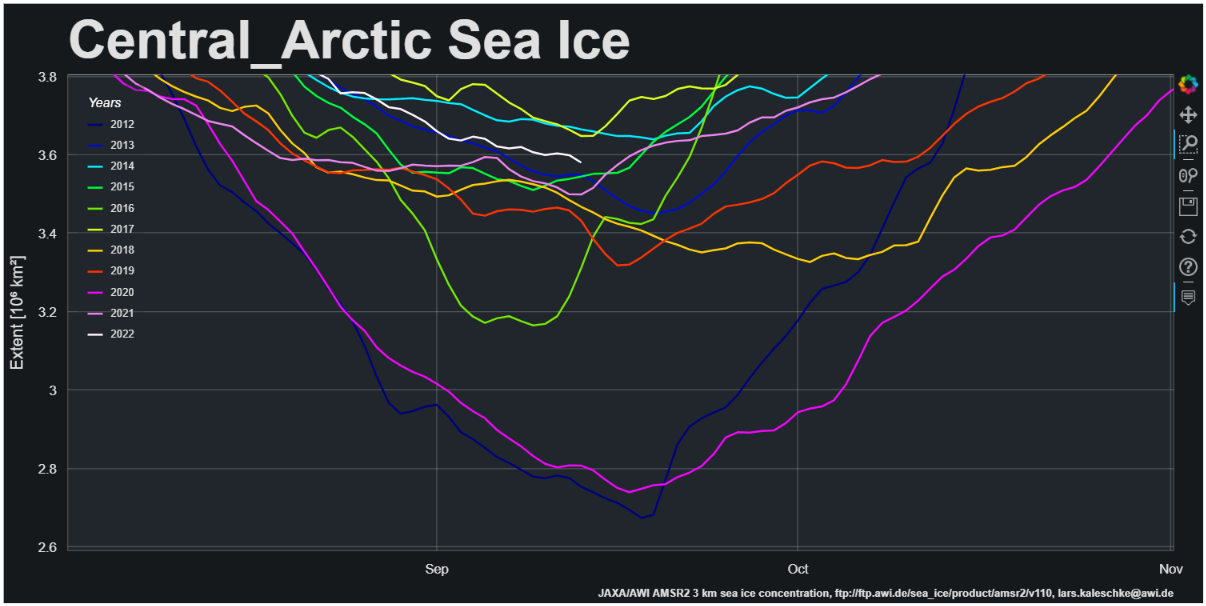
However according to AWI’s high resolution AMSR2 metric overall Central Arctic extent is still declining, so perhaps we will have to wait a while longer for this years minimum?
The NSIDC have almost called the minimum:
The sun is about to set for the winter at the North Pole, and so the 2022 sea ice melt season is coming to an end. As of September 19, 2022, Arctic sea ice extent stood at 4.68 million square kilometers (1.81 million square miles), placing it ninth lowest in the satellite record for the date. The high-latitude polynyas have frozen over.
P.S. Now confirmed:
On September 18, Arctic sea ice likely reached its annual minimum extent of 4.67 million square kilometers (1.80 million square miles). The 2022 minimum is tied for tenth lowest in the nearly 44-year satellite record, with 2018 and 2017. The last 16 years, from 2007 to 2022, are the lowest 16 sea ice extents in the satellite record.
Watch this space!
Just squeezed below 2013/14 for minimum extent , this morning, 5th of September
JAXA extent, as per Arctic sea ice forum
JAXA extent down to 4,666 K , on the 10th of September. Very close to last year and 2010..but I imagine time is getting very short now!
Now 4,660!
Yeah, like 4,666 and 4,660 are different numbers! The major data sources can’t agree to a resolution of 300km^2, and 6km^2 is supposedly a thing? Maybe I just missed the /sarc label in your post, Jim…
You appear to have missed the exclamation mark though Taylor?
And extent is still declining. See above.
If the exclamation point was your /sarc label, Jim, then yes, I missed it, sorry. And yes, both extent and volume continue to decline. Likely late minimums for both this year, particularly since after months of being at or below the long term “above 80 degrees North” average, Arctic temps are now declining much slower than that average.
Lol, will the real /sarc please stand up?
Tuesday 13, another JAXA drop to 4,600 takes us a whisker below last year’s minimum!
JAXA extent posted another rise for the 18th of September, maybe the result of some of the ice being blown south of 80° on the Pacific side..
Has the minimum arrived, or will we see a new low by that metric in the coming days?
High resolution AMSR2 extent also looks as though the minimum has been reached:
If you watch the animation on the open thread you’ll see significant refreeze apparently occurring in the far north of the Beaufort Sea:
Unless ex Merbok somehow manages to reverse that the die is cast. IMHO!
I think your humble opinion is a reasonable one, Jim. NSIDC and DMI both are also showing an uptick in extent and DMI is also showing an uptick in volume. Above 80 temps are finally falling (around -5C now) so the excitement may be over, despite Merboc.
However before counting all your chickens see also:
NSIDC daily extent is down from yesterday, albeit still above the prior minimum.
Agree things are uncertain, but it’s pretty dark and cold along Merbok’s course, and per NSIDC, the closest ice of any significant amount is north of 70 degrees. At this point, ice breakup would likely quickly refreeze. Next week or so will be interesting. This is where the challenge of differing instrument resolutions and differing algorithms comes into play…
Now there’s a new wrinkle. Current storm track forecast shows hurricane Fiona passing off Halifax as a category 2, and headed to Labrador where the winds die down but likely a lot of moisture remains. Not a threat to sea ice, I don’t think, but could dump massive snows in Greenland and create a major spike in an already ahead-of-season SMB. Will be interesting to see how this plays out.
I’ve been following Fiona for a while. Here’s the NHC’s prognosis earlier today:
However it’s a bit early to be taking a view about what happens after she reaches Labrador.
If she reaches Labrador!
Just realised I might get a kaffemik with Fiona here in Nuuk.
So Nuuk is your home base?
Or are you travelling?
The assorted extent metrics have posted significant gains today:
Pending final confirmation the AWI high resolution AMSR2 minimum Arctic sea ice extent for 2022 was 4.38 million km² on September 15th.
Yes, and NSIDC has it at 4.68 on September 19th. So now we can declare a contest winner. The rapid late melt in September ruined my hope for a 5+ extent number, but maybe next year?
Are you a communist?
Where did that come from? Clearly I don’t ‘speak your language’ and you seem to be having trouble with mine…
Re NSIDC “The last 16 years, from 2007 to 2022, are the lowest 16 sea ice extents in the satellite record.”
They always seem to find a metric to whip us into a frenzy and be quotable in all the right posts and articles. For example, they could have said “Sea ice continues to exceed the all time low set 10 years ago”, but what would be the fun in that?
If you look at the trends the obvious anomaly is the low extent in 2012, not the “high” extent over the past 2 years:
Quite agree Jim 2012 was an anomaly but look at the trend after 2007.
No overall decline in arctic sea ice minimum. If anything there is a slow but steady rise. I wait 2023 with interest.
Jeez Neil!
For the umpteenth time, please peruse the academic literature on the apparently non intuitive concept of the “Slow Transition“.
You don’t pick trends versus a single year: you pick them versus a 30 year average!
Hypothetically, suppose the annual maximum extent increased at the same rate as the annual minimum extent decreased then average extent change for the year would be zero.
So wouldn’t it be more accurate to use annual average extents rather than minimum extents.
Here you go Peter:
That is one wild graph, Jim. Thank on behalf of the whole internet for posting that one I dare say.
=8?o-}<<<<<<<<<<:::::::
To my mind it really shows the problem as being, atleast in the measured/documented sense, post 2000 OR about when China came online.
You of course have to blame America and the rest of the western world for what happened up to that point but I’ve always thought the indicators were such that they pointed to the problem being as to when China really took off in their burning of coal.
Possibly a little simplistic but the post 2000 thing really begs an explanation.
Why not use all the data, not just the three months for greatest ice extent loss.
If you graphed the three months with minimum loss, the graph would be quite different.
It is using all the data, but not starting on January 1st.
Depends on how you interpret the answers… averages are great if you interpret correctly… complex systems require multiple indicators, just ask any economist: and I suspect you’re not bad on your economics!!
Whose they?
Hi Jim,
Clicked on “slow transition”.
Found a paper by Bitz & Roe.
Quickly put a search on “slow” and “transition” on the paper.
Zero result for both.
Is “slow transition” some new term I should be familiar with?
Will study the Bitz & Roe paper as directed.
However, I think I will continue to await recovery in sea ice extent in the real world over the next decade.
If you’d scrolled down a bit you would have come across these helpful hints:
https://GreatWhiteCon.info/2022/02/facts-about-the-arctic-in-february-2022/#comment-545994
Neil, how do you define the word “Recovery”? Do you compare your figures to 2012? If so, which ones?
Hey Jim, https://doi.glamos.ch/figures/massbalance_anomaly_summer.pdf ,
do you think there might be a trend of trends going on or what?
Maybe taking averages will fix it?
Oops, i meant this one: https://doi.glamos.ch/figures/volume_evolution.pdf
(My Bad!)
I viewed the Rhone and Aletsch Glaciers with my own eyes one summer several decades ago. I even glissaded down the Glacier de Pièce too!
I expect they all looked very different this summer.
So are they gonna melt?
It certainly looks that way? From your link:
Yes, but Jim, what about in your opinion!(?)
It certainly looks that way!
Question mark?
Exclamation mark!
lol, are we both unable to correctly punctuate?