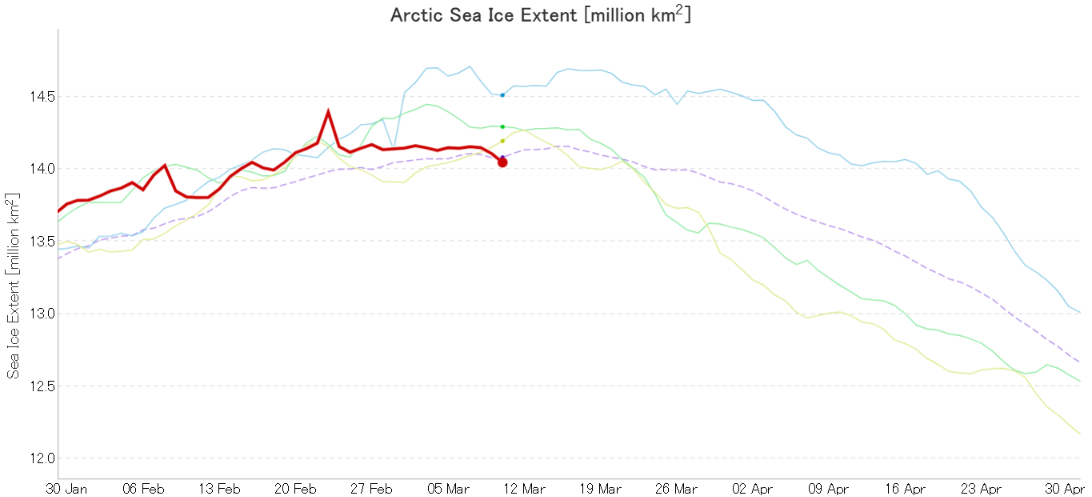
Here’s the latest graph of Arctic sea ice extent from JAXA/ViSHOP, which looks a bit unusual to say the least:
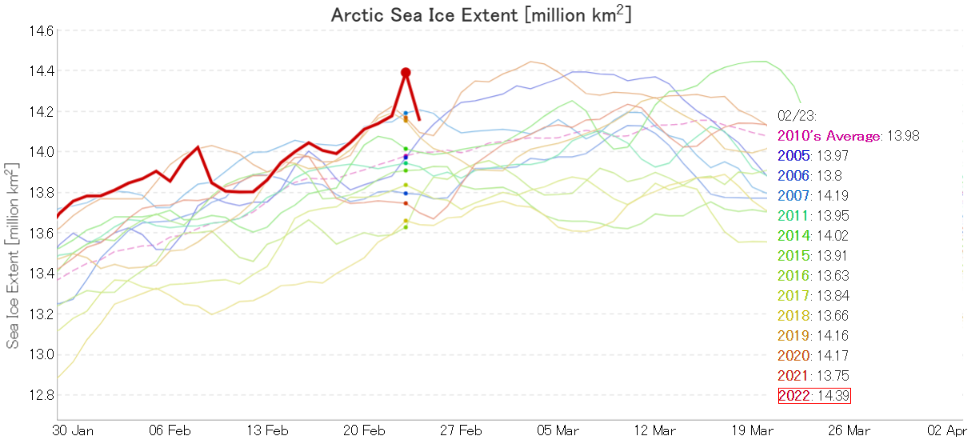
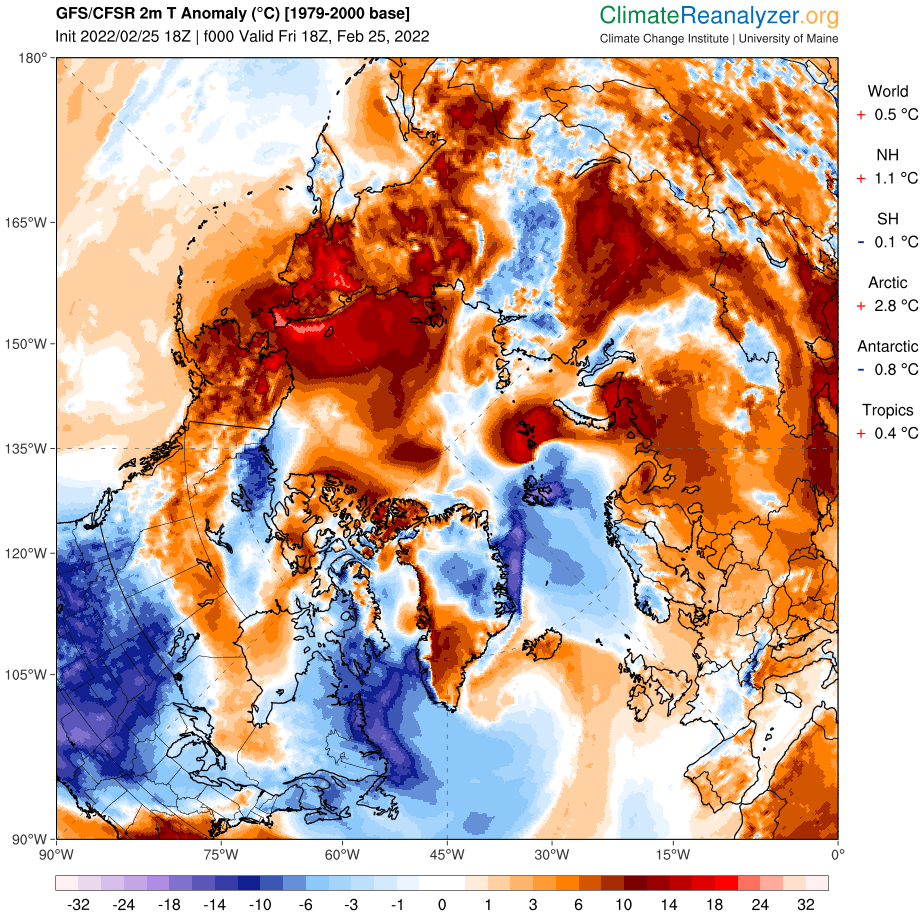
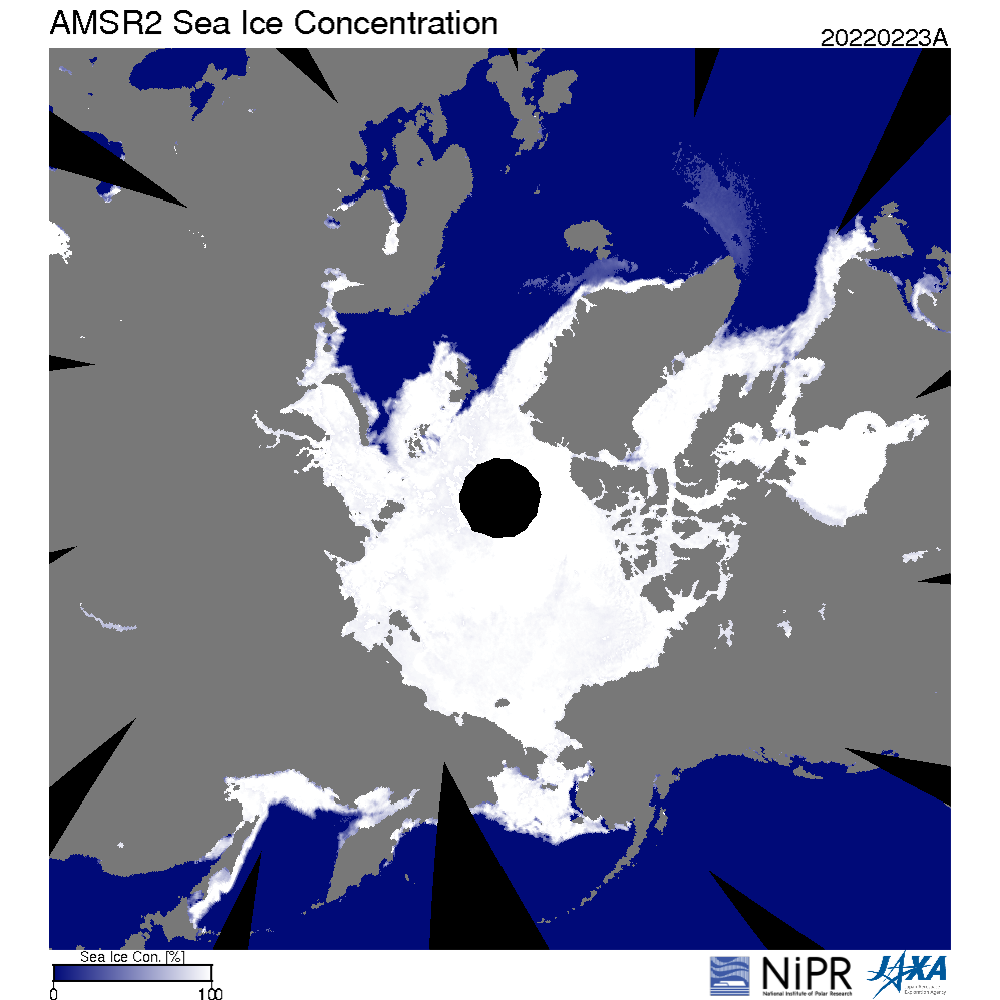
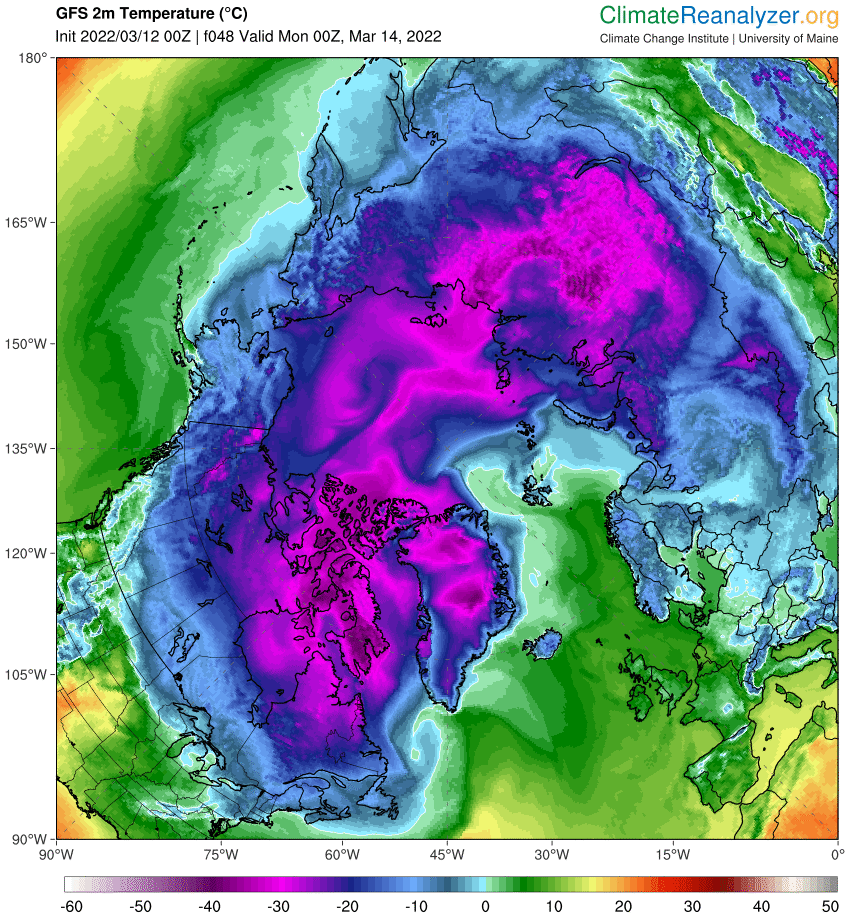
It certainly caught my eye! Could that sudden peak on February 23rd be the maximum extent for the year? To be frank it looks more like an artifact in the underlying gridded AMSR2 concentration data, but it’s not wholly beyond the bounds of possibility. The Pacific side of the Arctic is anomalously warm at the moment:
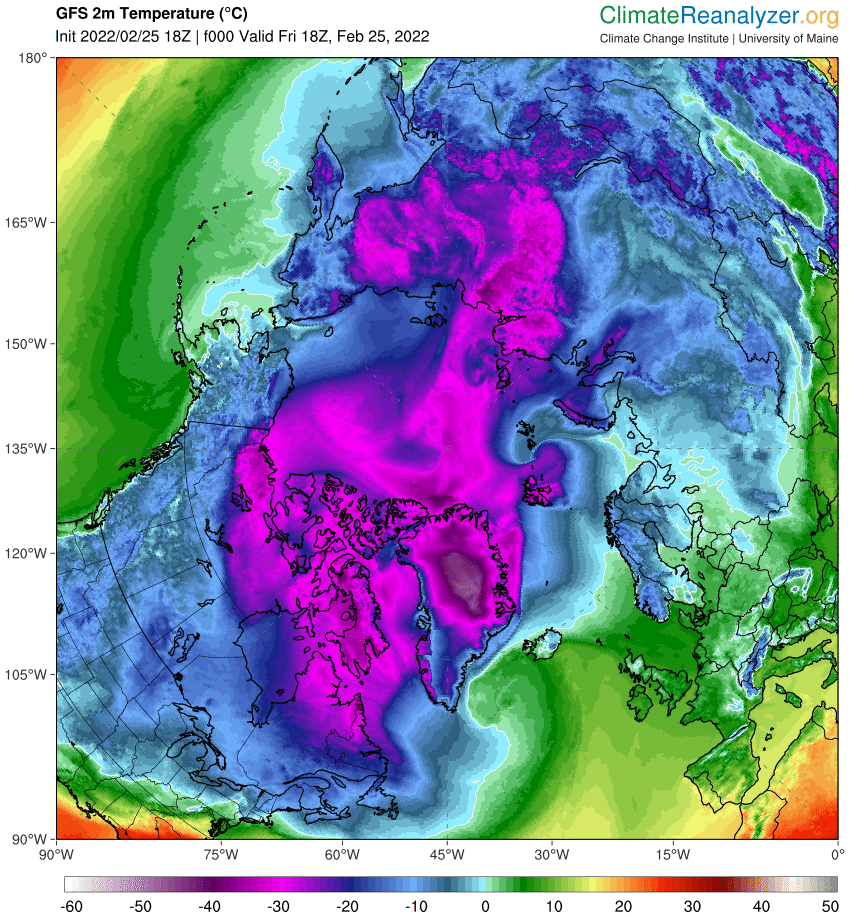
and parts of the Bering Sea are above freezing point:
For the moment then the (extremely!) provisional JAXA Arctic sea ice maximum extent for 2022 is 14.39 million km².
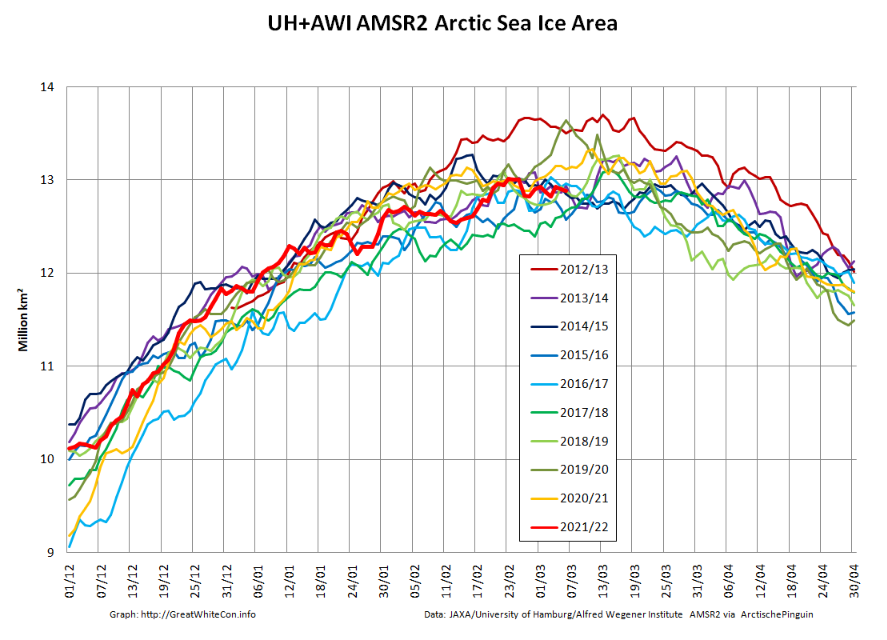
By way of an AMSR2 second opinion let’s also take a look at our favourite “high resolution” AMSR2 metrics, which combine recent data from the Alfred Wegener Institute with historical data from the University of Hamburg:
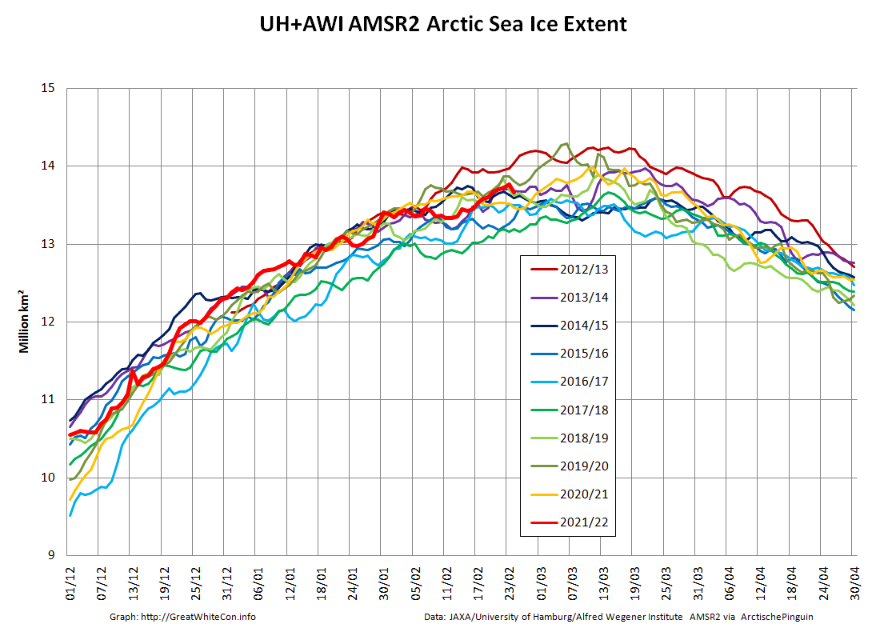

The extent peak on the 23rd is of much smaller magnitude, and it’s almost non existent on the area graph.
Curiouser and curiouser.
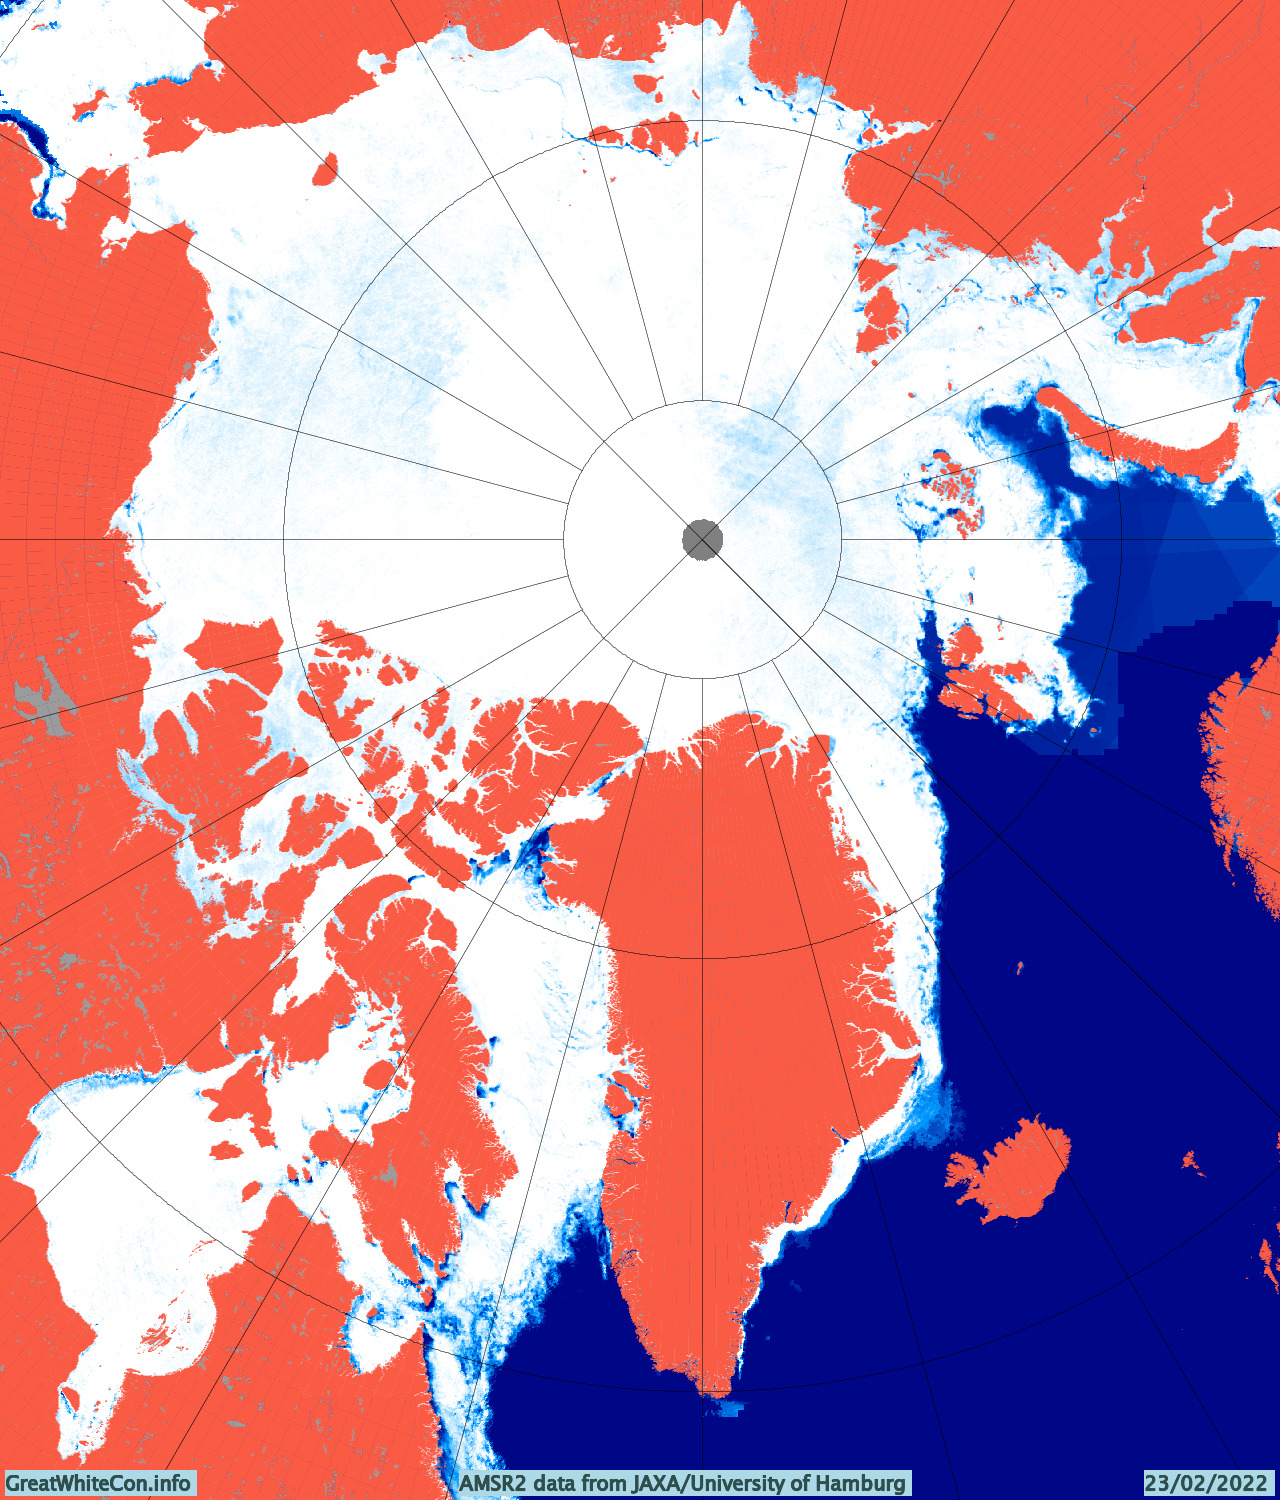
[Edit – March 1st]The JAXA maximum on February 23rd is definitely an artifact of dodgy AMSR2 data. Take a look at the Denmark Strait between Greenland and Iceland in particular:
The University of Hamburg version also shows an anomaly in the Barents Sea:
However the 5 day averaged NSIDC extent graph now shows a significant peak on February 25th:
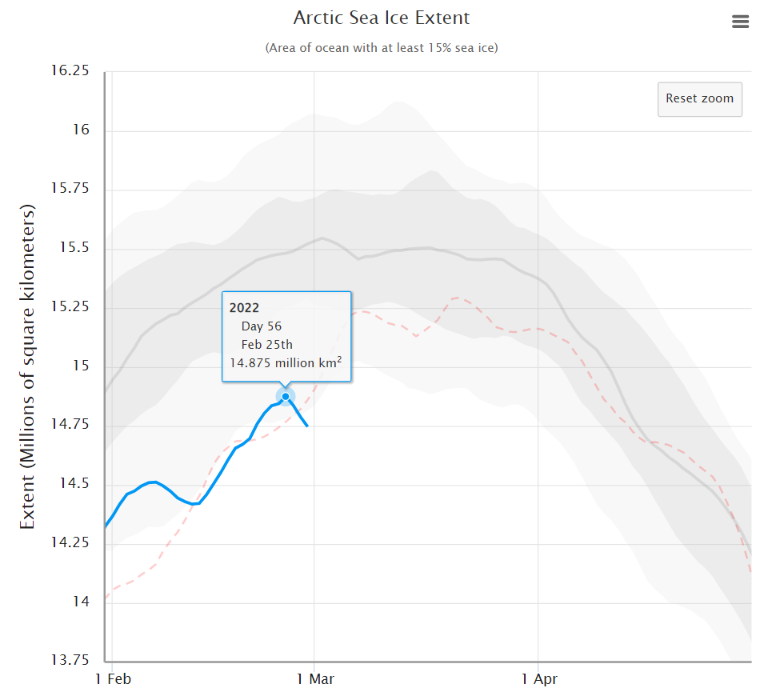
Is anybody willing to put money on 14.875 million km² just yet?
[Edit – March 7th]Here are the latest “high resolution” AMSR2 graphs:
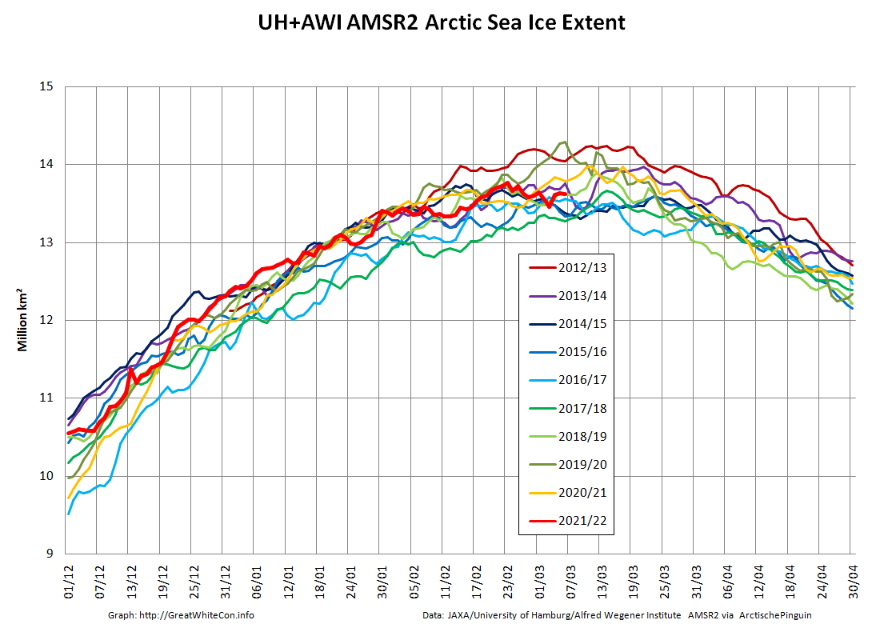
The February 23rd maximum holds, for the moment at least.
[Edit – March 11th]Here’s the latest JAXA Arctic sea ice extent graph:
A late surge is now looking exceedingly unlikely. However given that the maximum seems to have occurred during the brief period of dodgy data around February 23rd, what magnitude and date should be assigned to the 2022 maximum?
Whilst I ponder that thorny problem…
Now I’ve really gone and done it! Started the “2022 melting season” thread on the Arctic Sea Ice Forum that is:
https://forum.arctic-sea-ice.net/index.php/topic,3749
Lots of heat heading in the direction of the North Pole sealed the deal:
According to the latest edition of the NSIDC’s Arctic Sea Ice News:
Arctic sea ice has likely reached its maximum extent for the year, at 14.88 million square kilometers (5.75 million square miles) on February 25. The 2022 maximum is the tenth lowest in the 44-year satellite record. On the same day, on the other pole, Antarctic sea ice reached a record minimum extent, at 1.92 million square kilometers (741,000 square miles).

The date of the maximum this year, February 25, was fifteen days earlier than the 1981 to 2010 average date of March 12. Only two years had an earlier maximum, 1987 and 1996, both on February 24. This year is the second earliest date on the satellite record, tying with 2015, which also reached its maximum extent on February 25.
Watch this space!
On the other hand NSIDC (MASIE) hit 15.0 today, actually achieving my prediction from a few months back. We’ll see where the various other sources land (I suspect no max yet), but I truly wish the scientific community would rally around one source or at least provide commentary on each other’s take on Extent.
I also note that for the first time in a while, DMI, NSIDC and MASIE all show ice edge completely below the 80th parallel. Usually Fram Strait is the holdout, but not this year, and lonely Bear Island is surrounded by ice as well. Next few weeks should prove interesting…
Indeed! I was saving this for the March open thread, but please see the Beaufort Sea:
Still comfortable with 14.875 M as peak NSIDC extent, Jim? I notice lately it’s on somewhat of a rebound, with MASIE briefly at 15 (now 14.9) and DMI still heading up (slightly). JAXA appears stalled as well.
Maybe by the end of the week things will resolve, and you can provide an update?
In the meantime, volume keeps chugging along. I’m hoping for the PIOMAS update soon…
I haven’t called the maximum yet Taylor!
For volume etc. see the new open thread:
https://GreatWhiteCon.info/2022/03/facts-about-the-arctic-in-march-2022/
I agree about your patience on the maximum, Jim. I noticed today that NSDIC has (or ‘have’ if you prefer) just put out their February commentary, and refrained from calling it as well. ‘14th lowest’ is just not generating a lot of excitement, and with no February trend over the past 17 years, there’s not a lot on which to dwell. MASIE is back up to 15.0, but it’s been bouncing as well. Just have to wait, along with the polar bears…
My patience has worn exceedingly thin:
https://GreatWhiteCon.info/2022/02/the-2022-maximum-arctic-sea-ice-extent/#Mar-11
Will we ever know the true value of the 2022 maximum!?
The “true” value does of course depend upon which particular metric you’re looking at. JAXA != NSIDC != OSI-SAF etc.
If there isn’t a late surge to a new maximum I’ll endeavour to come up with a more reasonable estimate in due course. Meanwhile here’s the latest NSIDC graph:
Why would February trend matter? The sattelites don’t even care..
Well, February and other winter months have been trending down for many years of the satellite record. Whether the satellites themselves care. I can’t say, but many satellite watchers did seem to care, and loudly expressed their concern.
Now that the trend seems to have slowed or stopped, there’s a bit of silence on the topic. Maybe they don’t care due to the inconvenience to their cause, who knows?
What cause? Alarmism about February sea ice in the Arctic never existed because it was never measurable.. Thickness is gold but its not directly measurable!
“Now that the trend seems to have slowed or stopped…”
?? looks remarkably consistent to me:
[Is that the one? – Mod]
Jim,
maybe you could show the time series and get rid of the mess I made?
NSIDC extent anomaly, February, 1979 – 2022
Not sure what happened. I just copied and pasted the sea ice extent chart from the nsidc website, and that’s what showed up.
The easiest thing is to copy images to your own computer and then attach them to a comment using the “Choose files” button below.
Of course if you’re on a mobile device that’s slightly trickier!
Yes, thanks!
The long term trends for February have hardly varied over the last 12 years:
1979 – 2010: -2.9% (per decade)
1979 – 2015: -2.9%
1979 – 2020: -2.9%
1979 – 2022: -2.8%
(relative to the 1981 – 2010 average extent)
“…Looks remarkably consistent to me.” Even your own analysis shows it’s slowed over the entire period (1979-2022 down from 2.9 previously to 2.8) and the last 4 years were all ABOVE the linear trend. Care to guess how long it’s been since that happened? Additionally, during the last 15 years, the linear trend is essentially flat. So yes, it’s obviously “slowing” and won’t start going down again until we have a year below the trend line. That’s just math. As to when a downward trend will resume, I haven’t a clue. But let’s not argue with the current data and trends, they are what they are.
Why is there no JAXA update to the sea-ice extent since March 21?
I don’t know why it was absent, but it’s back now: