Monthly Archives: December 2021

The GWPF Boldly Go Where Steve Koonin Feared To Tread

My apologies for the mixed metaphors in today’s title, but the news I bear is beyond bizarre.

In a press release earlier today The Global Warming Policy Foundation proudly announced that:

A new paper by an eminent meteorologist says that trends in polar sea-ice levels give little cause for alarm. The paper, by Professor J. Ray Bates has just been published by the Global Warming Policy Foundation.

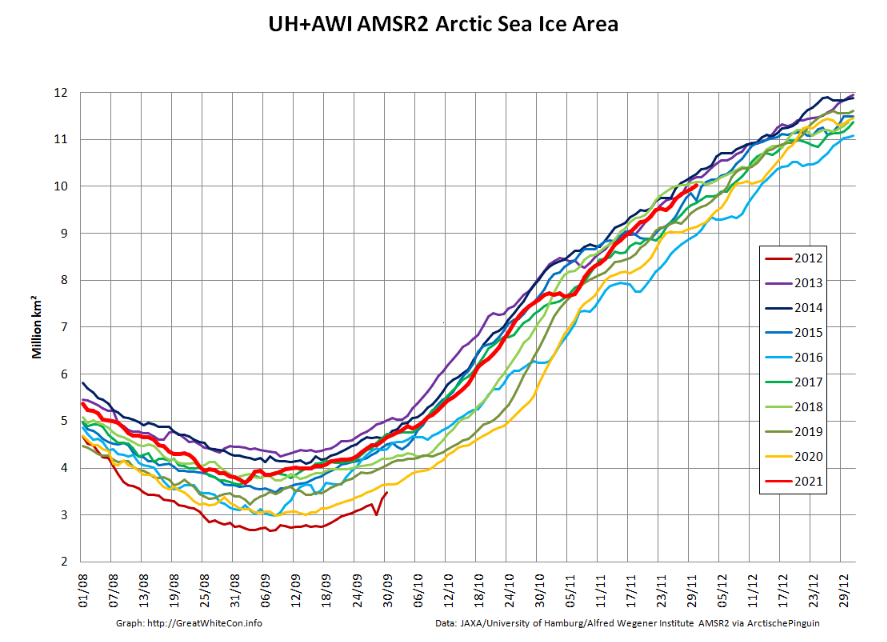
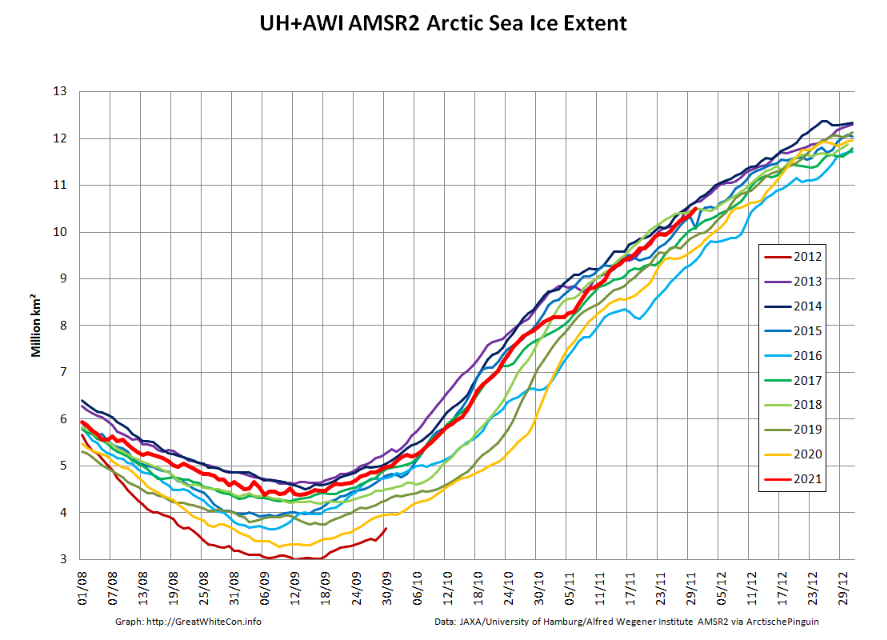
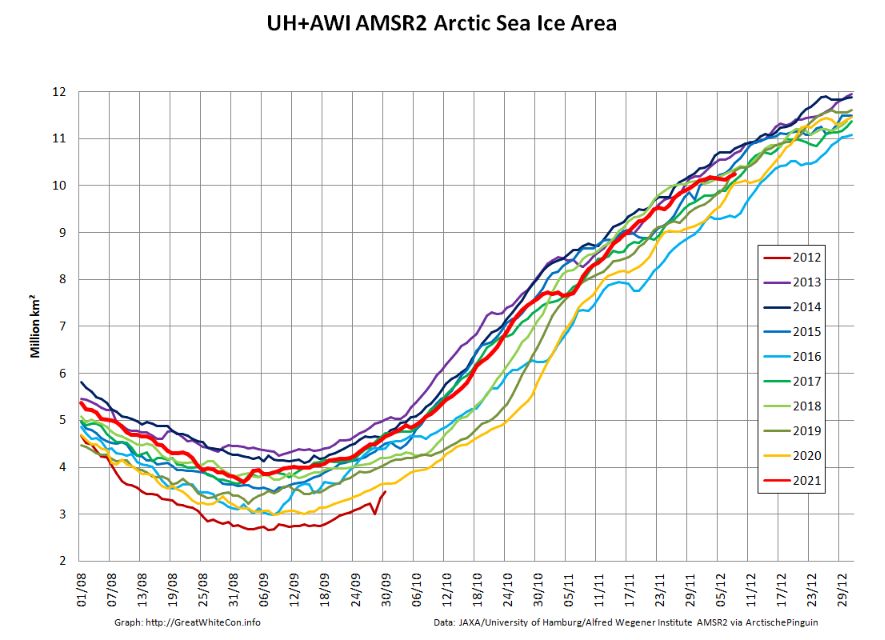
According to Professor Bates, climate model simulations indicate significantly decreasing sea ice levels in both hemispheres, with the greatest decreases occurring in September each year. However, the observed September trend in the Antarctic is actually slightly upwards, and while observed levels in the Arctic have fallen over the last 40 years, they have been quite stable since around 2007.

Professor Bates said:

“In 2007, Al Gore told us that Arctic sea ice levels were ‘falling off a cliff’. It’s clear now that he was completely wrong. In fact, the trends in sea-ice are an antidote to climate alarm.”

Professor Bates also says that little reliance should be placed on model simulations of future sea-ice decline:

“Climate models failed to predict the growth in Antarctic sea ice, and they missed the recent marked slowdown of sea-ice decline in the Arctic. It would be unwarranted to think they are going to get things right over the next 30 years.”

Professor Bates’ paper is published today, and can be downloaded here (pdf).

By all means download Ray’s “paper” from the link above and take a look at his introduction, which begins as follows:

The recent publication of the book Unsettled by Steven Koonin has led to the likelihood of increased scrutiny of the perception of a climate emergency,1 an idea which has become so widely established in recent years. Koonin, a former scientific advisor to the Obama administration, has demonstrated that what the public are being told by the media is not necessarily what the scientists are saying. He has also shown that what is being relayed in the national and UN climate assessments has often been written for the purpose of persuading rather than informing.

Unsettled clearly shows that important aspects of climate science, which the public have been persuaded to regard as beyond dispute are, in fact, quite unsettled.

Regular readers may recall that as soon as Steve’s book was published in machine readable format we established that it made no mention whatsoever of sea ice, whether of the Arctic or Antarctic variety.

Furthermore, when I attempted to debate that fact with Prof. Koonin he disappeared without trace before justifying that strange omission, beyond asserting that:

The topic is somewhat distant from ordinary folks’ perception.

It seems that Prof. Bates and the GWPF disagree with Prof. Koonin on this topic, since presumably their “paper” is addressed to ordinary folks? Ray even explicitly states that:

Although Unsettled covers a broad spectrum of climate topics, it does not treat in depth the issue of recent polar sea-ice trends, which are key indicators of changes in the global climate.

His “paper” goes on to assert in section 2 that:

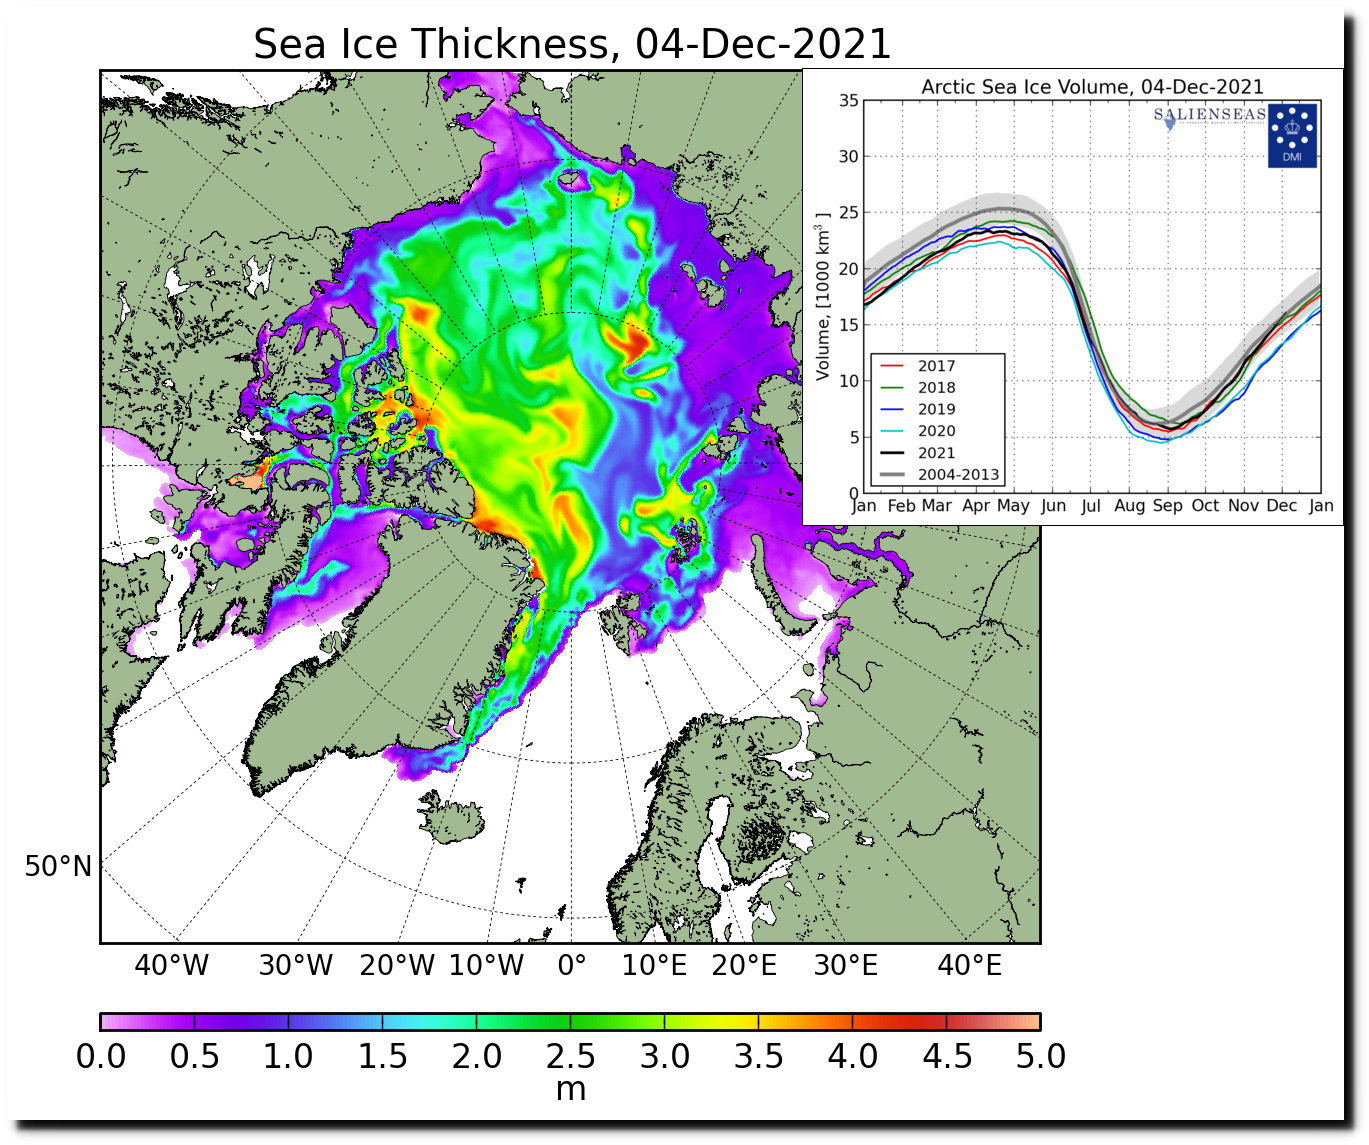
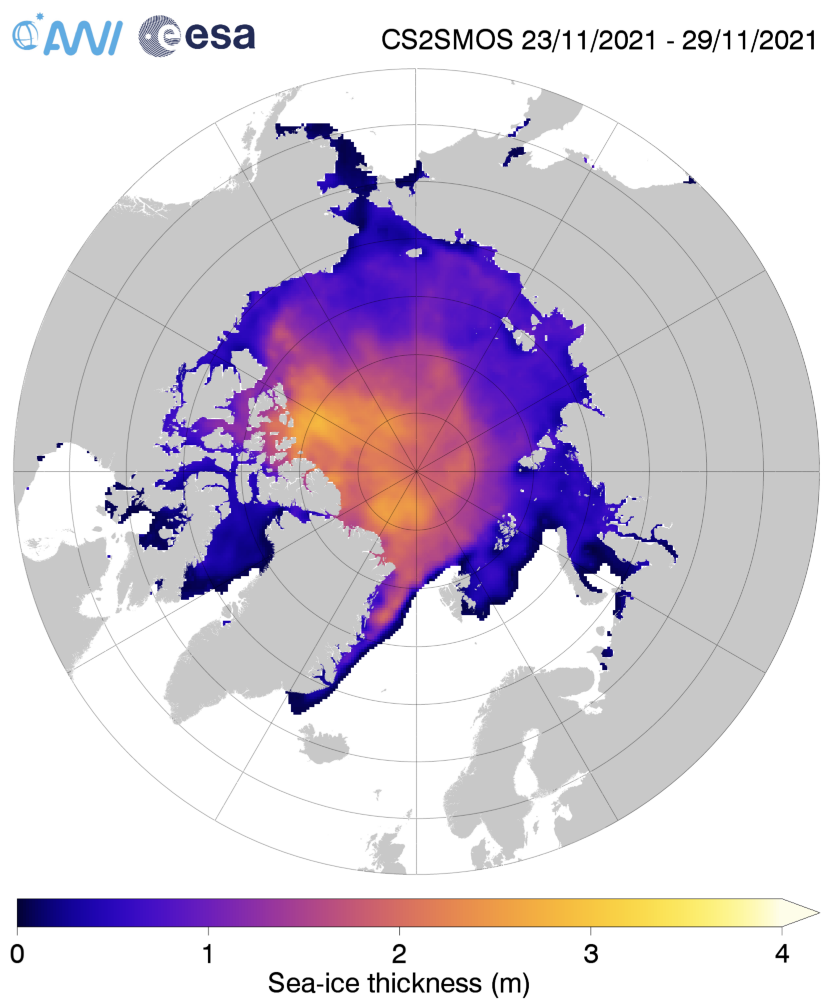
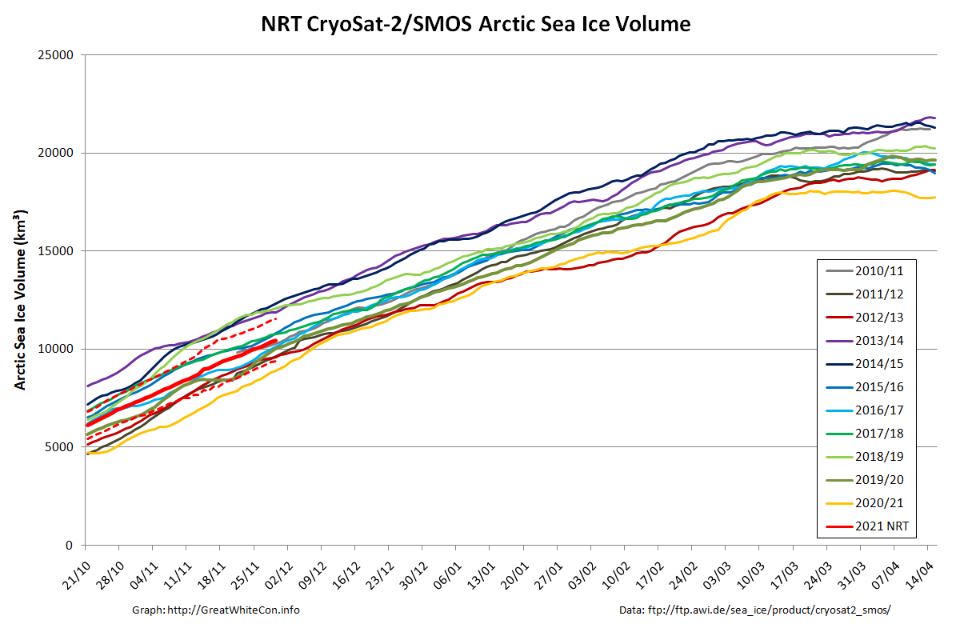
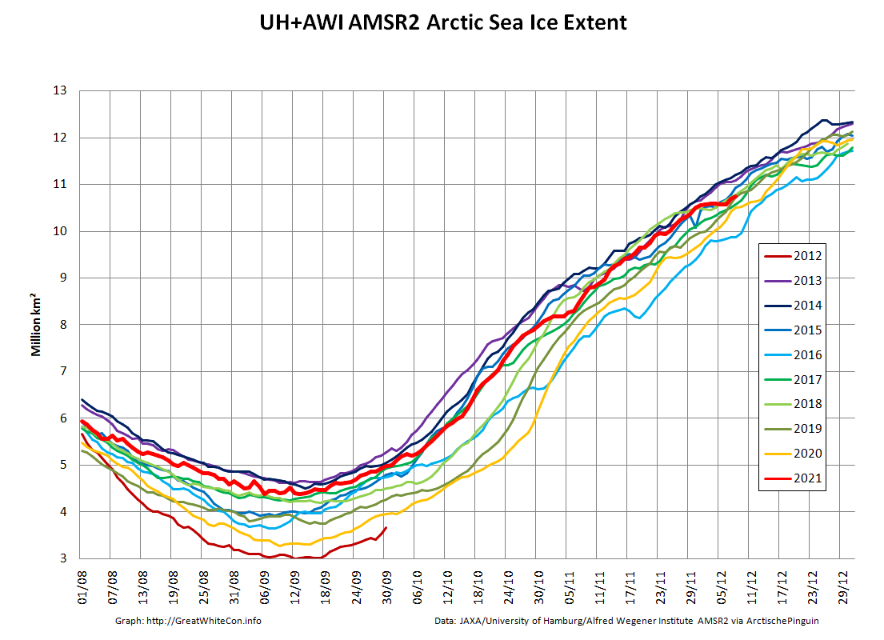
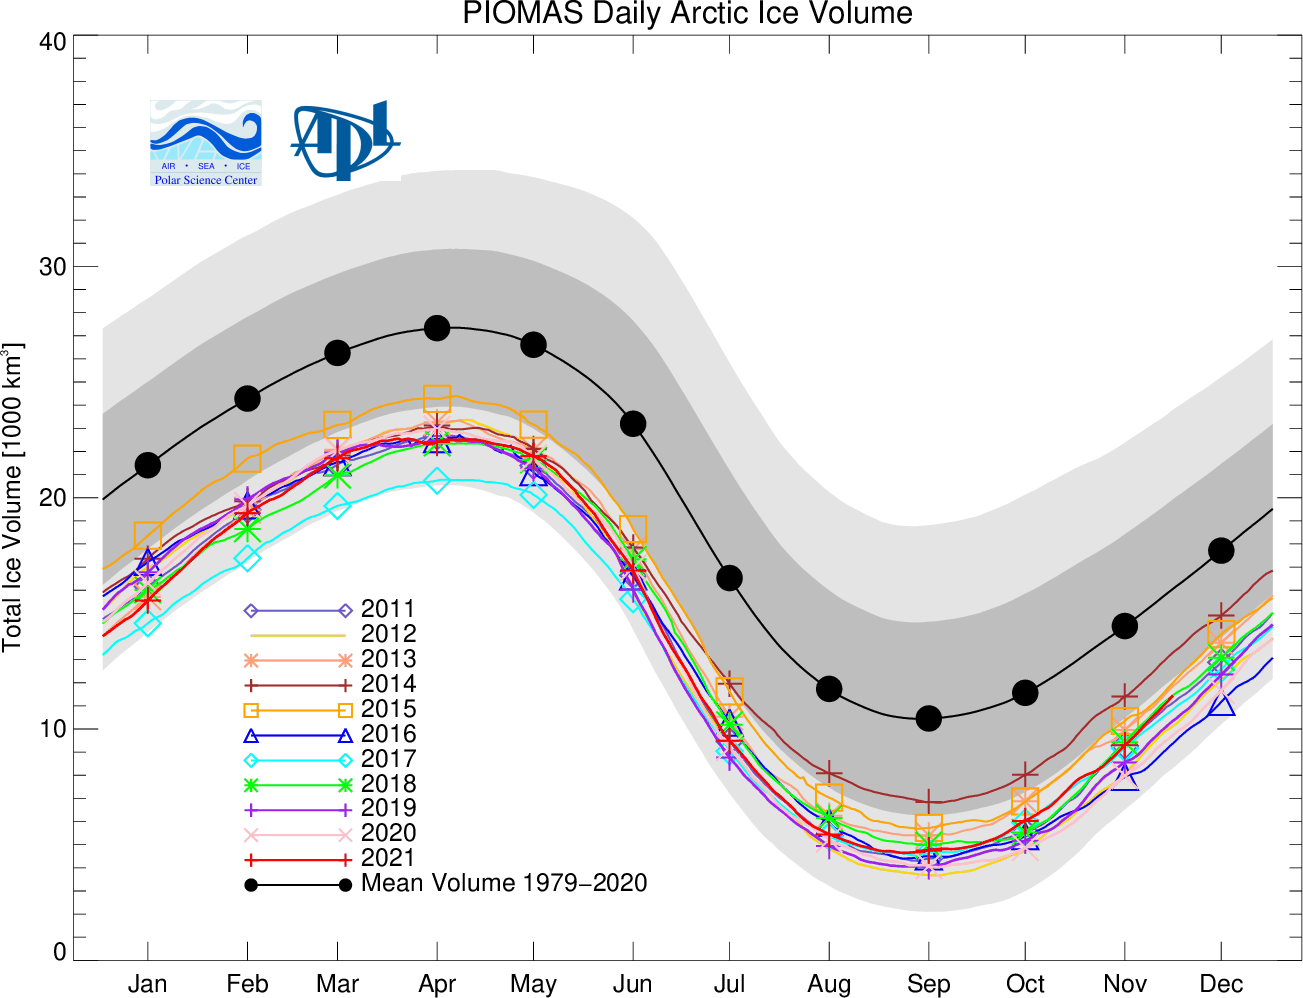
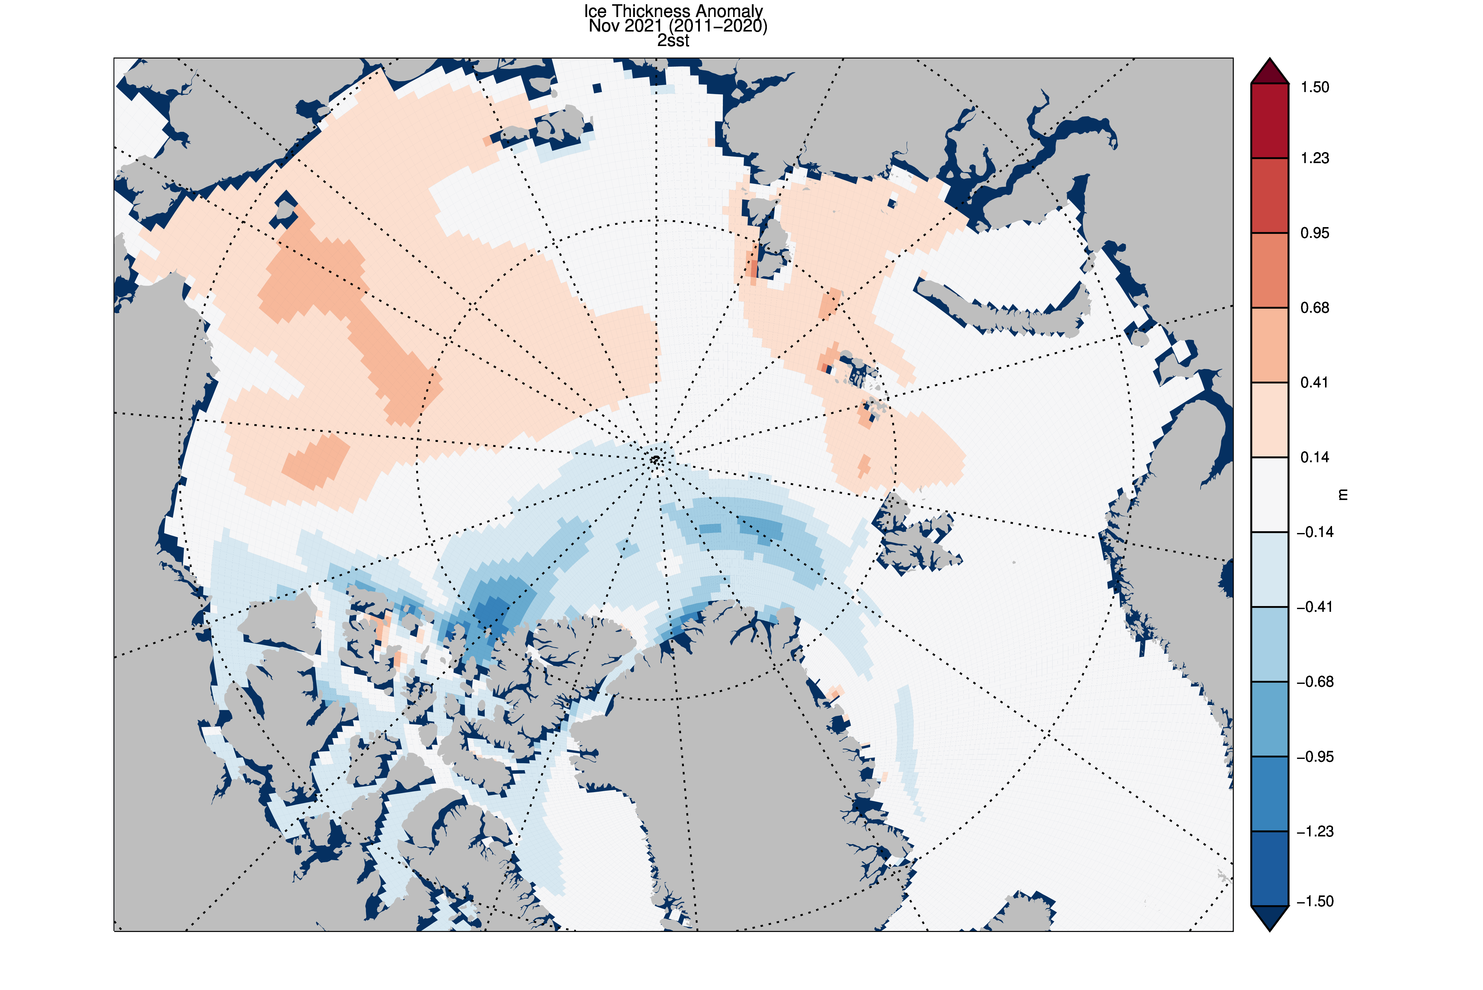
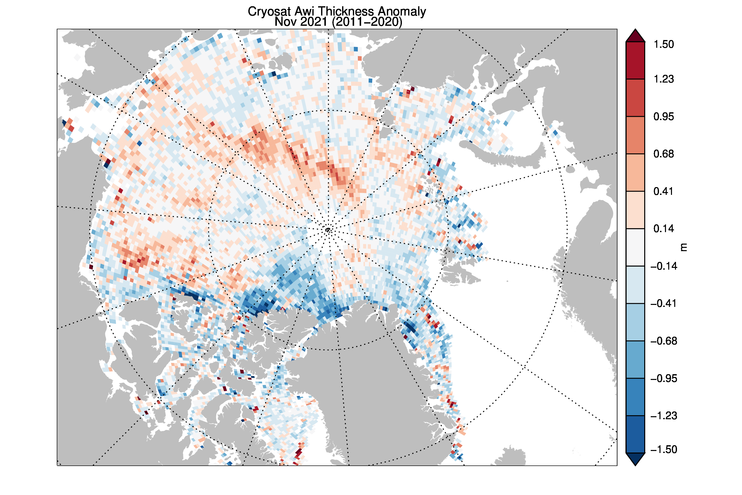
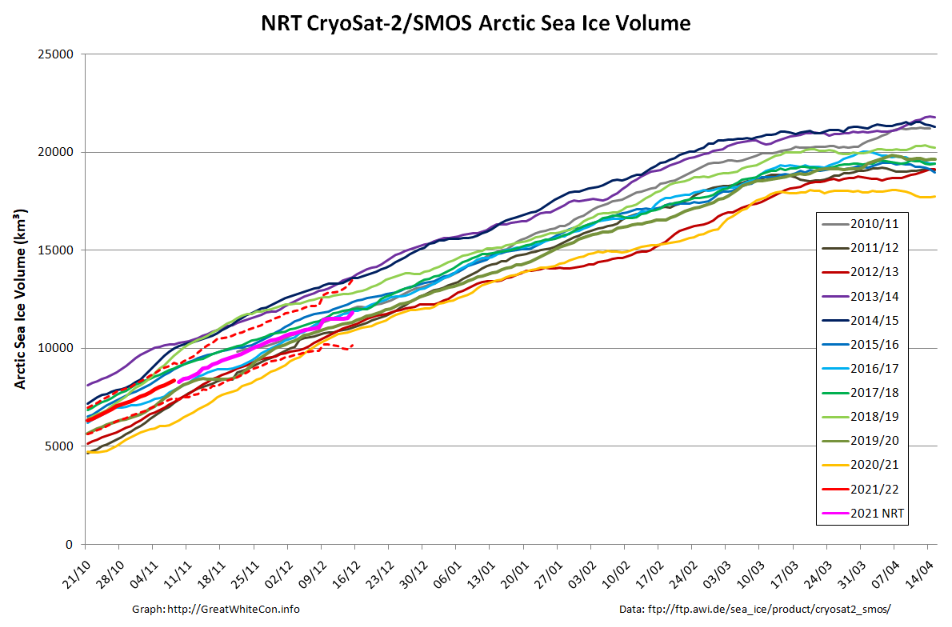
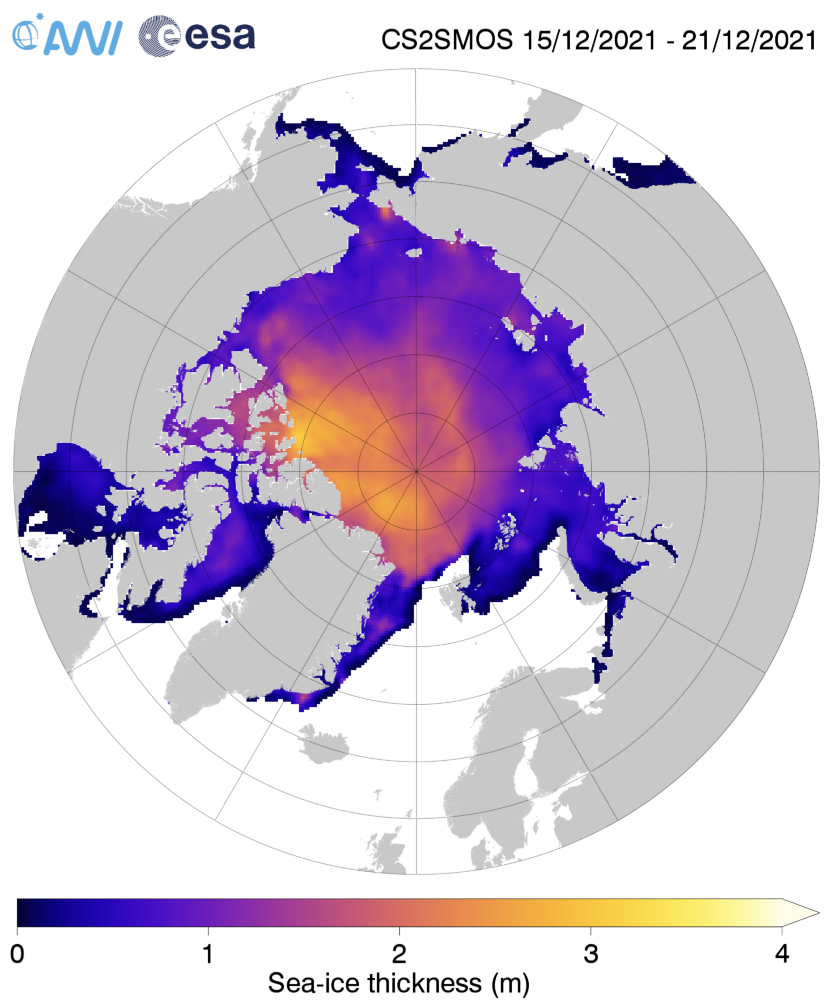
Since the introduction of passive-microwave satellite observations in the late 1970s, polar sea-ice extent has been among the most accurately observed climate indicators. Sea-ice volume, on the other hand, is much more difficult to measure.

So far so good I suppose, but then we are told:

In December 2007, former US vice-president Al Gore, in his Nobel Peace Prize acceptance speech in Oslo, referred to scientific studies warning that the Arctic sea ice was ‘falling off a cliff’. He highlighted forthcoming model results that projected largely ice-free Arctic summers in ‘as little as seven years’. He repeated this warning two years later at the 2009 COP15 climate meeting in Copenhagen.

Gore’s claim was based on a study by researchers from the US Naval Postgraduate School, who used a regional model of the sea ice–ocean system in the Arctic, constrained using observational data for the 12-year period 1996–2007, and concluded that the Arctic would be nearly ice-free in summer by 2016 (plus or minus three years).

Prof. Bates seems blithely unaware that we thoroughly debunked this nonsense many moons ago. What Prof. Wieslaw Maslowski, one of those pesky “researchers from the US Naval Postgraduate School”, actually said in December 2007 was:

If we project this trend ongoing for the last 10–15 years, we probably will reach zero in summer some time mid next decade.

At the risk of repeating myself it seems I must once again:

Reiterate for the benefit of those who seem unable to understand either English or Mathematics that a “projection” is not the same thing as a “prediction”.

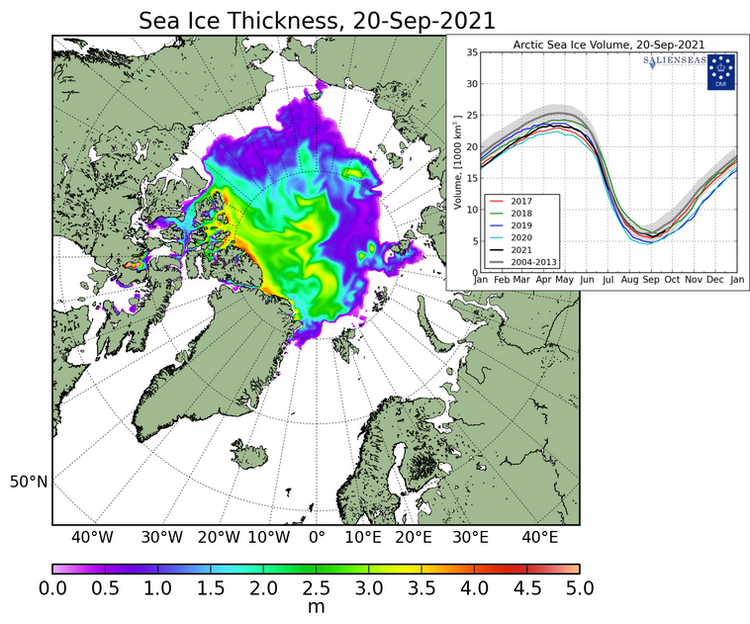
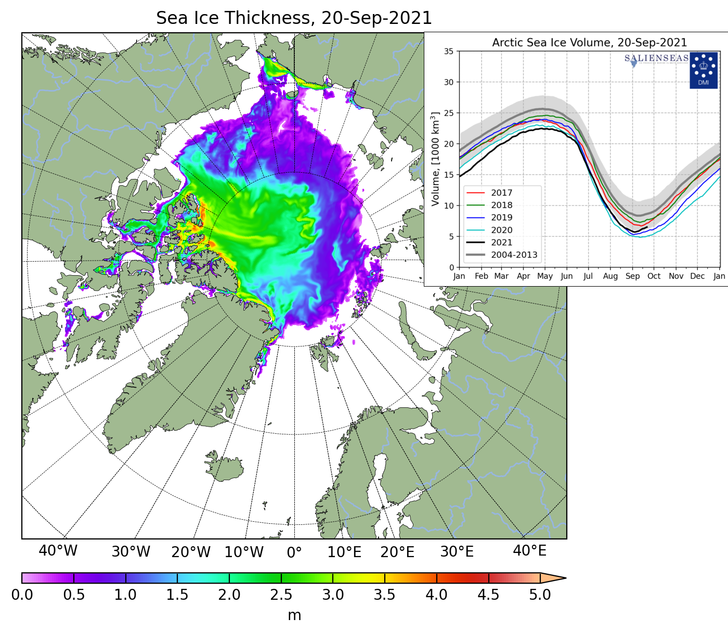
Ray then goes on to quibble with the NSIDC’s graph of September average Arctic sea ice extent:

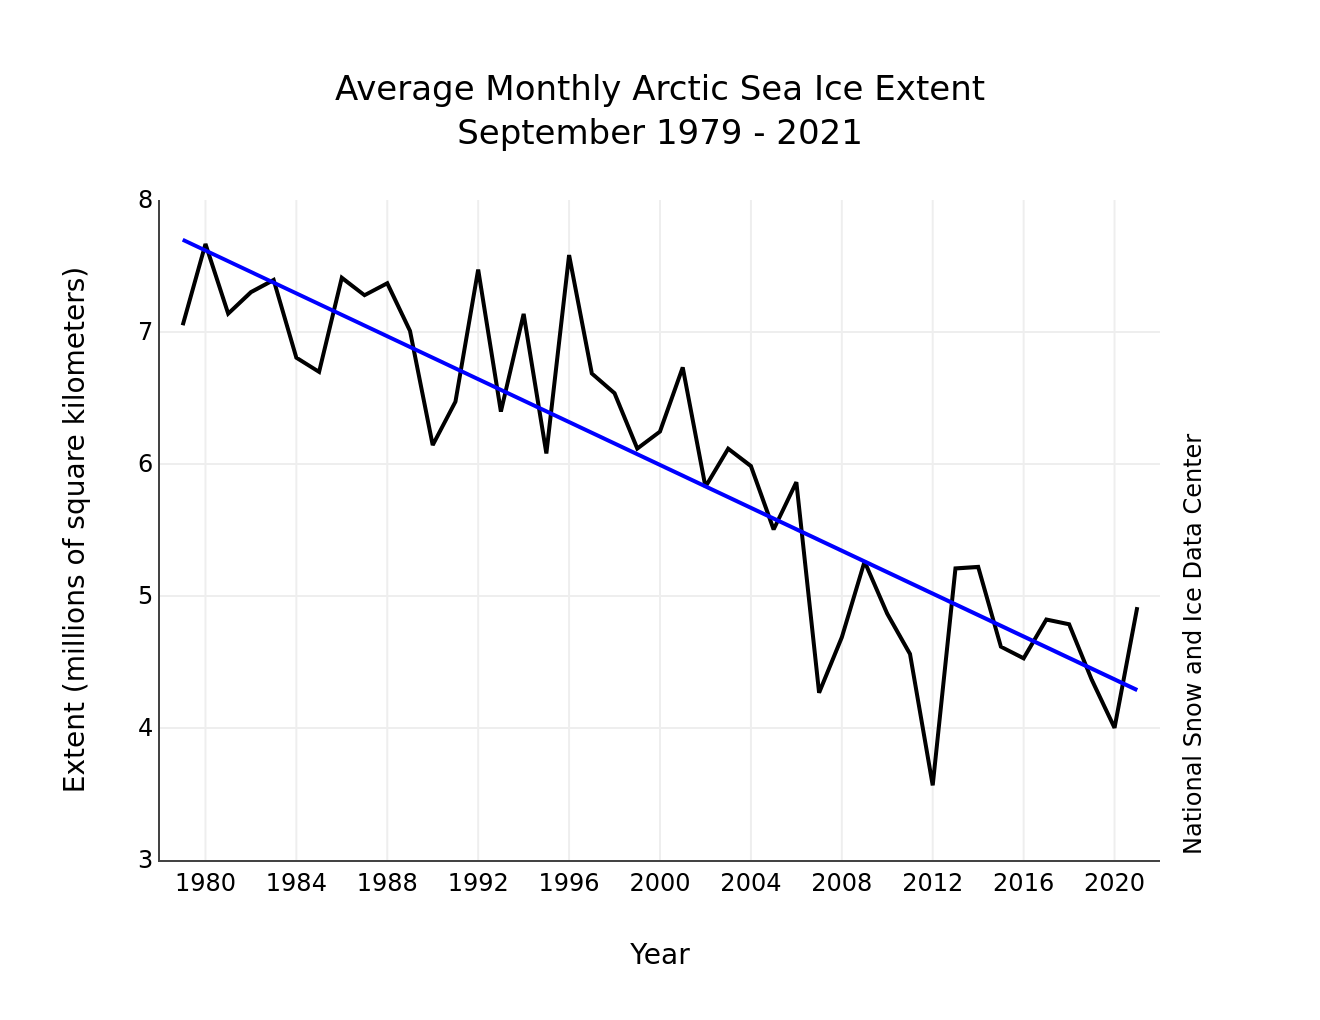
preferring instead a version of his own construction, which looks like this:

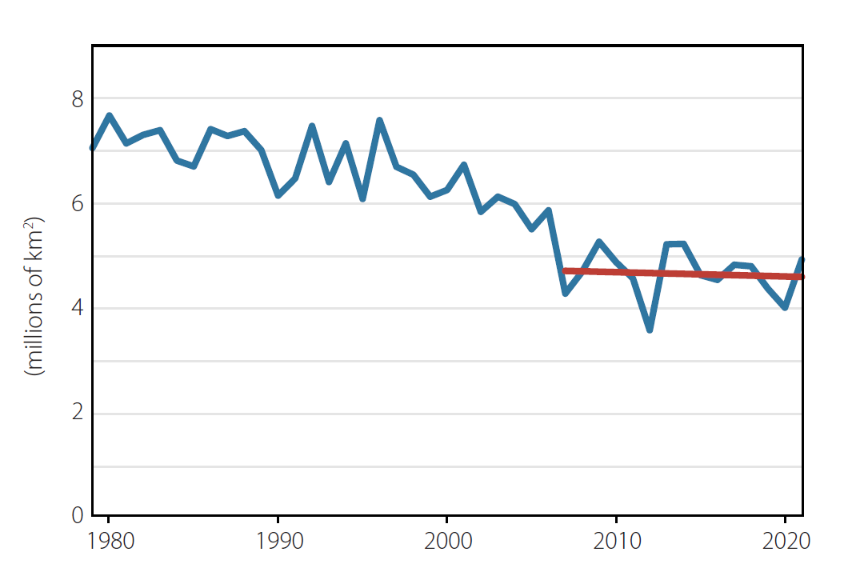
Ray then confidently asserts that:

The current slowdown in the rate of sea-ice loss was not expected, and the reasons for it are uncertain.

Sadly Ray’s exhaustive list of references fails to mention this learned journal article from 2011 by authors from the University of Washington and Los Alamos National Laboratory, which not only anticipated such a “slow transition” but also offered reasons for it:

Given the strong thickness–growth feedback of sea ice (Bitz and Roe 2004), where in a warming climate we can expect the thicker MY ice to thin at a greater rate than the thinner FY ice, and the fact that the ratio of MY to FY ice entering into the MY ice category each year is decreasing, it is likely that the difference between FY and MY ice survival ratios will decrease in a warming climate. If this occurs, the Arctic sea ice system would move toward a regime of decreased memory and decreased sensitivity to climate forcing…

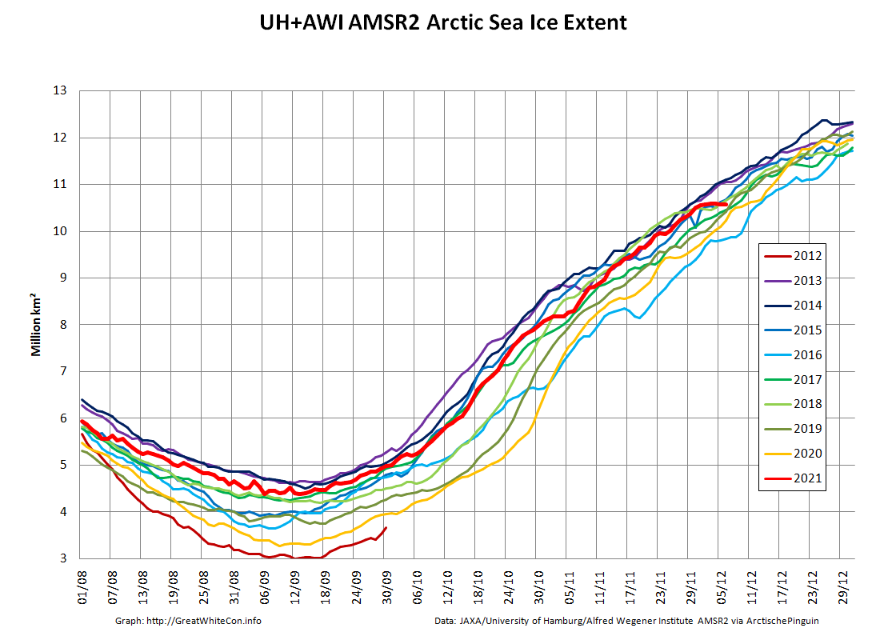
There is of course plenty more GWPF sea ice nonsense where that lot came from, but it’s already past my tea time (UTC) and so further debunking will have to wait a while. In the meantime here’s a wake up call for Professor J. Ray Bates:

[Edit – December 17th]

Moving further down section 2 Ray assures us that:

Any objective discussion of the recent Arctic sea-ice decline also requires that some consideration be given to the evidence regarding past natural variability on a multi-decadal timescale. In the pre-satellite era, reliable data on sea-ice coverage was sparse.

So far so good again? Not really! Ray’s gets on to his go to reference, Connolly, Connolly and Soon (2017):

By combining the temperature and partial sea-ice records, statistical reconstructions of the total sea-ice extent going back to the early 1900s can be created. Some of these reconstructions indicate that between the 1900s and 1940s, Arctic sea-ice extent comparable to the present reduced levels may have occurred.

Ray doesn’t sound very certain, which is perhaps because the paper in question blithely states that:

Because Arctic sea ice trends are closely correlated to Arctic temperature trends, they are often discussed in the context of global temperature trends.

Maybe so, but to the best of my recollection Connolly et al. never attempt to “prove” the asserted correlation. Here’s an alternative assessment of “Arctic sea-ice extent between the 1900s and 1940s“:
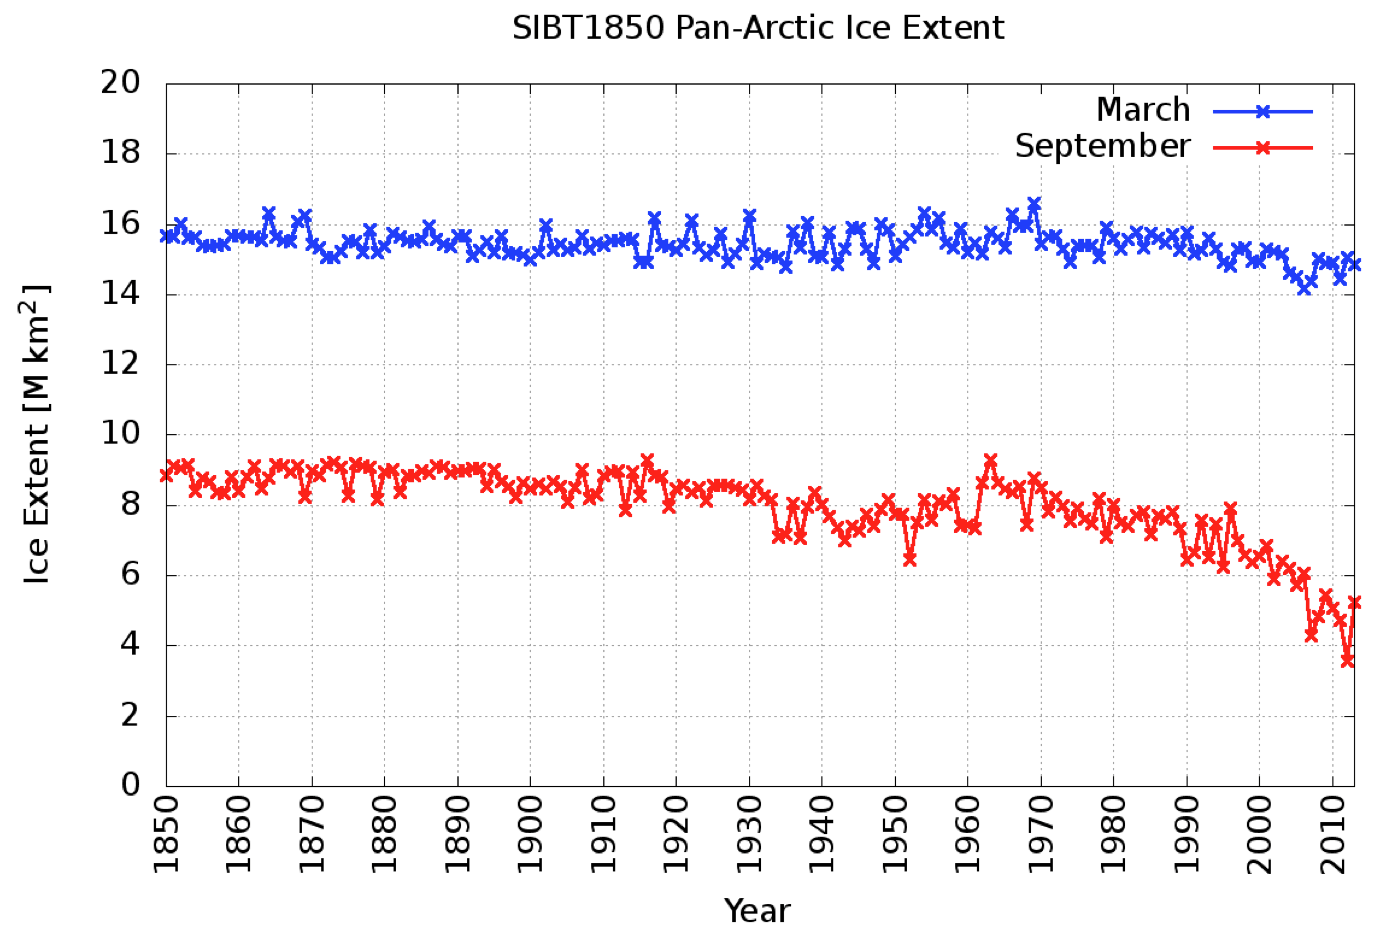
Watch this space!

Thwaites Ice Shelf “within years of failure”?

There have been a plethora of headlines in the last 24 hours along the lines outlined above!

According to an article on Science.org the answer to the question posed above seems to be “yes”:

An alarming crackup has begun at the foot of Antarctica’s vulnerable Thwaites Glacier, whose meltwater is already responsible for about 4% of global sea level rise. An ice sheet the size of Florida, Thwaites ends its slide into the ocean as a floating ledge of ice 45 kilometers wide. But now, this ice shelf, riven by newly detected fissures on its surface and underside, is likely to break apart in the next 5 years or so, scientists reported today at a meeting of the American Geophysical Union.

The most dramatic sign of impending failure is a set of diagonal fractures that nearly span the entire shelf. Last month, satellites spotted accelerating movement of ice along the fractures, says Erin Pettit, a glaciologist at Oregon State University, Corvallis, who is part of a multiyear expedition studying the glacier. The shelf is a bit like a windshield with a series of slowly opening cracks, she says. “You’re like, I should get a new windshield. And one day, bang—there are a million other cracks there.”

Here’s an image from the AGU abstract to illustrate the “cracks” Erin referred to:

Image: Christian Wild, Oregon State University

Once the ice shelf shatters, large sections of the glacier now restrained by it are likely to speed up, says Ted Scambos, a glaciologist at the University of Colorado, Boulder, and a leader of the Thwaites expedition. In a worst case, this part of Thwaites could triple in speed, increasing the glacier’s contribution to global sea level in the short term to 5%, Pettit says.

Here is the AGU press conference that caused all the excitement:


Sea Ice Data Tampering At DMI?

Not a lot of people know that our headline for today (apart from the terminating question mark) has been shamelessly plagiarised from Paul Homewood’s latest Arctic article. This will give you a flavour of Paul’s purple prose:

Electroverse have uncovered some blatant data tampering by DMI:

“It would appear that the Danish Meteorological Institute (DMI) may have taken a leaf out of NASA’s ‘data-fudging 101‘.

Sometime between late-Nov and early-Dec this year, the DMI’s Arctic Sea Ice Volume chart experienced a mysterious ‘vanishing’ of ice — this is revealed by a direct comparison of the Nov 18th and the Dec 8th charts below.”

I am able to corroborate their findings. In September I took this screenshot of DMI sea ice thickness. Note that the black line for this year was close to the 2018 line, and above 2017 for Sep 20th:

But the new version shows this year well below those two years:

There is no other way to describe this than blatant fraud. The changes do not appear to have been even documented, and the old data is not archived, being simply “replaced”. These should surely be very basic scientific requirements.

Neither does there appear to have been any public announcement by DMI about the fact or the justifications for what amounts to a significant change.

What this episode means is that DMI can no longer be trusted to produce honest, reliable data. It also raises the question of whether similar tampering has been carried out in previous years, without anybody being aware. After all, it is only by pure accident that it has been spotted this time.

Even fewer people know that my helpful explanatory comment is currently invisible to Paul’s band of merry (mostly) men:

Should anyone contrive to click on the invisible link this what they would see just below the DMI’s recent Tweet:

Quite predictably Tony Heller has also jumped on the self same bandwagon, claiming in an article entitled “Rapidly Disappearing Arctic Ice” that:

On December 4, DMI showed Arctic sea ice volume above the 2004-2013 average:

Quite predictably, the data disappeared for three days, and now that it has returned, DMI has massively reduced the amount of sea ice in the Arctic. Much of the thick ice off the coast of Siberia has disappeared:

Presumably their data tampering has freed the Russian ships trapped in the ice.

In normal circumstances I would of course point out the error of his ways to Tony via Twitter. However:

Here is the DMI’s explanation for the recent change in their Arctic sea ice thickness/volume visualisations, as shown on their “Polar Portal” web site:

New graphics December 7, 2021

We have improved the DMI operational ocean and sea-ice model HYCOM-CICE with higher horizontal resolution and updated HYCOM and CICE code. In particular, the sea ice code has been greatly improved with meltponds, sea-ice salinity, improved thermodynamics and much more. The freshwater discharge from Greenland has also been greatly improved using freshwater product from GEUS, which especially improves the coastal ocean currents and thus the ice transport nearshore Greenland. The model has been running continuously since September 1990. Therefore, we have by December 07, 2021 updated the graphics of sea-ice thickness and volume using the new and improved data on Polarportal and ocean.dmi.dk.

The improved model setup has led to higher variability as well as less abrupt melting during the melt season, which gives a shift of approximately half a month for the time of minimum ice volume. The trend between the years is almost unchanged. Thereby, a year with a large sea-ice volume in the old setup also has a large volume in the new setup, and similar for years with low sea-ice volume.

I always thought that “skeptical” folk didn’t much care for the output of “climate models” but I guess I must have been mistaken?

[Edit – December 13th]

Needless to say my comment at NALOPKT is still invisible this evening. However credit where credit is due. Tony Heller has at least not censored my comments on his blog. Earlier today Watts Up With That referred to both the Heller and Homewood DMIGate2 articles. Do you suppose the following helpful comment of mine will ever see the light of day at WUWT?

Watch this space for more #DMIGate2 news as and when we receive it!

Facts About the Arctic in December 2021

Christmas is coming. Santa’s secret summer swimming pool has frozen over. The time has come for a new monthly Arctic update.

The JAXA/ADS/ViSHOP web site is undergoing maintenance for a week, so let’s start the festive season with a look at high resolution AMSR2 area and extent:

After a brief hiatus in early November both metrics are once again tracking within, but near the upper bound of the last 10 years.

Next let’s take a look at the latest AWI CryoSat-2/SMOS thickness map:

together with the anomaly map from the Finnish Meteorological Institute:

Still thinner than usual in the so called “last ice area” north of Greenland and Ellesmere Island, and thicker than usual on the Siberian side of the Arctic, particularly in the Chukchi Sea.

Finally, for the moment at least, here’s the latest CryoSat-2/SMOS volume graph:

Unlike the previous metrics, this particular one is close to the middle of the pack.

[Edit – December 5th]

The National Snow and Ice Data Center issued their latest monthly Arctic Sea Ice News update earlier than usual this month:

Sea ice extent increased at a faster than average pace through November and by the end of the month, extent was just within the interdecile range. Extent was above average in the Bering Sea, but Hudson Bay remained unusually ice free through the month.

The November 2021 monthly average extent was 9.77 million square kilometers (3.77 million square miles), which ranked tenth lowest in the satellite record. The 2021 extent was 930,000 million square kilometers (359,000 million square miles) below the 1981 to 2010 long-term average. Extent was higher than average in the Bering Sea, but is extremely low in Hudson Bay.

Air temperatures at the 925 millibar level (about 2,500 feet above the surface) were well above average north of the Canadian Archipelago, by as much as 6 degrees Celsius. Conversely, temperatures over southwest Alaska and the eastern sector of the Bering Sea were as much as 6 degrees Celsius below average:

The sea level pressure pattern for November featured widespread low pressure over the Atlantic side of the Arctic and extending into the Barents and Kara Seas, paired with a moderately strong Beaufort Sea High. Strong low pressure over the Gulf of Alaska resulted in a circulation pattern in the eastern Bering Sea that brought cold air from the north. This pattern was favorable for sea ice growth, and can explain the above average ice extent in the region:

[Edit – December 7th]

Since the start of December high resolution AMSR2 extent has been flatlining:

Sea ice area has even declined slightly over the past few days:

Here too is an animation created by Uniquorn on the Arctic Sea Ice Forum using AWI ASMR2 data to reveal ice movement through the Nares Strait during December:

[Edit – December 9th]

The JAXA/ADS/ViSHOP web site is down again, so let’s take another look at high resolution AMSR2 area and extent:

It seems that the “brief hiatus” is over, and extent is now in a “statistical tie” with 2018/19 at 4th lowest for the date amongst recent year.

[Edit – December 13th]

The PIOMAS Arctic sea ice volume data for November 2021 has been released:

Average Arctic sea ice volume in November 2021 was 7,830 km3. This value is the 7th lowest on record for November,  about  1600 km3 above the  record set in 2016.   Monthly  ice volume was 61% below the maximum in 1979 and 45% below the mean value for 1979-2020. Average November 2021 ice volume was about one sigma above the 1979-2020 trend line. October saw relative rapid ice growth  for recent years bringing the mean ice thickness  (above 15 cm thickness) above the recent low values: 

The ice thickness anomaly map for November 2021 relative to 2011-2020 continues to show anomalies divided into positive and a negative halves with areas of positive anomalies increasing since the two prior months. Negative anomalies stretching from North of Greenland and along the Canadian Archipelago across the Eastern Arctic into the Barents Sea. Areas North of Greenland again feature very low ice thickness as in prior years (see our recent paper).  Positive anomalies are notable in the Beaufort and Chukchi seas due to advection of thicker older ice into the areas during the previous winter (See recent paper on this). The Alaskan summer has also been relatively cold contributing to unusually thick ice in this area:

CryoSat-2 ice thickness shows a similar picture sea ice thickness anomalies but with the maxima slightly displaced which maybe due to temporal sampling of the composite:

The JAXA web site is still down, so here’s another set of high resolution AMSR2 graphs:

[Edit – December 14th]

NOAA have just released their 2021 Arctic Report Card. Here’s the introductory video:

and here is the report itself:

[Edit – December 18th]

Ice hardened LNG tanker Vladimir Vize is about to enter the Vilkitsky Strait on the Northern Sea Route:

Meanwhile Science.org reports that “The Arctic is warming four times faster than the rest of the world“:

“Everybody knows [the Arctic] is a canary when it comes to climate change,” says Peter Jacobs, a climate scientist at NASA’s Goddard Space Flight Center, who presented the work on 13 December at a meeting of the American Geophysical Union. “Yet we’re misreporting it by a factor of two. Which is just bananas.”

Jacob’s co-authors include researchers who oversee several influential global temperature records, and they noted the faster Arctic warming as they prepared to release the global temperature average for 2020. NASA’s internal peer reviewer challenged the higher figure, suggesting the scientific literature didn’t support it. But the researchers have found the four times ratio holds in record sets from both NASA (3.9) and the United Kingdom’s Met Office (4.1), and they hope to soon include the Berkeley Earth record. (Their work also has company: In July, a team at the Finnish Meteorological Institute posted a preprint also arguing for the four times figure.)

The researchers found Arctic warming has been underestimated for a couple of reasons. One is climate scientists’ tendency to chop each hemisphere into thirds and label the area above 60°N as the “Arctic”—an area that would include, for example, most of Scandinavia. But the true definition of the Arctic is defined by Earth’s tilt. And, as has been known for centuries, the Arctic Circle is a line starting at 66.6°N. When researchers lump in the lower latitudes, “you’re diluting the amount of Arctic warming you’re getting,” Jacobs says. “That is not a trivial thing.”

The other difference is the choice of time periods over which the warming rate is calculated. Jacobs and his colleagues focused on the past 30 years, when a linear warming trend emerged for the Arctic. Analyses that look at longer term trends see less divergence between the Arctic and the world.

[Edit – December 23rd]

Here is the latest CryoSat-2/SMOS volume graph, now including some reanalysed data which seems to have come in slightly higher than the earlier “near real time” numbers:

Plus the AWI thickness map:

Further discussion of the divergence between volume and extent continues in the new New Year 2022 thread: