Yearly Archives: 2015

New Calving of the Zachariae Isstrom Glacier

The Zachariæ Isstrøm glacier in North East Greenland is in the news at the moment. Here’s a recent article from The Guardian for example, which states that:

A major glacier in Greenland that holds enough water to raise global sea levels by half a metre has begun to crumble into the North Atlantic Ocean, scientists say. The calving of the glacier into chunks of floating ice will set in train a rise in sea levels that will continue for decades to come, the US team warns.

“Even if we have some really cool years ahead, we think the glacier is now unstable,” said Jeremie Mouginot at the University of California, Irvine. “Now this has started, it will continue until it retreats to a ridge about 30km back which could stabilise it and perhaps slow that retreat down.”

Mouginot and his colleagues drew on 40 years of satellite data and aerial surveys to show that the enormous Zachariae Isstrom glacier began to recede three times faster from 2012, with its retreat speeding up by 125 metres per year every year until the most recent measurements in 2015.

The same records revealed that from 2002 to 2014 the area of the glacier’s floating shelf shrank by a massive 95%, according to a report in the journal Science. The glacier has now become detached from a stabilising sill and is losing ice at a rate of 4.5bn tonnes a year.

Eric Rignot, professor of Earth system science at the University of California, Irvine, said that the glacier was “being hit from above and below”, with rising air temperatures driving melting at the top of the glacier, and its underside being eroded away by ocean currents that are warmer now than in the past.

“The glacier is now breaking into bits and pieces and retreating into deeper ground,” he said. The rapid retreat is expected to continue for 20 to 30 more years, until the glacier reaches another natural ledge that slows it down.

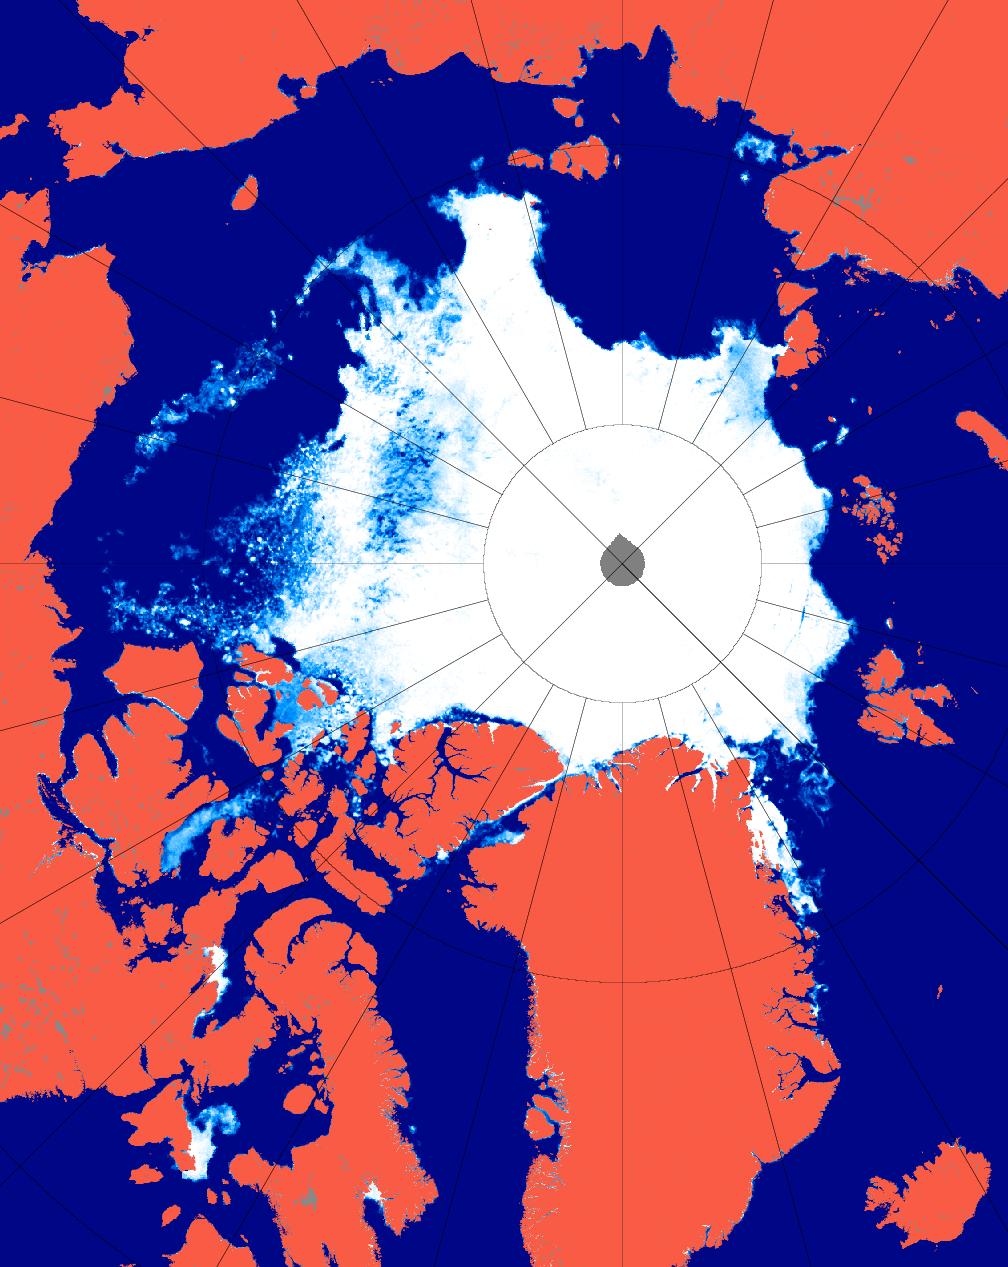
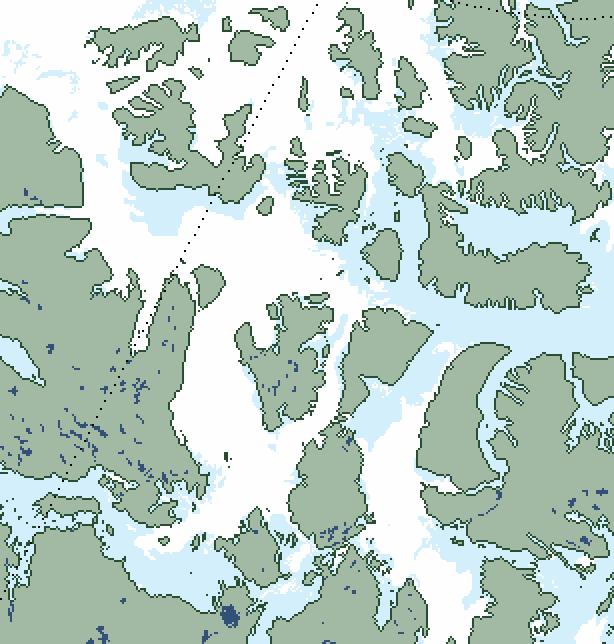
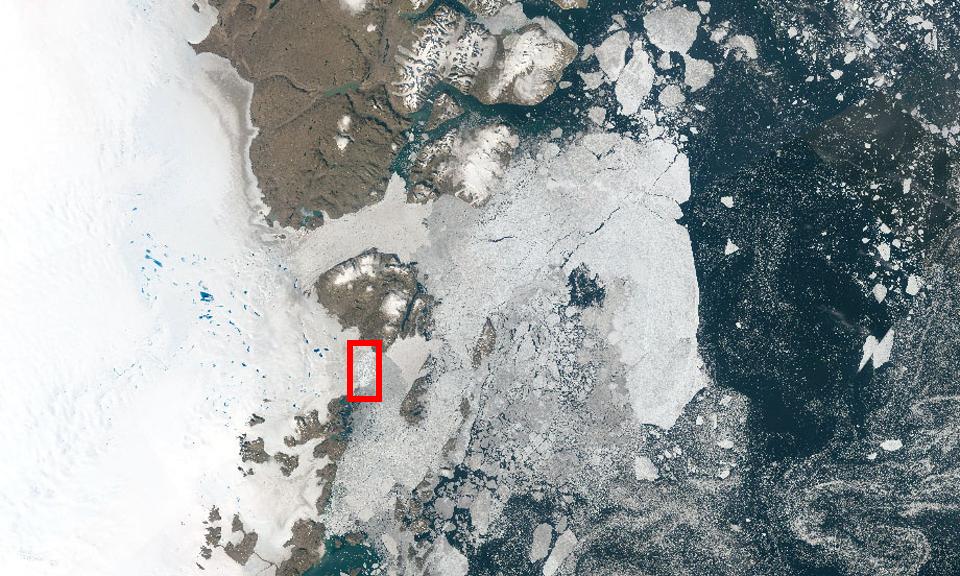
The Guardian article includes a picture of Zachariæ Isstrøm, along with much of the rest of North East Greenland. Here it is again, together with a helpful annotation revealing the location of the calving face of Zachariæ Isstrøm in amongst all the snow and ice:

zach-guardian

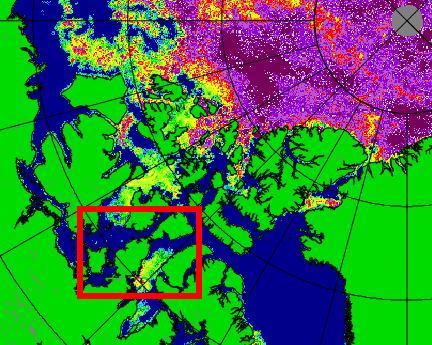
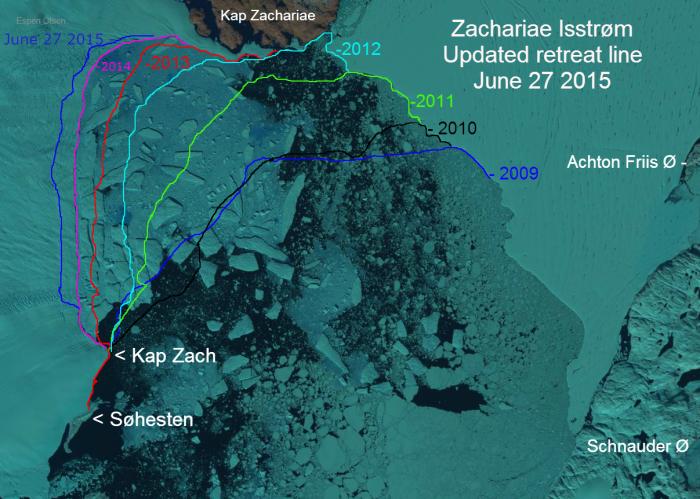
That’s still not really much help when it comes to visualising the “retreat speeding up by 125 metres per year”, so here’s a closer look at Zachariae Isstrom using an image prepared by Espen Olsen for the Arctic Sea Ice Forum, which is based on a Landsat 8 satellite image from September 2014:

Retreat of the calving face of the Zachariae Isstrøm glacier between 2009 and 2015

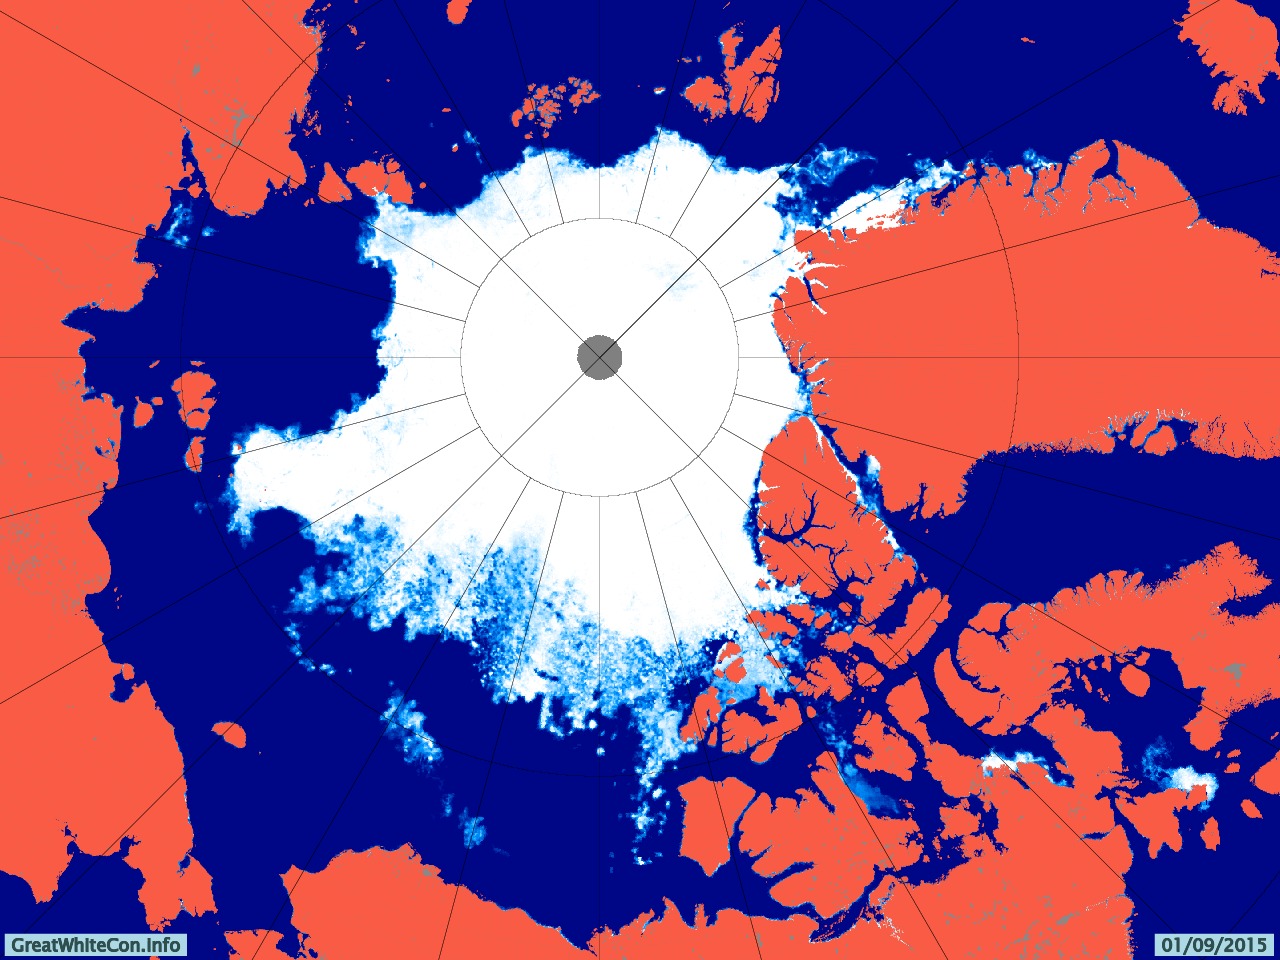
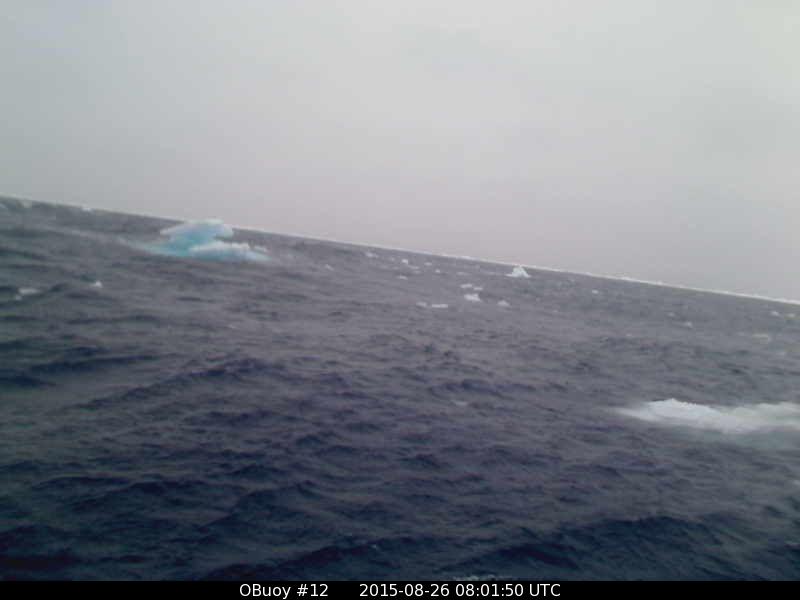
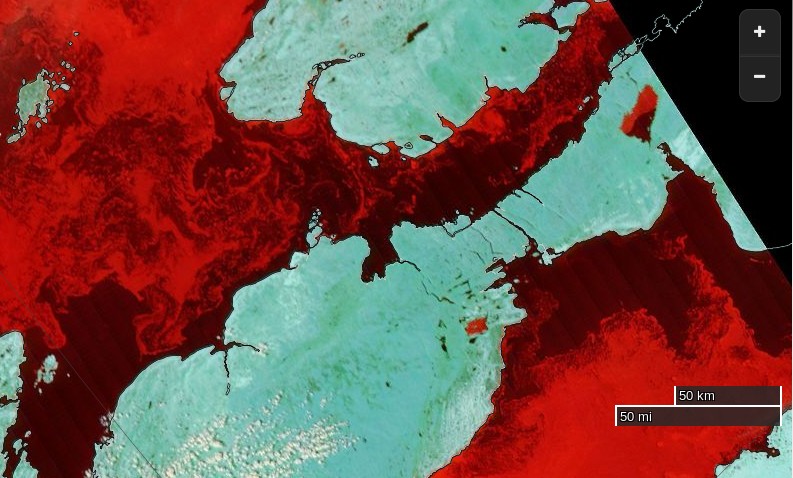
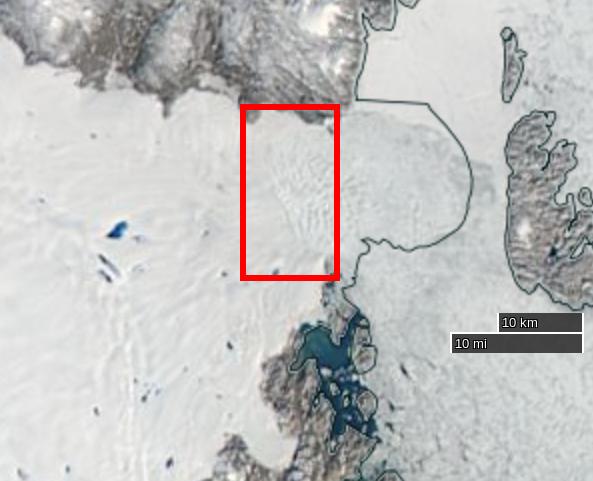
North East Greenland is in the dark at the moment, but if you want to take a closer look at recent changes to Zachariæ Isstrøm for yourself you can do so with the aid of NASA’s EOSDIS Worldview web site, which allows you to scroll through images from both the Aqua and Terra satellites. Here’s one from August 26th 2015:

NASA Worldview “true-color” image of the Zachariae Isstrøm glacier on August 26th 2015, derived from the MODIS sensor on the Aqua satellite

Our headline for today announces that yet another large chunk of ice has just detached itself from Zachariæ Isstrøm. You may wonder how we can be so sure of that when it’s dark in North East Greenland? That’s because yet another satellite can “see” in the dark, using synthetic aperture radar. Here’s an animation prepared earlier today by “Wipneus” using data from the European Space Agency’s Sentinel 1A satellite, once again for the Arctic Sea Ice Forum:

Animated comparison of Sentinel 1A visualisations of the Zachariae Isstrøm calving face on 4th and 16th November 2015

Can you spot “The new iceberg [that] seems to lie on its side”?

The conclusion to all this frantic activity, according to Mouginot, Rignot et al. at least, is that:

The Zachariæ Isstrøm / Nioghalvfjerdsfjorden sector is one of three major marine-based basins in Greenland along with the Jakobshavn Isbræ and Petermann–Humboldt glaciers, each holding a 0.6-m sea-level equivalent. Jakobshavn Isbræ started a rapid retreat (18 km in 2001-2015) following the collapse of its ice shelf and has undergone massive calving events since 2010. The central channel of the Petermann ice shelf lost 250 m of ice in 2002-2010, and the ice front retreated 33 km in 2010-2012. The Nioghalvfjerdsfjorden ice shelf will become vulnerable to break up in the near future if thinning continues. These observations combined suggest that all three major marine-based basins are undergoing significant changes at present. Jakobshavn Isbræ and Zachariæ Isstrøm have already transitioned to tidewater glacier regime, with increased calf-ice production and ice melting by the ocean. The retreat of these marine-based sectors is likely to increase sea-level rise from Greenland for decades to come.

The 2015 Arctic Sea Ice Minimum Extent

We’ve now entered the month of September, the month in which Arctic sea ice extent and area reach their annual minimum levels, historically at least. To set the scene, here’s the extent graph from the Japan Aerospace Exploration Agency (JAXA) for September 1st, based on data from the AMSR2 sensor on board their SHIZUKU satellite.:

IJIS-sep01

As you can see, the 2015 curve has just dropped below 2007 and is now at the second lowest level for the date in JAXA’s records. As the month progresses we’ll be taking a look at a variety of other metrics as they start to report their numbers for September.

To set the scene, here’s the University of Hamburg’s map of Arctic sea ice concentration for September 1st, again based on AMSR2 data:

Arc_20150901_res3.125

Here’s a video showing how that map has changed over the last two months:


Notice in particular the effect of the recent Arctic cyclone on the sea ice in the lower left quadrant. Note also our comment that:

[There is] a large potential fetch across the East Siberian, Chukchi and Beaufort Seas should any further cyclones occur in the area over the next few weeks. The conditions now exist for an even more damaging swell to be generated before the 2015 minimum Arctic sea ice extent is reached.

By now you may be wondering if we have a prediction to make? Well, we predict it still all depends on the weather! However here’s how the “probabilistic” 50 day ahead prediction from Andrew Slater of the NSIDC looks at the moment: SlaterExtent-20150831

If I were a betting man I’d say that the red line will ultimately put in a lower low than the dark blue one.

Finally, for the moment at least, take a look at the GFS surface level pressure forecast for later today, courtesy of MeteoCiel:

Can you see the 1000 hPa central pressure low spinning over the Laptev Sea? It’s currently not very deep, and it’s not over the East Siberian Sea either, but watch that space along with us as we wait to discover where and when the assorted Arctic sea ice metrics reach their minima for 2015.

[Edit – September 3rd 2015]

The latest edition of the US National Snow and Ice Data Center’s Arctic Sea Ice News has just been published. In the section on the imminent minimum they show this graph:

and say that:

Starting with the ice extent observed on August 31 and then applying 2006 loss rates, the slowest rate in recent years, results in the highest extrapolated minimum for 2015 of 4.50 million square kilometers (1.74 million square miles), and a September monthly average extent of 4.59 million square kilometers (1.77 million square miles). The lowest daily minimum comes from using the 2010 pace, yielding an estimated 4.12 million square kilometers (1.67 million square miles) for the daily minimum, and a September monthly average extent of 4.33 million square kilometers (1.67 million square miles).

Using an average rate of ice loss from the most recent ten years gives a one-day minimum extent of 4.38 ± 0.11 million square kilometers (1.79 million square miles), and a September monthly average of 4.49 ± 0.09. As of August 31, the 5-day running daily average extent is 4.72 million square kilometers. If no further retreat occurred, 2015 would already be the sixth lowest daily ice extent in the satellite record.

The forecast places the upcoming daily sea ice minimum between third and fourth lowest, with fourth more likely. There is still a possibility that 2015 extent will be lower than 4.3 million square kilometers, the third lowest sea ice extent, surpassing the 2011 sea ice extent minimum, and a small chance of surpassing 2007, resulting in the second-lowest daily minimum. This assumes that we continue to have sea ice loss rates at least as fast as those of 2010. This was indeed the case for the final ten days of August 2015.

Somewhere between 2nd and 6th then! We felt compelled to enquire on Twitter:

Barrow Battered By Big Waves

The first big waves of 2015 have been battering the town of Barrow, Alaska today and they’ve already broken through the coastal defences. Firstly take a look at the view from the Barrow webcam during a less damaging storm on September 4th last year:

BarrowCam_20140904_0834

Now take a look at the view from the same camera earlier today, and play “spot the difference” with me:

BarrowCam_20150827_1749

The cause of the flooding that is all too visible is a cyclone that’s been whirling around in the Chukchi Sea for a while, and here is a WaveWatch III “hindcast” of what the resultant winds have created in the way of waves. Firstly the “significant wave height”:

alaska_height_20150827_015h

and now the “peak period”:

alaska_period_20150827_015h

which reveal a swell 4 to 5 metres high with a period of 10 seconds heading directly towards Barrow Beach. According to the Alaska Dispatch News:

Huge, wind-whipped waves crashed onto the shore at Barrow on Thursday, forcing the closure of a nearby road. Westerly winds were gusting up to 50 miles an hour, pushing waves up to the top of the beach and causing some erosion, the National Weather Service said.

The service has issued a coastal flood warning for Barrow until Friday morning, along with a high surf advisory for the western part of the North Slope and a gale warning for much of the Beaufort and Chukchi Seas.

The big surf and flooding, which has covered a road that runs between the ocean and Barrow’s lagoon, is “not terribly unusual” at this time of the year, said Ryan Metzger, a National Weather Service meteorologist in Fairbanks. Fall is a stormy season, and the timing — right around the annual minimum sea ice extent — allows the surf to build and reach shore.

Photograph by Brittni Driver via Alaska Dispatch News

Just in case it’s not obvious from all the pictures, the respective advisory messages point out that:

A COASTAL FLOOD WARNING MEANS THAT RISING SEA WATER THAT CAUSES FLOODING IS EXPECTED. COASTAL RESIDENTS IN THE WARNED AREA SHOULD BE ALERT FOR RISING WATER…AND TAKE ACTIONS TO PROTECT LIFE AND PROPERTY.

A HIGH SURF ADVISORY MEANS THAT LOCALIZED BEACH EROSION IS EXPECTED. PRECAUTIONS SHOULD BE TAKEN TO PROTECT PROPERTY.

If you’re now wondering what might happen to other areas of the north coast of Alaska in similar circumstances, but with no bulldozer in attendance, here’s an example from Cape Halkett:

According to to the United States’ Climate Resilience Toolkit:

Thawing permafrost causes coastline collapse on Alaska’s North Slope, which is no longer kept frozen and protected from fall storms by sea ice—the ice now forms later in the season.

Away from the coast swell from the same cyclone has also been affecting the sea ice north of Barrow, and here’s what a webcam bobbing about on a buoy north of the Chukchi Sea showed as the winds started to build yesterday:

O-Buoy 12 image from August 26th 2015

O-Buoy 12 has now tipped over and then ceased transmitting. This is the last picture received, in the early hours of August 27th when the wind speed had reached 13 m/s and the buoy had been moving at over 5 m/s:

OBuoy12-20150827-1

Once upon a time O-Buoy 12 was sat on the same ice floe as ice mass balance buoy 2014G, which has also been free floating for a while. Here’s what it reveals about the temperature of the sea water on August 26th 2015 at 77.56 N, 163.86 W:

2015-08-26_2014G

Somewhere in the vicinity of -0.7 °C.

[Edit on 30/08/2015]

O-Buoy 12 has made no further transmissions, and therefore seems to have succumbed to the storm. In addition IMB buoys 2014F and 2013F stopped transmitting on the 26th and 27th of August respectively. Ice mass balance buoy 2014G has survived however, and reports two successive record daily distances travelled:

2015-08-29-2014G-Map

25.6 km on August 26th, followed by 36.3 km on the 27th. After a brief dip during the cyclone water temperature is still around -0.7 °C.

Presumably as a result of the cyclone JAXA Arctic sea ice extent has taken a tumble over the last few days. It has stabilised this morning slightly above 2007 levels:

JAXA-aug29

Here is the current AMSR2 Arctic sea ice concentration map from the University of Hamburg, revealing a large potential fetch across the East Siberian, Chukchi and Beaufort Seas should any further cyclones occur in the area over the next few weeks:

AMSR2 Arctic sea ice concentration on August 29th from the University of Hamburg

Hence the conditions now exist for an even more damaging swell to be generated before the 2015 minimum Arctic sea ice extent is reached.

Is the Northwest Passage Open Yet?

People keep on posing that question just at the moment. Here’s a typical example from the Arctic Sea Ice Blog this morning:

Albeit not ‘officially’ declared as such, the daily Uni-Bremen chart shows Amundsen’s route is cleared and free now.

Here’s an extract from the “Daily Uni-Bremen chart” referred to, with an apparently “ice free” section of the southern route through the Northwest Passage highlighted:

asi-AMSR2-n6250-20150813-hilite

As we’ve been discussing here recently, the automated passive microwave based satellite Arctic sea ice concentration products can miss ice that’s visible to the naked human eye. Here’s some pictures from the Great White Con Northwest Passage page:

NASA Worldview “false-color” image of the Northwest Passage on August 13th 2015, derived from bands 7, 2 and 1 of the MODIS sensor on the Terra satellite

The Canadian Ice Service sea ice concentration chart for the Queen Maud Gulf on August 13th 2015

Here’s an extract from the NSIDC’s Multisensor Analyzed Sea Ice Extent (MASIE) product (currently for August 12th 2015):

masie_all_r00_v01_2015224_crop

and here’s an extract from an answer I gave to a similar question on the Arctic Sea Ice Forum earlier this morning:

The Canadian Ice Service still have 4-6/10 ice within a whisker of the coast. Would you fancy your chances in amongst that and a bit of a breeze?

The CIS definition of “navigable” is “a criteria of less than 60% ice cover over all sections of the Northwest Passage”. See:

http://ec.gc.ca/glaces-ice/default.asp?lang=En&n=765F63E4-1

and the inset map at:

CIS-NWP-MinConc-2014

The answer to the question posed in the title to this article is therefore currently NO, the Northwest Passage is not open yet, both officially from the CIS and unofficially from any mariner with a sense of self preservation in charge of any vessel that isn’t “ice hardened”. In all the circumstances that answer might change quite quickly though!

[Edit 18/09/15]

The Canadian Ice Service have finally published a close up map of the Parry Channel that doesn’t say “No Analysis”. Here it is:

CIS_Parry_20150917-Crop

There’s still a (narrow!) green path into McClure Strait, so I reckon we can at long last confidently declare the main Northwest Passage to be OPEN!

Arctic Sea Ice Approaching Normal?

According to “Steve Goddard” it is! Hot off the presses over at “Real Science” we are told that:

DMI hasn’t updated their 30% concentration map for 10 days, but their 15% concentration map is just about at the 1979-2000 mean.

DMI-15-icecover_20150809

Ocean and Ice Services | Danmarks Meteorologiske Institut

The melt season has essentially stopped, with very cold air across the Beaufort Sea

[Image redacted – It shows Canada and one corner of the Beaufort Sea]

The usual criminals in the press (Guardian, New York Times, etc.) and government agencies will of course not mention this, because reality and science wrecks their agenda.

unRealScience-Gore-20150810

Gore: Polar ice cap may disappear by summer 2014

I have to admit Steve’s confusing language confused me briefly. The Arctic sea ice concentration and ice type maps from the OSISAF on which the Danish Meteorological Institute base their extent graphs have been updating normally, but I eventually discovered what “Steve”/Tony was on about. On close inspection although the date at the bottom has been updating the 2015 curve on DMI’s 30% threshold Arctic sea ice extent graph currently seems to be stuck on August 2nd:

DMI-30-icecover_20150810

I’ve informed DMI of the problem, but when it might be fixed remains to be seen, since as the DMI web site puts it:

The old plot can still be viewed here for a while.

and as I was just informed they don’t have any resources allocated to keep the “deprecated” 30% service running.

Meanwhile back in real world in the Arctic, DMI temperatures north of 80 degrees are above “normal”:

DMI-meanT_20150810

GFS temperature anomalies look like this:

CCI-T2-Anomaly-20150811

and JAXA 15% threshold Arctic sea ice extent has been dropping at nearly 100,000 km² per day for the last few days:

vishop_extent_20150810

Mail Makes 1000% Arctic Mistake

We officially complained last week about some egregious errors in a “Daily Mail Comment“. In particular:

The northern ice-cap… is NOT bigger than at any time for decades.

In an official response we were told:

I therefore cannot see that Clause 1(ii) of the Editors’ Code has been breached in any way.

For those of you unfamiliar with the Independent Press Standards Organisation’s Editors’ Code of Practice here are Clauses 1(i-ii)

i) The Press must take care not to publish inaccurate, misleading or distorted information, including pictures.

ii) A significant inaccuracy, misleading statement or distortion once recognised must be corrected, promptly and with due prominence, and – where appropriate – an apology published. In cases involving the Regulator, prominence should be agreed with the Regulator in advance.

Without telling us,  or as far as I can tell any of their other readers apart from one other complainant, the Daily Mail have changed the wording of the online version of the editorial comment in question. Can you spot the difference? We’ve given you some help!

Online version of the Daily Mail's "Climate change and an inconvenient truth" editorial comment captured on July 24th 2015
Online version of the Daily Mail’s “Climate change and an inconvenient truth” editorial comment captured on July 24th 2015

The Daily Mail evidently have trouble doing basic mathematics, so it seems necessary to point out that one decade is ten years. That is a factor of ten. Using the Mail’s preferred units that makes this a 1000% mistake!

More from us on a variety of other Mail mathematical mistakes shortly. At this juncture however, we cannot help but wonder whether IPSO considers that taking no action whatsoever to rectify a print article that contains an admitted error of at least 1000% satisfies Clause 1(ii) of their Editors’ Code? Here’s clause 2:

A fair opportunity for reply to inaccuracies must be given when reasonably called for.

We hereby call on the Daily Mail to provide us with a fair opportunity to reply to this egregious inaccuracy and a number of others in the same article.

An Open Letter to the Reader’s Editor of the Daily Mail

Thank you for your prompt reply, and my apologies for my slightly sluggish one. As you can tell from my details below I have a “day job” to attend to, and if you’ve clicked the links I sent in my original complaint you’ll realise I’ve also been very busy following up on some other allegedly inaccurate articles in the Daily Mail and a number of other Great British newspapers. See for example:

https://greatWhiteCon.info/2015/07/professor-peter-wadhams-complaint-to-ipso/

Gettting back to this complaint, I have just posted my initial reply online here:

https://greatWhiteCon.info/2015/07/mail-makes-1000-arctic-mistake/

Reiterating the main point:

We hereby call on the Daily Mail to provide us with a fair opportunity to reply to this egregious inaccuracy and a number of others in the same article.

Despite your “I therefore cannot see that Clause 1(ii) of the Editors’ Code has been breached in any way.” below, and apart from your admittedly at least 1000% timescale error, the Guardian article linked to highlights a number of other gross inaccuracies in last week’s “Daily Mail Comment” concerning Arctic sea ice volume. I fail to see how “Putting the Arctic sea ice volume record straight” for the unfortunate readers of that editorial can be achieved without prominently displaying to your print readers the Arctic sea ice volume graph extracted from Rachel Tilling’s recent academic paper:

Tilling-2015-Volume

and in addition showing your online readers the “Arctic ice cube” video together with a link to it in print.

I shall have much more to say to you on that topic in the near future but I’m theoretically “on holiday” for a week from tomorrow, so it may well not arrive in your inbox until after my return.

Best wishes,

Jim Hunt

Arctic Sea Ice Volume for Dummies

Dana Nuccitelli has just published an article in the Guardian entitled:

The Daily Mail and Telegraph get it wrong on Arctic sea ice, again

Not only does Dana kindly link to our recent efforts to educate the Daily Mail’s leader writer about the Arctic facts of life. He also does a much better job of explaining the issues than a previous Guardian article about Arctic sea ice volume which we were recently somewhat critical of. This therefore seems like the perfect time to provide an “Arctic Sea Ice Volume 101” lesson for Daily Mail leader writers and their wholly independent “legal eagles”.

Let’s take things one small step at a time shall we. The Daily Mail leader last week starts by saying:

In a major report last year, the Intergovernmental Panel on Climate Change gave a grave assessment of how man-made global warming was rapidly destroying the Arctic ice cap.

Steadily increasing temperatures had made the pack ice contract by up to 12 per cent between 1979 and 2012, leading to rising sea levels which threatened to swamp coastal regions – not to mention endangering stranded polar bears.

By the middle of the century ‘a nearly ice-free Arctic Ocean’ was likely for a large part of the year, the report predicted.

The Mail’s leader writer isn’t very specific about which of the numerous IPCC reports they are referring to , but the Mail’s legal eagle tells us that:

This item was written on the basis of… the 2014 synthesis report by the Intergovernmental Panel on Climate Change – arguably the definitive authority on the subject.

This is a quote from that IPCC report (p4 notes). ‘The annual mean Arctic sea-ice extent decreased over the period 1979 to 2012, with a rate that was very likely in the range 3.5 to 4.1% per decade.’

Given that there are over three decades between 1979 and 2012, the shrinkage of the ice-cap couldn’t have been more than 12 per cent.

This is the first of many “misunderstandings” in the Daily Mail’s leader and their legal eagles response. Here is an extract from Section B.3 “Cryosphere” on page 9 of the IPCC AR5 Working Group 1 Summary for Policy Makers:

The annual mean Arctic sea ice extent decreased over the period 1979 to 2012 with a rate that was very likely in the range 3.5 to 4.1% per decade (range of 0.45 to 0.51 million km2 per decade), and very likely in the range 9.4 to 13.6% per decade (range of 0.73 to 1.07 million km2 per decade) for the summer sea ice minimum (perennial sea ice).

As you can see, the Mail’s “definitive authority on the subject” subject says that  “for the summer sea ice minimum” Arctic sea ice extent in fact decreased by more like 12% per DECADE.

Moving on the next paragraph in the Daily Mail’s leader, we are told that:

How interesting then, that the latest analysis of 88million measurements from the European Space Agency’s Cryosat satellite show the northern ice-cap INCREASED by a staggering 41 per cent in 2013 and, despite a modest shortage last year, is bigger than at any time for decades.

whilst the Mail’s legal eagle explains to us that:

This item was written on the basis of a UCL report that formed this story: http://www.dailymail.co.uk/sciencetech/article-3168504/Arctic-sea-ice-boosted-cool-summer-2013-study-reveals.html

That story states that:

Researchers used 88 million measurements of sea ice thickness recorded by the European Space Agency’s CryoSat-2 mission between 2010 and 2014.

The results showed that there was a 14 per cent reduction in the volume of summertime Arctic sea ice between 2010 and 2012 – but the volume of ice jumped by 41 per cent in 2013, relative to the previous year, when the summer was five per cent cooler than the previous year.

Notice that in this article the author is talking about “summertime Arctic sea ice volume” and not “mean Arctic sea ice extent”. Let’s see if instead of trying to compare apples with oranges like the Mail’s leader writer we can in fact compare like with like shall we?

Firstly let us recall (if we can) from our school days that Volume = Area x Thickness. Next returning to the IPCC AR5 WG1 report we need to turn to the technical summary of their full report where in the TS.2.5.3 “Sea Ice” section on page 40 we can read that:

There is high confidence that the average winter sea ice thickness within the Arctic Basin decreased between 1980 and 2008. The average decrease was likely between 1.3 m and 2.3 m. High confidence in this assessment is based on observations from multiple sources: submarine, electromagnetic probes and satellite altimetry; and is consistent
with the decline in multi-year and perennial ice extent.

Now unfortunately for our purposes this decline in thickness is not expressed as a percentage and is in winter rather than summer. Nevertheless it should be readily apparent to all and sundry by now that the thickness of Arctic sea ice has been declining at the same time as its extensiveness. Moving on to page 136 in section 1.3.4.3 “Ice” of the full IPCC WG1 report we find:

There has been a trend of decreasing Northern Hemisphere sea ice extent since 1978, with the summer of 2012 being the lowest in recorded history (see Section 4.2 for details). The 2012 minimum sea ice extent was 49% below the 1979 to 2000 average and 18% below the previous record from 2007. The amount of multi-year sea ice has been reduced, i.e., the sea ice has been thinning and thus the ice volume is reduced.

Following the IPCC’s instructions let’s now move on to page of section 4.2.2.4 “Arctic Sea Ice Thickness and Volume”, where we read that:

For the Arctic, there are several techniques available for estimating the thickness distribution of sea ice. Combined data sets of draft and thickness from submarine sonars, satellite altimetry and airborne electromagnetic sensing provide broadly consistent and strong evidence of decrease in Arctic sea ice thickness in recent years.

That’s followed by many paragraphs of learned discussion, but still no statement of Arctic wide volume decline in percentage terms to keep the Mail’s legal eagle happy.

Professor Peter Wadhams’ Complaint to IPSO

Professor Peter Wadhams of Cambridge University has just written to the UK’s Independent Press Standards Organisation about recent articles that “ha[ve] substantially damaged my reputation for scientific integrity, and I believe that this was the deliberate intention”. Here is the text of his complaint.

The writer of this article, Ben Webster, phoned me up cold in my office at Cambridge University on Thursday 23 July, saying that he was writing a piece on the retreat of sea ice in the Arctic, and whether it was increasing or not. We discussed the scientific data, then he asked who else was working in this field in the UK, in order to contact them. I mentioned that there are not many others in this field, since three of the leading figures died within a short space of time in accidents in 2013. He asked for further details.

I asked that this be completely off the record because of (a) the sensibilities of relatives of the deceased (Prof Laxon’s partner was particularly upset by the subsequent publication),
(b) my own scientific reputation (I did not want to be made out to be a crazy person),
(c) the fact that these deaths were investigated and were very clearly simply an extraordinary coincidence.

He raised the question of whether they were murdered. I agreed that for a short time I thought that they were, since I had had the experience of being run off the road at the same time by a lorry, but that it was very clear afterwards that the three deaths were individually explainable accidents.

I did not make any of the statements enclosed in quotation marks by the reporter. Webster promised that this was in confidence and that if he wanted to use it he would contact me first. The next thing I saw was the article plastered over Saturday’s “Times”. He had clearly done some research in procuring photographs, but did not bother to contact me, and broke his promise of confidentiality.

The publication, subsequently picked up by the Sunday Telegraph and Mail on Sunday, has substantially damaged my reputation for scientific integrity, and I believe that this was the deliberate intention.

Here are our edited highlights of the story so far:

Inside the BBC’s Arctic Sea Ice Science

I’m sure we’ll get stuck into to some real science eventually, but for the moment we’re still taking a long, hard look at mainstream media coverage of the latest learned journal article on Arctic sea ice to be misinterpreted by the media. Compared to some others one might mention the report on the BBC web site about the new CPOM paper in Nature Geoscience entitled “Increased Arctic sea ice volume after anomalously low melting in 2013” was relatively accurate. Entitled “Arctic ice ‘grew by a third’ after cool summer in 2013“, it said that:

Researchers say the growth continued in 2014 and more than compensated for losses recorded in the three previous years.

The scientists involved believe changes in summer temperatures have greater impacts on ice than thought.

But they say 2013 was a one-off and that climate change will continue to shrink the ice in the decades ahead.

The Arctic region has warmed more than most other parts of the planet over the past 30 years.

Satellite observations have documented a decrease of around 40% in the extent of sea ice cover in the Arctic since 1980.

and

The researchers used 88 million measurements of sea ice thickness from Cryosat and found that between 2010 and 2012, the volume of sea ice went down by 14%.

They published their initial findings at the end of 2013 – but have now refined and updated them to include data from 2014 as well.

Relative to the average of the period between 2010 and 2012, the scientists found that there was a 33% increase in sea ice volume in 2013, while in 2014 there was still a quarter more sea ice than there was between 2010 and 2012.

At this juncture one is forced to ask oneself the question that if there was 33% more sea ice in 2013 than there was between 2010 and 2012, but only 25% more in 2014 how it was possible that “the growth continued in 2014”?

Desperately hoping that the BBC might be able to explain this conundrum to us we avidly listened to Adam Rutherford’s interview with Rachel Tilling, the lead author of the paper in question, on BBC Radio 4’s “Inside Science” programme last night. We were also hoping that at long last there might be some quantification of what’s happened to the VOLUME of “sea ice cover in the Arctic since 1980”. Sadly all our hopes were dashed, and Adam never posed the vital questions.

You can download a recording of the broadcast from the link above. Adam’s interview with Rachel starts at 7:00 minutes. He begins by talking about:

The publication in Nature Geoscience this week of a new paper that shows that in 2013, which was a slightly cooler summer than average, Arctic ice had grown, not just a tad, but by a WHOPPING 41% on the previous year!

Rachel Tilling then begins by saying:

The thickness and the volume are actually the most important measurements we can get, because the area’s been really, really useful in giving us an overview of how the Arctic is changing, but it only really gives us half the picture.

Here’s the full picture, taken from our Arctic Sea Ice Graphs page. Since CryoSat-2 measurements only go back as far as 2010, this graph shows Arctic sea ice volume calculated by the PIOMAS model developed by the Polar Science Center at the University of Washington:

piomas-trnd2-201506Is that WHOPPING increase in Arctic sea ice volume from 2012 to 2013 clear to you now? At 11:00 minutes into the programme Adam says:

You can see how this is going to be interpreted. You know, with 30 years of Arctic sea ice shrinking, and then suddenly it gets bigger, you’re still OK with climate change being a real thing, and global warming being a real thing?

I can see that very clearly Adam, thanks for asking, and YES is the answer to your final question. It still wasn’t clear to me whether that would be clear to Adam’s listeners however, so I posed a pertinent question on Twitter first of all:

That didn’t elicit any response, so then I tried following Adam’s instructions at the end of the interview to:

 Do let us know what you think – [email protected]

This is what I thought:

Hello Adam,

Further to your recent interview with Rachel Tilling, and your joint Twitter conversation with my alter ego “Snow White”, I’d like to reiterate how disappointed the two of us are that during your conversation with Rachel there was no mention of “41% of nothing”. Twitter speak for “Doesn’t anybody at the BBC have the faintest idea what Arctic sea ice volume was 30 years ago, in April and in October?”

By way of additional context see e.g.

https://greatWhiteCon.info/2015/07/an-inconvenient-truth-about-the-mails-climate-coverage/

http://www.carbonbrief.org/blog/2015/07/cool-arctic-summer-brought-brief-recovery-in-2013-sea-ice-loss/

https://greatWhiteCon.info/resources/

Yours in dismay,

Jim Hunt

and this is the response I got from BBC Inside Science:

Dear Sir or Madam

Thank you very much for your email. While all emails are read – and we appreciate input from listeners – we cannot reply to each one individually. There are simply too many!

For more information about Inside Science, please go to our webpage:

Inside Science, Radio 4
http://www.bbc.co.uk/programmes/b036f7w2

For individual programmes, click on ‘Episodes’.
http://www.bbc.co.uk/programmes/b036f7w2/episodes/guide

Once you have located a particular programme page, you will see a link to ‘Listen now’- on the picture of Dr. Adam Rutherford.
‘Related Links’ are found further down on the right hand side of the page.

Downloads/Podcasts of Inside Science are available at:
http://www.bbc.co.uk/podcasts/series/inscience

Thanks again and do keep sending your comments in – listener feedback helps us make better programmes for you.

Yours sincerely

Inside Science, Radio 4


Meanwhile, over on Twitter: