Tag Archives: Volume

December 2016 Arctic Report Card

This is the Great White Con version as opposed to the NOAA version published during the Fall AGU conference earlier this week, although there is some overlap.

Hot off the presses, here’s how Arctic sea ice age has progressed over the last year and a bit:

The 4 and 5 year old ice looks to be edging away from the area north of the Canadian Arctic Archipelago towards the Fram Strait. Here’s the current CryoSat-2 Arctic sea ice thickness map:

cryosat_thk_20161212

Almost no ice over 2 meters thick to be found in the Beaufort sector or anywhere on the Siberian side of the Arctic. Here’s the current AMSR2 Arctic sea ice area graph:

uh-arctic-area-2016-12-15

Lowest for the date in the satellite record. Here’s the NSIDC’s long term trend in November sea ice extent:

monthly_ice_11_nh

Act 1 of a 3 act play according to Don Perovich at AGU. Here’s the current PIOMAS Arctic sea ice volume anomaly graph:

piomas-anomaly-201611

Lowest for the date in the satellite record. Here’s NOAA’s Arctic and global surface temperature graph:

arctictemp_map_graph_2015-16_620

Warmest in a record going back to 1900. Here’s the current DMI >80N surface temperature graph:

dmi_meant_20161216

and here’s the current Arctic surface temperature anomaly map:

cci-t2-anomaly-20161217

Finally, for the moment at least, here’s global sea ice area just for good measure:

nsidc_global_area_20161216


Need I say more? How about this:


Ice has no agenda. It just melts.
Out of the labs and into the streets?

Global Sea Ice At Record Low Levels

NSIDC 5 day averaged Antarctic sea ice extent is now at a record low level for the date, since satellite measurements began in 1979:

chantarctic-20161105

NSIDC 5 day averaged Arctic sea ice extent has been at a record low level for the date for quite a while:

charctic-20161105

Combining those two facts means that global sea ice extent is also at a record low level for the date by a considerable margin. The gap with all previous years in the satellite record is even more stark if you look at global sea ice area:

nsidc_global_area_byyear

The October Arctic sea ice volume numbers from PIOMAS have also just been published:

piomas-trnd3-20161031

By October 31st that metric was also “lowest ever” for the date.

More Of The Usual Hype About Arctic Sea Ice

No sooner has one of the usual suspects claimed that “Arctic Sea Ice Holds Firm” than a few more jump on the same bandwagon. The Global Warming Policy Forum have republished almost the whole of an article penned by our old friend Paul Homewood entitled “More Of The Usual Hype About Arctic Ice“. According to Paul (and Benny):

Far from collapsing, Arctic sea ice area has been remarkably stable in the last decade

He illustrates his point using a slightly different version of the Cryosphere Today Arctic sea ice area anomaly graph employed by Andrew Montford on March 29th. Here’s the latest version:

seaice-anomaly-20160403

For some strange reason Paul (and Benny) neglect to mention that the current anomaly of -1.199 million square kilometers is the most negative it has ever been for the day of the year in the entirety of the Cryosphere Today record going back to 1979. They also neglect to mention that the CT anomaly is typically much larger in summer than in winter, and that despite that fact the CT anomaly never fell as low as -1.199 at any time of year until 2006.

Make sure to follow the first link above for much more on anomalously misleading area graphs. However Paul (and Benny) are not content with just one misleading interpretation of an anomaly graph. The article continues:

With multi year ice continuing to recover from 2008 lows, ice volume has also been growing in the last few years.

BPIOMASIceVolumeAnomaly-201602

Whilst we all eagerly await the release of the PIOMAS Arctic sea ice volume numbers for March 2016, here is an alternative visualisation of the data from Chris Reynolds:

Reg-Vol-Feb16

Volume is the second lowest on record [for February] since 1978 at 20.660 thousand km cubed

In the Central Arctic, where it matters most, sea ice volume at the end of February was only a whisker above where it was in 2012, according to PIOMAS at least. For those with short memories the CT Arctic sea ice area metric reached an *all time low of 2.23401 million square kilometers on September 13th 2012, and an *all time low anomaly of -2.81817 million square kilometers on October 14th 2012.

*Since the Cryosphere Today records began

An Open Letter to the Reader’s Editor of the Daily Mail

Thank you for your prompt reply, and my apologies for my slightly sluggish one. As you can tell from my details below I have a “day job” to attend to, and if you’ve clicked the links I sent in my original complaint you’ll realise I’ve also been very busy following up on some other allegedly inaccurate articles in the Daily Mail and a number of other Great British newspapers. See for example:

https://greatWhiteCon.info/2015/07/professor-peter-wadhams-complaint-to-ipso/

Gettting back to this complaint, I have just posted my initial reply online here:

https://greatWhiteCon.info/2015/07/mail-makes-1000-arctic-mistake/

Reiterating the main point:

We hereby call on the Daily Mail to provide us with a fair opportunity to reply to this egregious inaccuracy and a number of others in the same article.

Despite your “I therefore cannot see that Clause 1(ii) of the Editors’ Code has been breached in any way.” below, and apart from your admittedly at least 1000% timescale error, the Guardian article linked to highlights a number of other gross inaccuracies in last week’s “Daily Mail Comment” concerning Arctic sea ice volume. I fail to see how “Putting the Arctic sea ice volume record straight” for the unfortunate readers of that editorial can be achieved without prominently displaying to your print readers the Arctic sea ice volume graph extracted from Rachel Tilling’s recent academic paper:

Tilling-2015-Volume

and in addition showing your online readers the “Arctic ice cube” video together with a link to it in print.

I shall have much more to say to you on that topic in the near future but I’m theoretically “on holiday” for a week from tomorrow, so it may well not arrive in your inbox until after my return.

Best wishes,

Jim Hunt

Arctic Sea Ice Volume for Dummies

Dana Nuccitelli has just published an article in the Guardian entitled:

The Daily Mail and Telegraph get it wrong on Arctic sea ice, again

Not only does Dana kindly link to our recent efforts to educate the Daily Mail’s leader writer about the Arctic facts of life. He also does a much better job of explaining the issues than a previous Guardian article about Arctic sea ice volume which we were recently somewhat critical of. This therefore seems like the perfect time to provide an “Arctic Sea Ice Volume 101” lesson for Daily Mail leader writers and their wholly independent “legal eagles”.

Let’s take things one small step at a time shall we. The Daily Mail leader last week starts by saying:

In a major report last year, the Intergovernmental Panel on Climate Change gave a grave assessment of how man-made global warming was rapidly destroying the Arctic ice cap.

Steadily increasing temperatures had made the pack ice contract by up to 12 per cent between 1979 and 2012, leading to rising sea levels which threatened to swamp coastal regions – not to mention endangering stranded polar bears.

By the middle of the century ‘a nearly ice-free Arctic Ocean’ was likely for a large part of the year, the report predicted.

The Mail’s leader writer isn’t very specific about which of the numerous IPCC reports they are referring to , but the Mail’s legal eagle tells us that:

This item was written on the basis of… the 2014 synthesis report by the Intergovernmental Panel on Climate Change – arguably the definitive authority on the subject.

This is a quote from that IPCC report (p4 notes). ‘The annual mean Arctic sea-ice extent decreased over the period 1979 to 2012, with a rate that was very likely in the range 3.5 to 4.1% per decade.’

Given that there are over three decades between 1979 and 2012, the shrinkage of the ice-cap couldn’t have been more than 12 per cent.

This is the first of many “misunderstandings” in the Daily Mail’s leader and their legal eagles response. Here is an extract from Section B.3 “Cryosphere” on page 9 of the IPCC AR5 Working Group 1 Summary for Policy Makers:

The annual mean Arctic sea ice extent decreased over the period 1979 to 2012 with a rate that was very likely in the range 3.5 to 4.1% per decade (range of 0.45 to 0.51 million km2 per decade), and very likely in the range 9.4 to 13.6% per decade (range of 0.73 to 1.07 million km2 per decade) for the summer sea ice minimum (perennial sea ice).

As you can see, the Mail’s “definitive authority on the subject” subject says that  “for the summer sea ice minimum” Arctic sea ice extent in fact decreased by more like 12% per DECADE.

Moving on the next paragraph in the Daily Mail’s leader, we are told that:

How interesting then, that the latest analysis of 88million measurements from the European Space Agency’s Cryosat satellite show the northern ice-cap INCREASED by a staggering 41 per cent in 2013 and, despite a modest shortage last year, is bigger than at any time for decades.

whilst the Mail’s legal eagle explains to us that:

This item was written on the basis of a UCL report that formed this story: http://www.dailymail.co.uk/sciencetech/article-3168504/Arctic-sea-ice-boosted-cool-summer-2013-study-reveals.html

That story states that:

Researchers used 88 million measurements of sea ice thickness recorded by the European Space Agency’s CryoSat-2 mission between 2010 and 2014.

The results showed that there was a 14 per cent reduction in the volume of summertime Arctic sea ice between 2010 and 2012 – but the volume of ice jumped by 41 per cent in 2013, relative to the previous year, when the summer was five per cent cooler than the previous year.

Notice that in this article the author is talking about “summertime Arctic sea ice volume” and not “mean Arctic sea ice extent”. Let’s see if instead of trying to compare apples with oranges like the Mail’s leader writer we can in fact compare like with like shall we?

Firstly let us recall (if we can) from our school days that Volume = Area x Thickness. Next returning to the IPCC AR5 WG1 report we need to turn to the technical summary of their full report where in the TS.2.5.3 “Sea Ice” section on page 40 we can read that:

There is high confidence that the average winter sea ice thickness within the Arctic Basin decreased between 1980 and 2008. The average decrease was likely between 1.3 m and 2.3 m. High confidence in this assessment is based on observations from multiple sources: submarine, electromagnetic probes and satellite altimetry; and is consistent
with the decline in multi-year and perennial ice extent.

Now unfortunately for our purposes this decline in thickness is not expressed as a percentage and is in winter rather than summer. Nevertheless it should be readily apparent to all and sundry by now that the thickness of Arctic sea ice has been declining at the same time as its extensiveness. Moving on to page 136 in section 1.3.4.3 “Ice” of the full IPCC WG1 report we find:

There has been a trend of decreasing Northern Hemisphere sea ice extent since 1978, with the summer of 2012 being the lowest in recorded history (see Section 4.2 for details). The 2012 minimum sea ice extent was 49% below the 1979 to 2000 average and 18% below the previous record from 2007. The amount of multi-year sea ice has been reduced, i.e., the sea ice has been thinning and thus the ice volume is reduced.

Following the IPCC’s instructions let’s now move on to page of section 4.2.2.4 “Arctic Sea Ice Thickness and Volume”, where we read that:

For the Arctic, there are several techniques available for estimating the thickness distribution of sea ice. Combined data sets of draft and thickness from submarine sonars, satellite altimetry and airborne electromagnetic sensing provide broadly consistent and strong evidence of decrease in Arctic sea ice thickness in recent years.

That’s followed by many paragraphs of learned discussion, but still no statement of Arctic wide volume decline in percentage terms to keep the Mail’s legal eagle happy.

Inside the BBC’s Arctic Sea Ice Science

I’m sure we’ll get stuck into to some real science eventually, but for the moment we’re still taking a long, hard look at mainstream media coverage of the latest learned journal article on Arctic sea ice to be misinterpreted by the media. Compared to some others one might mention the report on the BBC web site about the new CPOM paper in Nature Geoscience entitled “Increased Arctic sea ice volume after anomalously low melting in 2013” was relatively accurate. Entitled “Arctic ice ‘grew by a third’ after cool summer in 2013“, it said that:

Researchers say the growth continued in 2014 and more than compensated for losses recorded in the three previous years.

The scientists involved believe changes in summer temperatures have greater impacts on ice than thought.

But they say 2013 was a one-off and that climate change will continue to shrink the ice in the decades ahead.

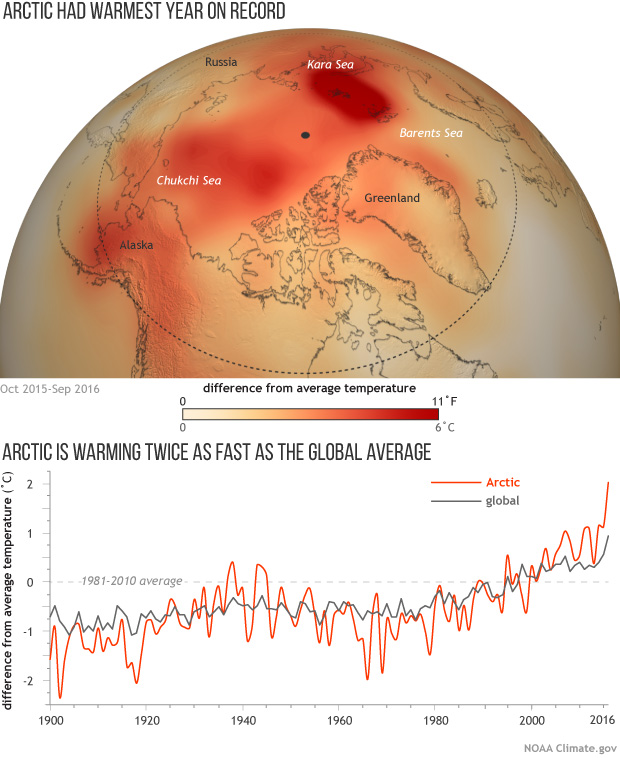
The Arctic region has warmed more than most other parts of the planet over the past 30 years.

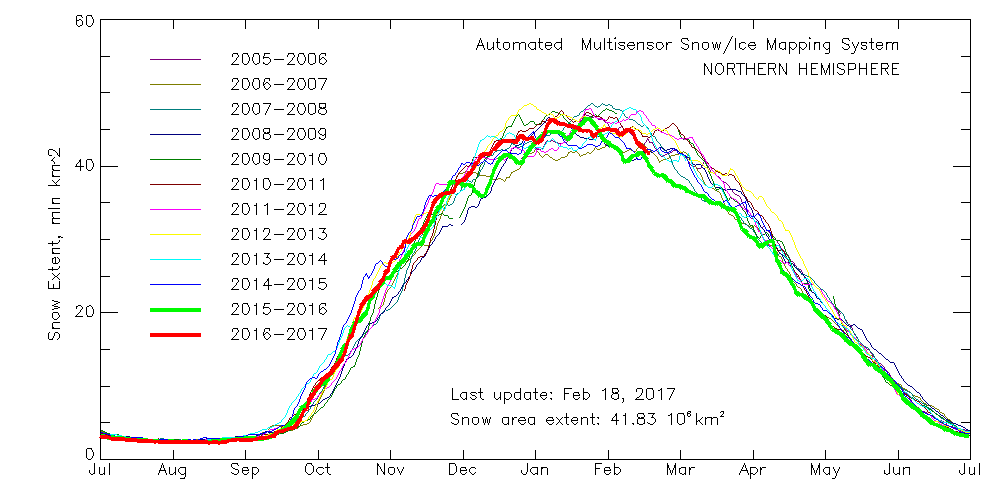
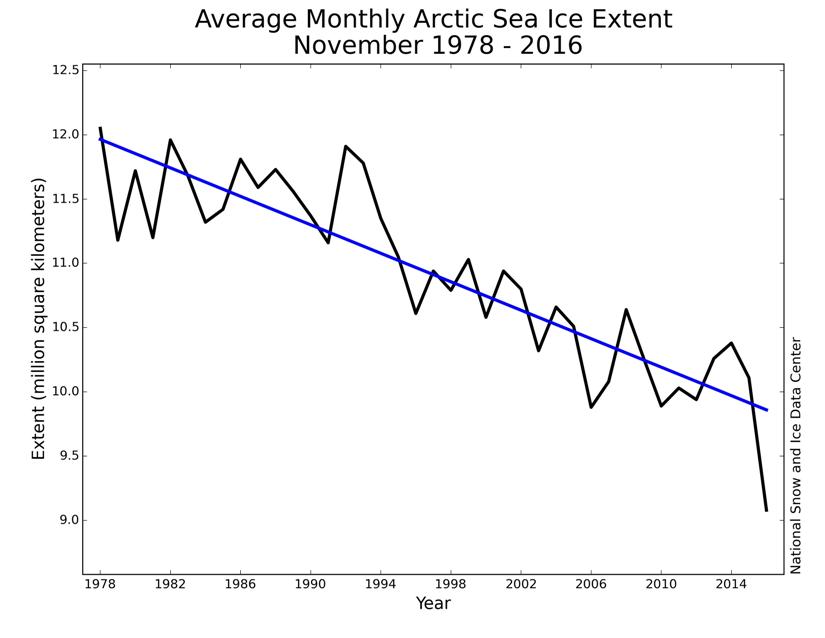
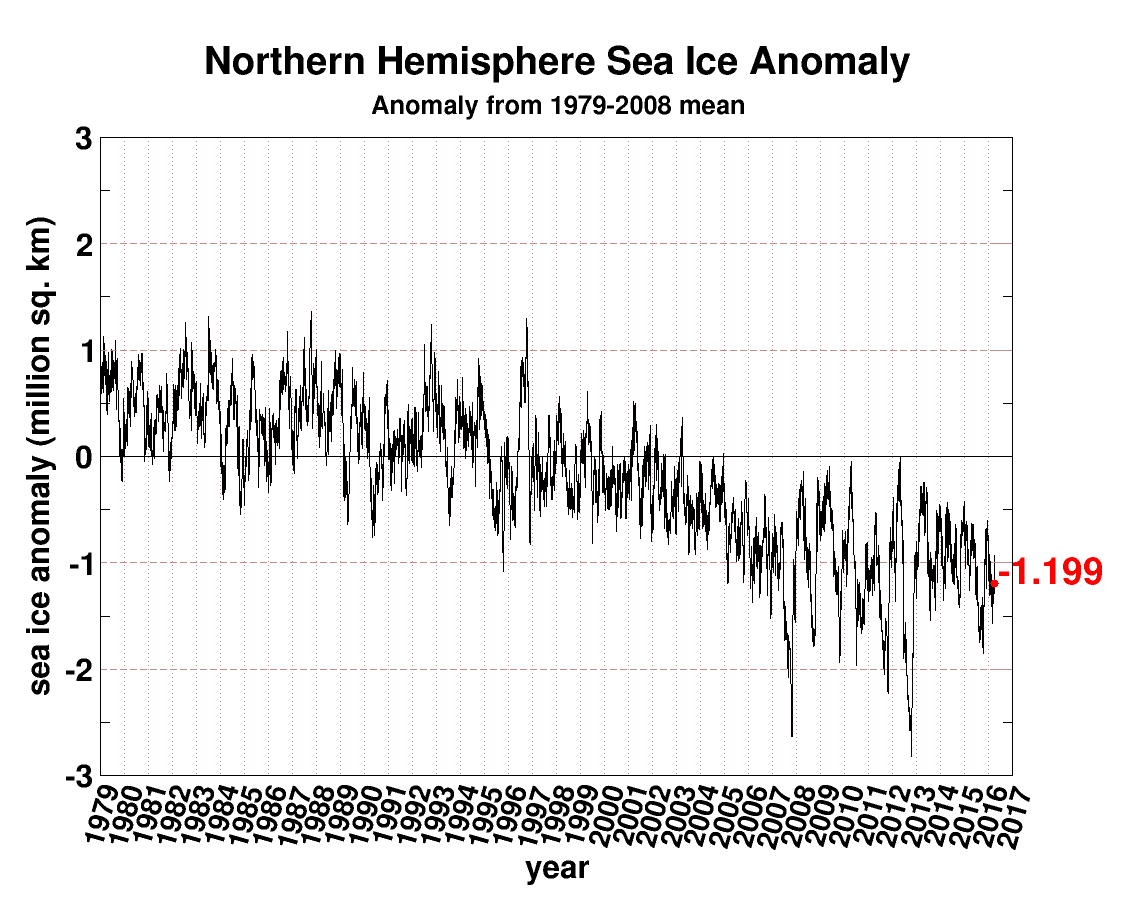
Satellite observations have documented a decrease of around 40% in the extent of sea ice cover in the Arctic since 1980.

and

The researchers used 88 million measurements of sea ice thickness from Cryosat and found that between 2010 and 2012, the volume of sea ice went down by 14%.

They published their initial findings at the end of 2013 – but have now refined and updated them to include data from 2014 as well.

Relative to the average of the period between 2010 and 2012, the scientists found that there was a 33% increase in sea ice volume in 2013, while in 2014 there was still a quarter more sea ice than there was between 2010 and 2012.

At this juncture one is forced to ask oneself the question that if there was 33% more sea ice in 2013 than there was between 2010 and 2012, but only 25% more in 2014 how it was possible that “the growth continued in 2014”?

Desperately hoping that the BBC might be able to explain this conundrum to us we avidly listened to Adam Rutherford’s interview with Rachel Tilling, the lead author of the paper in question, on BBC Radio 4’s “Inside Science” programme last night. We were also hoping that at long last there might be some quantification of what’s happened to the VOLUME of “sea ice cover in the Arctic since 1980”. Sadly all our hopes were dashed, and Adam never posed the vital questions.

You can download a recording of the broadcast from the link above. Adam’s interview with Rachel starts at 7:00 minutes. He begins by talking about:

The publication in Nature Geoscience this week of a new paper that shows that in 2013, which was a slightly cooler summer than average, Arctic ice had grown, not just a tad, but by a WHOPPING 41% on the previous year!

Rachel Tilling then begins by saying:

The thickness and the volume are actually the most important measurements we can get, because the area’s been really, really useful in giving us an overview of how the Arctic is changing, but it only really gives us half the picture.

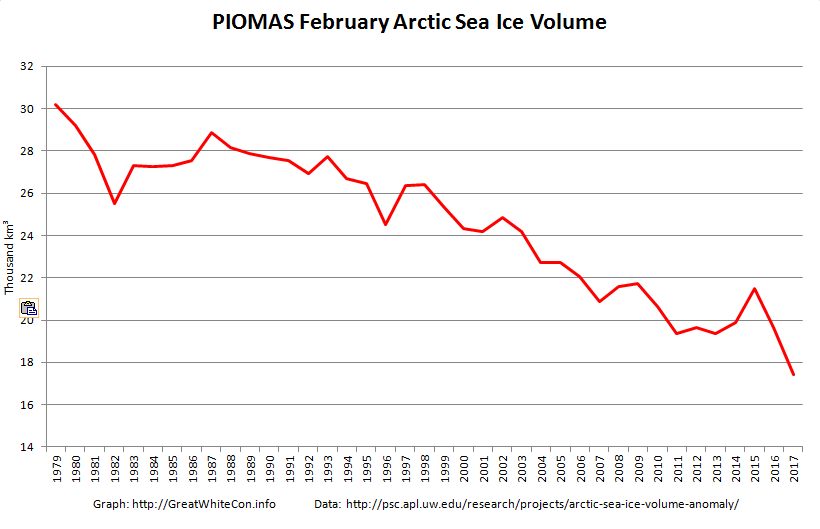
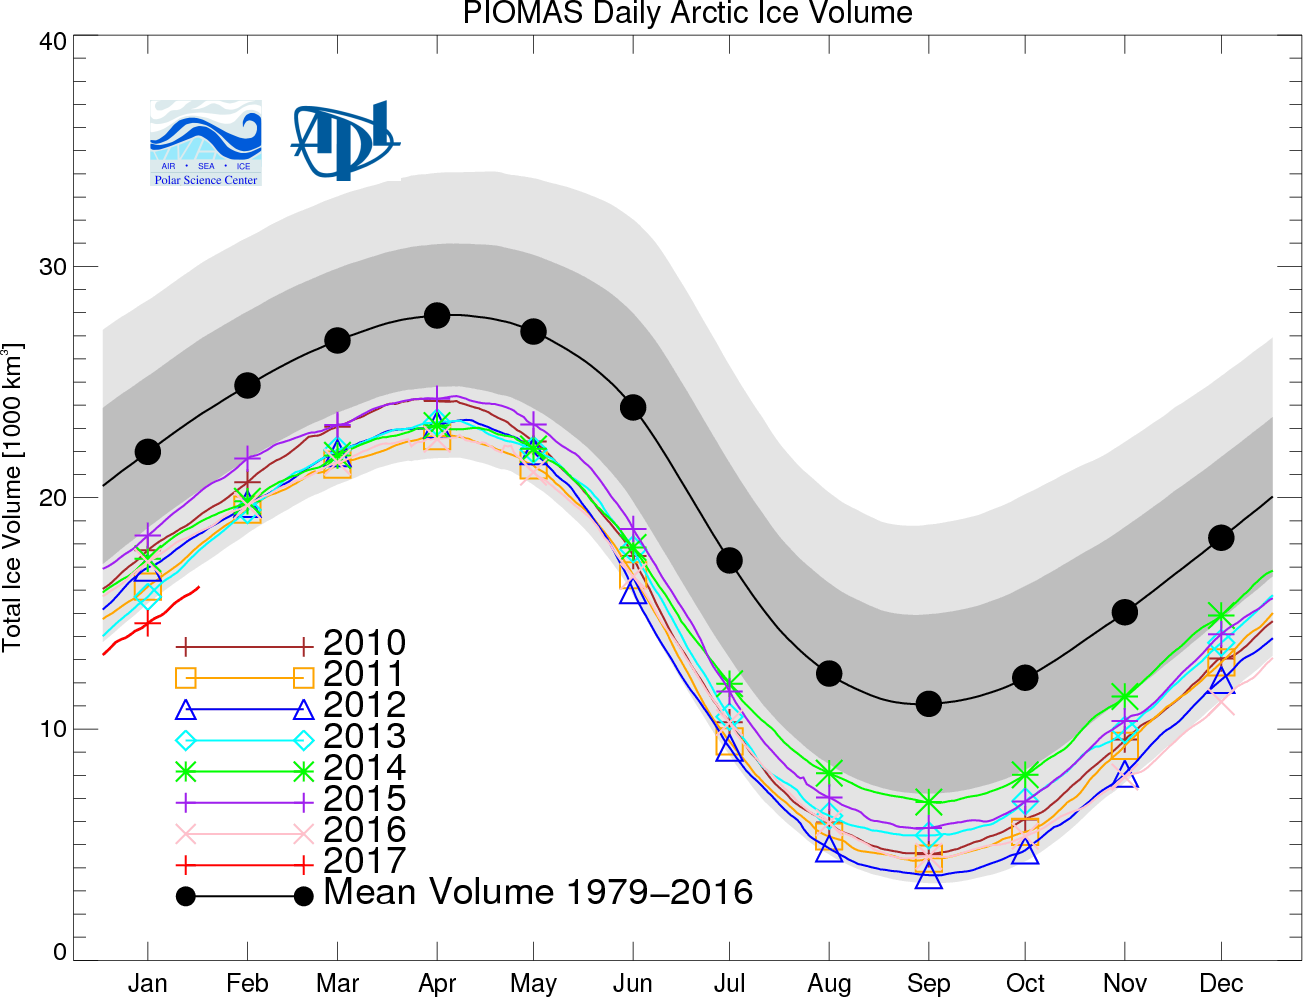
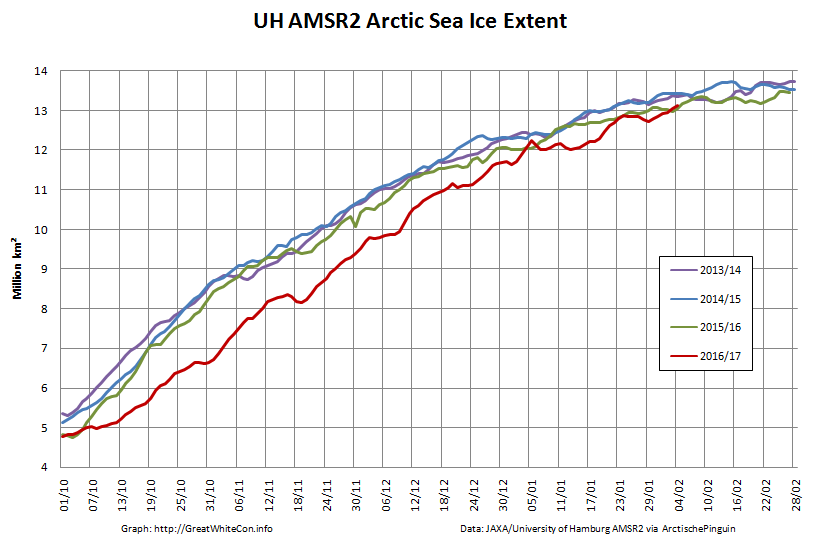
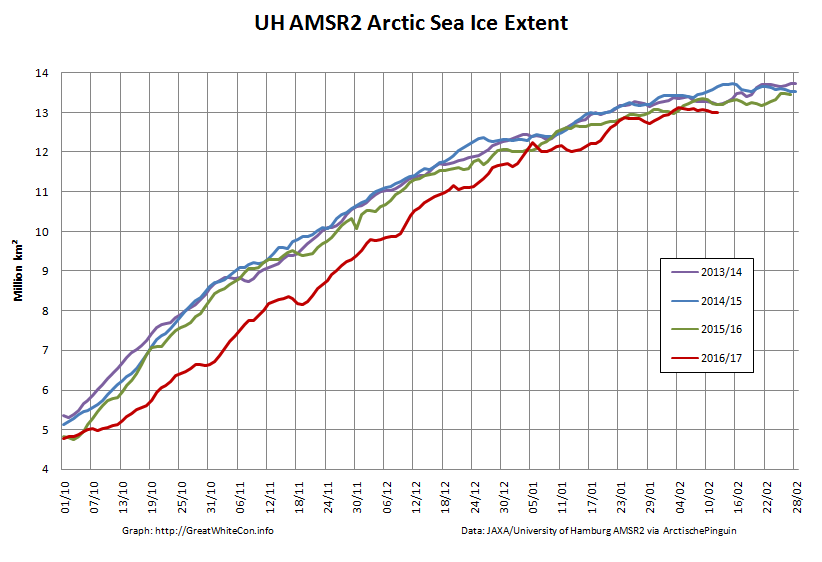
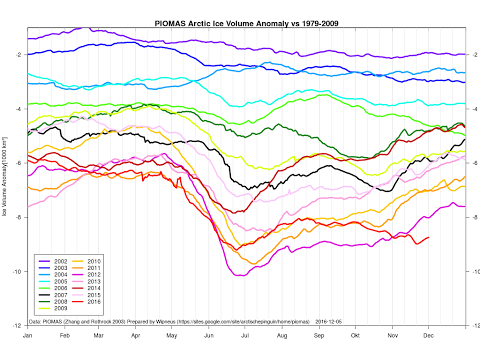
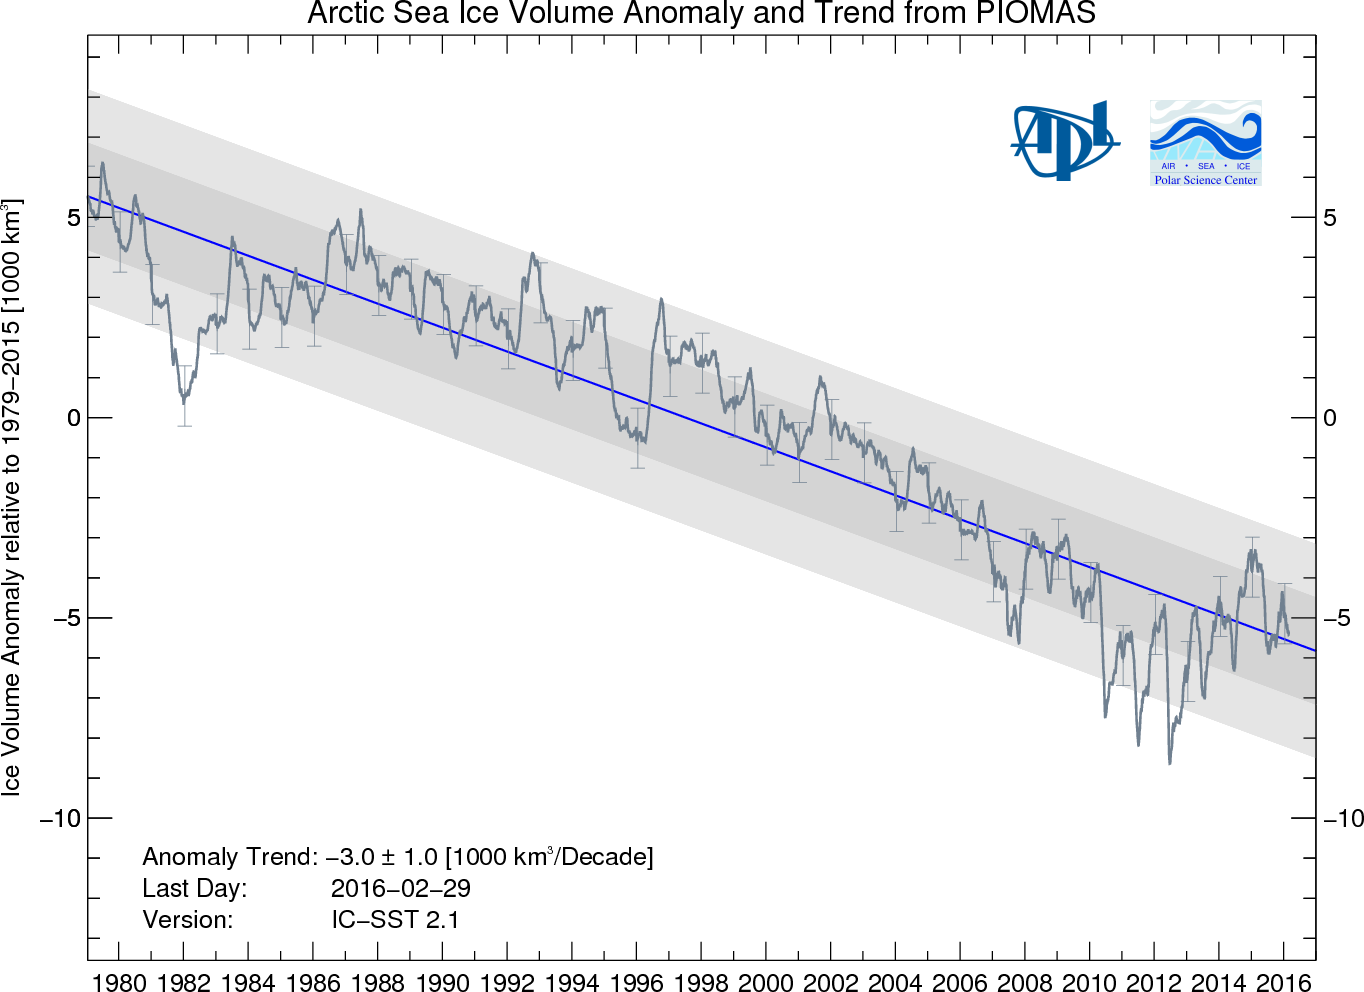
Here’s the full picture, taken from our Arctic Sea Ice Graphs page. Since CryoSat-2 measurements only go back as far as 2010, this graph shows Arctic sea ice volume calculated by the PIOMAS model developed by the Polar Science Center at the University of Washington:

piomas-trnd2-201506
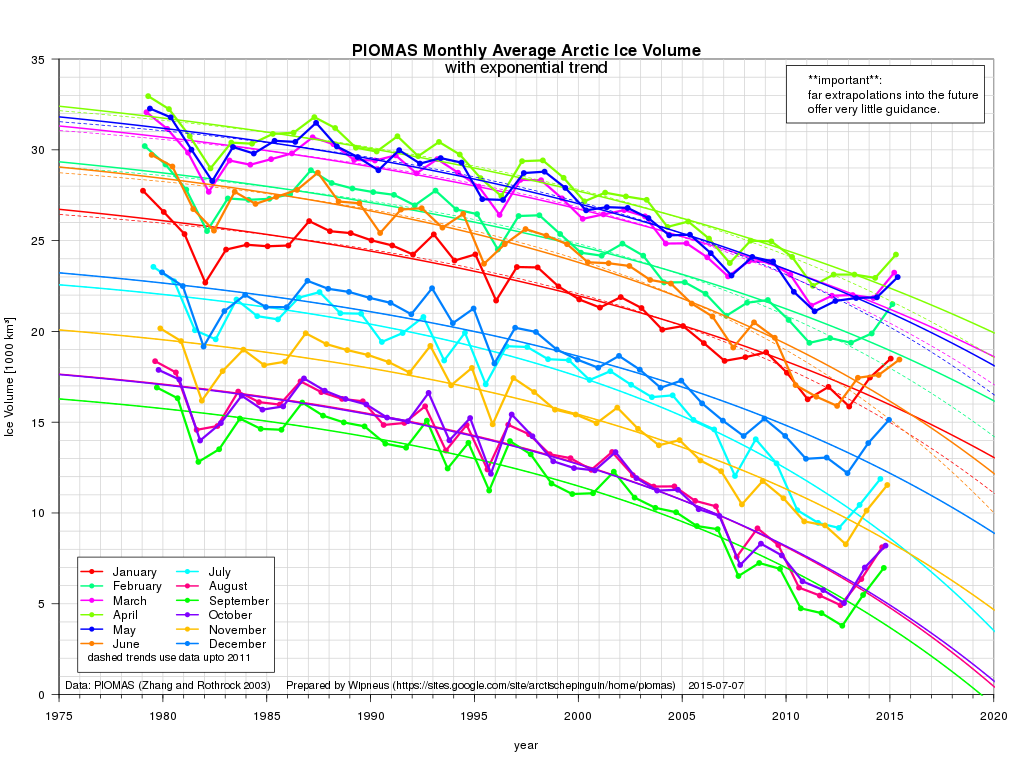
Is that WHOPPING increase in Arctic sea ice volume from 2012 to 2013 clear to you now? At 11:00 minutes into the programme Adam says:

You can see how this is going to be interpreted. You know, with 30 years of Arctic sea ice shrinking, and then suddenly it gets bigger, you’re still OK with climate change being a real thing, and global warming being a real thing?

I can see that very clearly Adam, thanks for asking, and YES is the answer to your final question. It still wasn’t clear to me whether that would be clear to Adam’s listeners however, so I posed a pertinent question on Twitter first of all:

That didn’t elicit any response, so then I tried following Adam’s instructions at the end of the interview to:

 Do let us know what you think – [email protected]

This is what I thought:

Hello Adam,

Further to your recent interview with Rachel Tilling, and your joint Twitter conversation with my alter ego “Snow White”, I’d like to reiterate how disappointed the two of us are that during your conversation with Rachel there was no mention of “41% of nothing”. Twitter speak for “Doesn’t anybody at the BBC have the faintest idea what Arctic sea ice volume was 30 years ago, in April and in October?”

By way of additional context see e.g.

https://greatWhiteCon.info/2015/07/an-inconvenient-truth-about-the-mails-climate-coverage/

http://www.carbonbrief.org/blog/2015/07/cool-arctic-summer-brought-brief-recovery-in-2013-sea-ice-loss/

https://greatWhiteCon.info/resources/

Yours in dismay,

Jim Hunt

and this is the response I got from BBC Inside Science:

Dear Sir or Madam

Thank you very much for your email. While all emails are read – and we appreciate input from listeners – we cannot reply to each one individually. There are simply too many!

For more information about Inside Science, please go to our webpage:

Inside Science, Radio 4
http://www.bbc.co.uk/programmes/b036f7w2

For individual programmes, click on ‘Episodes’.
http://www.bbc.co.uk/programmes/b036f7w2/episodes/guide

Once you have located a particular programme page, you will see a link to ‘Listen now’- on the picture of Dr. Adam Rutherford.
‘Related Links’ are found further down on the right hand side of the page.

Downloads/Podcasts of Inside Science are available at:
http://www.bbc.co.uk/podcasts/series/inscience

Thanks again and do keep sending your comments in – listener feedback helps us make better programmes for you.

Yours sincerely

Inside Science, Radio 4


Meanwhile, over on Twitter:

An Inconvenient Truth About The Mail’s Climate Coverage

A new paper has just been published by the CryoSat-2 team at University College London. The lead author is Rachel Tilling, a PhD student in the Centre for Polar Observation & Modelling at UCL. We’ll get on to the science in due course, but first let’s take a look at how Rachel’s paper has been reported in the Great British mainstream media. In a headline redolent of our old friends at the Mail on Sunday The [headline writer for the] Guardian’s Damian Carrington proclaims that:

Arctic sea ice volume showed strong recovery in 2013

Cooler temperatures revived sea ice levels suggesting a rapid recovery was possible if global warming was curbed, scientists say

Yesterday wasn’t a Sunday, so David Rose was writing in The Spectator instead of The Mail, asking rhetorically:

Was the global warming pause a myth?

Of course it was David! We explained that to you back in January!

The Daily Mail Group couldn’t let a juicy headline go begging just because it’s midweek, so an anonymous leader writer came up with this one:

Climate change and an inconvenient truth

The “Daily Mail Comment” continues:

In a major report last year, the Intergovernmental Panel on Climate Change gave a grave assessment of how man-made global warming was rapidly destroying the Arctic ice cap.

Steadily increasing temperatures had made the pack ice contract by up to 12 per cent between 1979 and 2012, leading to rising sea levels which threatened to swamp coastal regions – not to mention endangering stranded polar bears.

By the middle of the century ‘a nearly ice-free Arctic Ocean’ was likely for a large part of the year, the report predicted.

How interesting then, that the latest analysis of 88million measurements from the European Space Agency’s Cryosat satellite show the northern ice-cap INCREASED by a staggering 41 per cent in 2013 and, despite a modest shortage last year, is bigger than at any time for decades.

After that it prattles on about the “pause”, so for now let’s take a look at the paper that’s got the papers so excited. For some strange reason it’s title makes no mention of a “strong recovery in 2013”, instead describing:

Increased Arctic sea ice volume after anomalously low melting in 2013

Searching the paper for the word “recovery” returns zero results, so you may well be wondering what it actually does say? Here’s a pertinent, albeit brief, extract from the abstract:

Between autumn 2010 and 2012, there was a 14% reduction in Arctic sea ice volume, in keeping with the long-term decline in extent. However, we observe 33% and 25% more ice in autumn 2013 and 2014, respectively, relative to the 2010–2012 seasonal mean, which offset earlier losses. This increase was caused by the retention of thick sea ice northwest of Greenland during 2013 which, in turn, was associated with a 5% drop in the number of days on which melting occurred—conditions more typical of the late 1990s. In contrast, springtime Arctic sea ice volume has remained stable.

Let’s compare that with the Mail’s version shall we? Whilst searching the paper for the word “ice” returns lots of results a search for the word “cap” returns zero results, just like “recovery”. Any investigative journalist (or leader writer) who had investigated Wikipedia would have discovered this:

An ice cap is an ice mass that covers less than 50,000 km² of land area (usually covering a highland area). Masses of ice covering more than 50,000 km² are termed an ice sheet.

Thus the Arctic Ocean is not covered by an “ice-cap [that] INCREASED by a staggering 41 per cent in 2013” because, as it’s name suggests, it’s an ocean and not a land area. Assuming for the moment that the Mail leader writer is in actual fact referring to sea ice cover in the Arctic, then according to Rachel Tilling’s paper CryoSat-2 “observed 33% more ice in autumn 2013”. Where did the Mail’s “41%” come from then? Their patent pending hot air generator in reverse gear?

Moving on, the Mail must also have a top secret time machine hidden in the basement of Northcliffe House that will enable their leader writer to travel back and change history, because here once again is Andy Lee Robinson’s graphic visualisation of what’s really been happening to the volume of sea ice in the Arctic over the past few decades, albeit using PIOMAS sized ice cubes rather than the CryoSat-2 flavour:

Needless to say I have already lodged an official complaint about the antics of The Daily Mail’s imaginary time machine. If you would like to do as well then here is the appropriate form to fill in:

http://dailymail.co.uk/readerseditor

For any IPSO case officers (or Guardian writers) that might be watching please feel free to read all about 41% of nothing, and if you prefer graphs to moving pictures here’s one that shows Arctic sea ice volume in Spring from our PIOMAS regional volume page:


Meanwhile, over on Twitter:

New Arctic Sea Ice Resources

Stung by some unusually constructive criticism from Anthony Watts we have (somewhat hurriedly) added several new pages to the Great White Con “Resources” section of this web site. They contain the sort of information that is rather tricky to update automatically on a daily basis, and concentrate on resources that help the interested searcher after truth get a handle on the thickness and hence volume of the sea ice in the Arctic, on a regional as well as pan Arctic scale.

The first section is entitled “Arctic Sea Ice Graphs“, and here’s an example of one graph which reveals the ice volume in various regions of the Arctic, based on the output of the PIOMAS model:

PIOMAS regional volume breakdown for March 2014

[Graph by Chris Reynolds on the Dosbat blog]

The second section is entitled “Ice Mass Balance Buoys“. As the name hopefully suggests, this section displays data reported by the Cold Regions Research and Engineering Laboratory’s currently active ice mass balance buoys in a variety of novel formats. These buoys are deployed on a regular basis at selected locations across the Arctic, and report on a number of different parameters including snow depth, ice thickness and temperature. By way of example here’s a couple of reports from IMB 2013F, which was originally deployed last August on what was then classified as “first year” ice in the Beaufort Sea. First of all here’s the Google Maps/Earth view that reveals how the buoy has moved around the Arctic since then, and shows how clicking on one of the “pushpins” reveals the values of a variety of interesting metrics on a daily basis:

Google map of the movement of IMB 2013F

As you can see, last August the thickness of the ice floe that the buoy is located upon was 1.4 metres thick. If you click through to the live map and experiment you will discover, amongst a variety of other things, that the ice under the buoy is now 1.68 meters thick, with an additional 49 cm of snow on top of that.

A second set of images shows graphs revealing the temperature above, below and within the ice, currently on a monthly basis:

2013F-Temp-20140401

Click on the graph to view a larger version. This one requires a certain amount of interpretation, but the first thing to note is that the numbers across the top represent the position of thermistors spaced 10 cm apart on a pole that is mounted vertically through the ice floe. Number 1 is in the air above the floe, the rightmost side of the graph (number 26 in this case) is in the water below the ice floe, and somewhere in between those extremes the temperature sensors can also be in the midst of either ice or snow.

At the end of March the interface between ice and snow in this case was somewhere between sensors 8 and 9, and hence at a temperature of around – 7 degrees Celsius, by which time the buoy had moved from the Canadian waters where it started into the area of the Beaufort Sea north of Alaska.

For further discussion about the interpretation of our new resources please use the comment section on the “About Our Arctic Sea Ice Resources” page. For technical observations and suggestions for improvements feel free to comment below!


60 Per Cent of Nothing?

Our title today is an allusion to Bill Bruford’s “Five Percent For Nothing”, from the 1971 album “Fragile” by Yes. Here’s what the cover looks like:

Fragile cover art, by Roger Dean (image Wikipedia)

Them:

A chilly Arctic summer has left nearly a million more square miles of ocean covered with ice than at the same time last year – an increase of 60 per cent.

Us:

According to the NSIDC once again the numbers look like this:

NSIDC daily Arctic sea ice extent chart, highlighting September 7th 2013

The sums are obviously rather tricky, so we’ve enlisted the aid of a spreadsheet. Here’s what it reveals to us:

Metric Date 2012 2013 Increase
NSIDC Daily Extent (million km²) Day 249 3.558 5.236 47.2%
NSIDC Daily Extent (million km²) Sep 8th 3.523 5.179 47.0%
NSIDC Daily Extent (million km²) Aug 27th 3.94 5.632 42.9%
NSIDC Daily Extent (million km²) Aug 15th 4.845 6.159 27.1%
NSIDC Monthly Extent (million km²) August 4.71 6.09 29.3%

Verdict:

Whichever way you look at things, on a “same time last year” basis at least, the magic number of 60% seems to be out of reach. Whatever the arithmetic David Rose actually performed, whether mentally or on his pocket calculator, it would appear not to involve comparing like with like. We have asked David and the Mail on a number of occasions what numbers he started from and what calculations he performed. We have received no answers as yet.

Getting back to our title, when you start to look at Arctic sea ice volume instead of extent, 160% of almost nothing is still almost nothing:

Video courtesy of Andy Lee Robinson

Small print: We have yet to double check all the numbers in our simple spreadsheet. The NSIDC web site is still down today.