USS Skate (SSN-578) made submarine history on 11 August 1958 when it became the first submarine to surface at the North Pole
Us:
It would seem to be the USS Skate on 11 August 1958 when it became the first submarine to surface at the North Pole. What is this picture of?
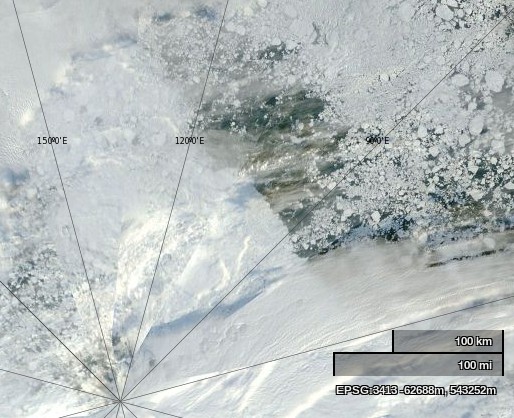
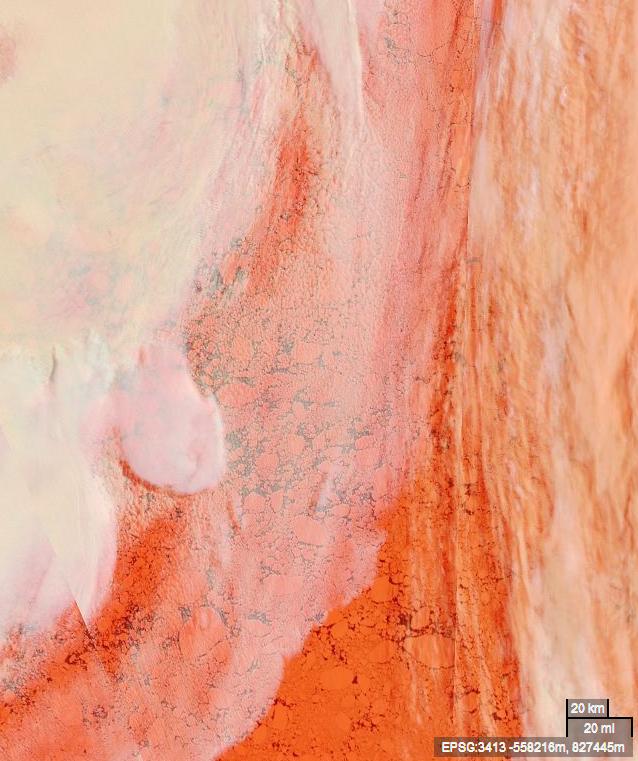
NASA Worldview “true-color” image of the North Pole area on September 2nd 2013, derived from bands 1, 4 and 3 of the MODIS sensor on the Terra satellite
Them:
Frozen ice. What is my prize?
And basically yours is just a snipe hunt. Mine disproves your hysteria.
Us:
No prize I’m afraid. The correct answer is vast areas of open ocean. Plenty of room for every submarine on the planet.
Them:
Sorry, there is no open water. Check your picture again. So you are reneging? Typical.
Us:
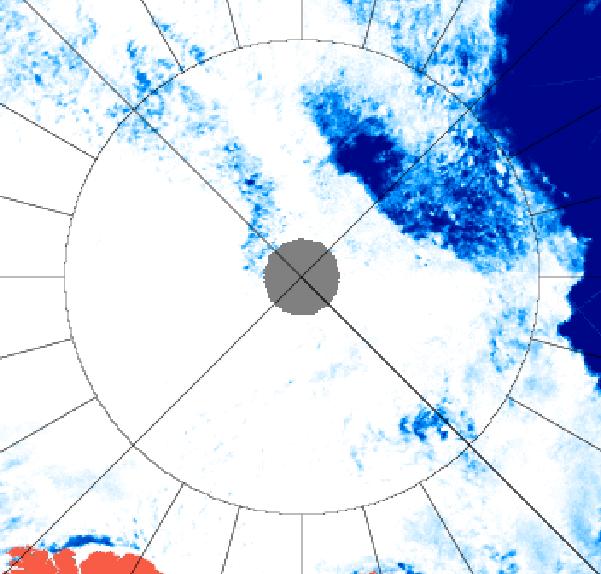
I have checked again, and I still see lots of open water underneath a thin veil of cloud. Perhaps you should arrange a hasty visit to an optician? Luckily microwaves can see through clouds, even if you cannot. Here’s another satellite image of the North Pole area from September 2nd 2013, this time a University of Hamburg visualisation of data from the AMSR2 sensor on board the Japanese SHIZUKU satellite.
AMSR2 image of the North Pole area on September 2nd 2013
Earlier on this morning a debate about censorship started over on the so called “Real Science” blog. Unfortunately after a couple of attempts it became clear to me that my participation was not welcome.
Them:
A question about censorship is posed on the “Real Science” blog
With the able assistance of some of the regular readers of Steve Goddard’s so called “Real Science” blog I have drawn up a checklist of questions to answer should you (or any “sceptics” you may be aware of) be suffering from the delusion that the sea ice in the Arctic is “recovering” or “rebounding”:
Us:
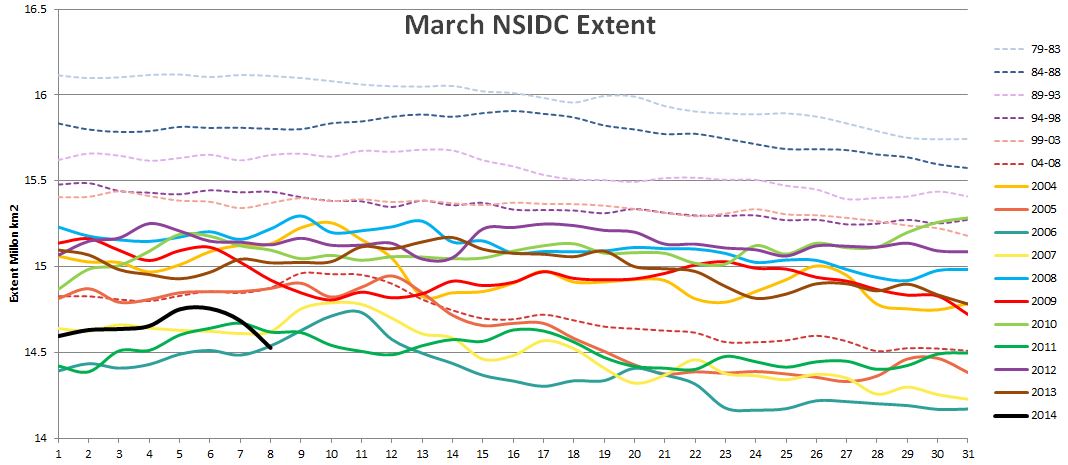
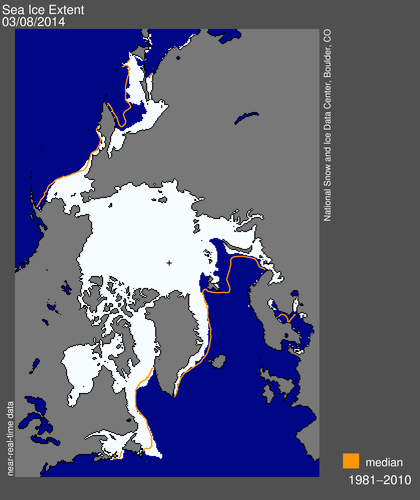
1. Is the NSIDC daily Arctic sea ice extent number for March 8th 2014 the lowest on record for that day of the year? Yes or No?
2. Is the Cryosphere Today Arctic sea ice area number for March 8th 2014 the lowest on record for that day of the year? Yes or No?
3. Is the IJIS Arctic sea ice extent number for March 9th 2014 the lowest on record for that day of the year? Yes or No?
4. What credible evidence can you provide to show that “The Arctic is getting colder”?
5. In what way has the NSIDC’s data been “contaminated by Mann”?
6. Where might one find “empirical data that hasn’t been contaminated” if not from the likes of NOAA/NASA/JAXA et. al.
8. How much sea ice do you suppose will be left in the Gulf of St. Lawrence by September? [2014-3-12 20:26]
9. Which version of “the [thickness/volume] truth” do you choose to believe? [2014-3-14 09:30]
10. When was it that the DMI “changed the way they read/interrupt coastal features [which] they incorporated into their extent/area numbers”? [2014-3-15 15:08]
11. Why have we been accused of “a lie” and “put on ignore”? [2014-3-16 15:12]
12. Please be so good as to provide us with a link that describes “the modeling used by NSIDC to ‘create’ these numbers” [2014-3-20 13:00]
We are proud to bring you this blast from Steven Goddard’s past, reprinted with permission from econnexus.org.uk:
In the first of an occasional series under the “Shock News” banner we reveal how to upset a global warming sceptic in three easy stages.
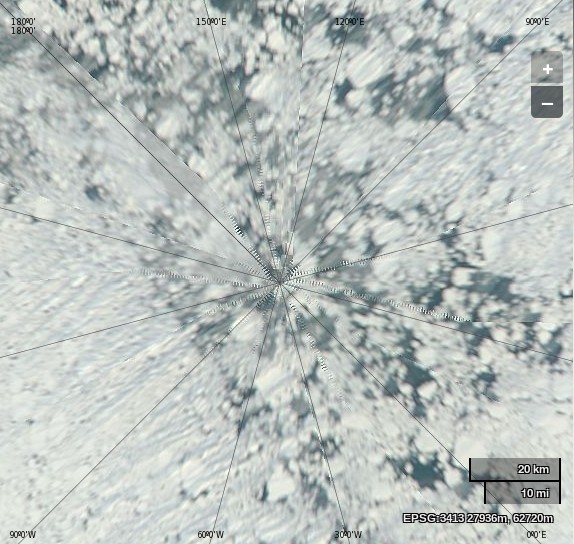
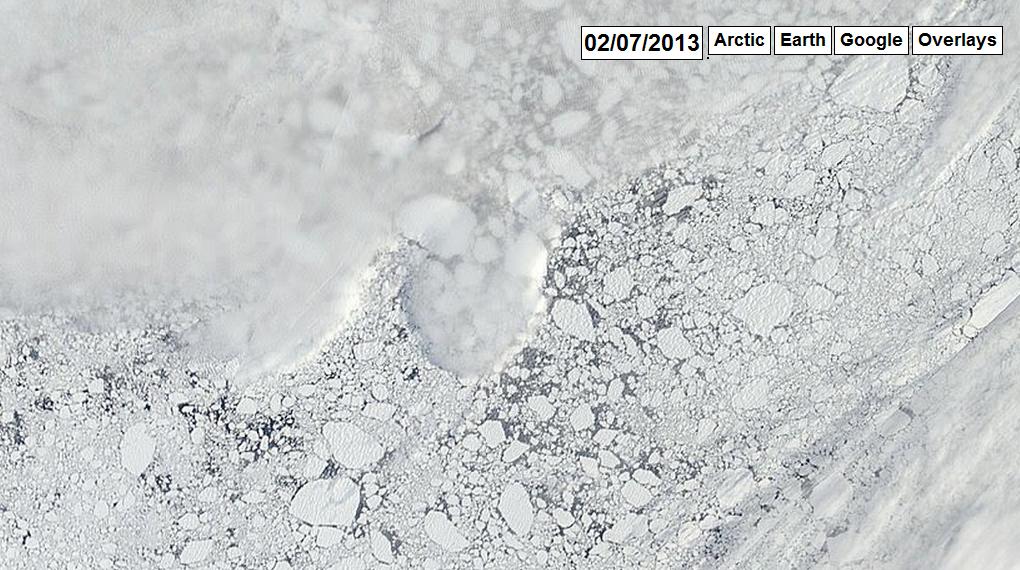
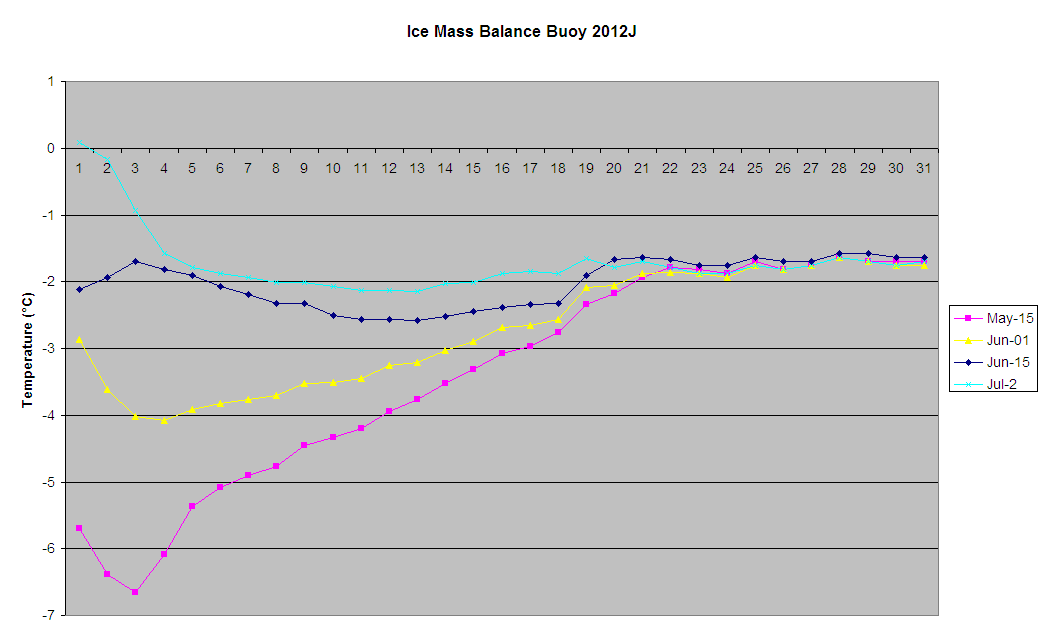
Smell something fishy about a headline that states “New Ice At The North Pole” on July 2nd 2013 and examine “the evidence” from arctic.io presented to substantiate this assertion:
Satellite image of sea ice near the North Pole on July 2nd 2013, courtesy of arctic.io
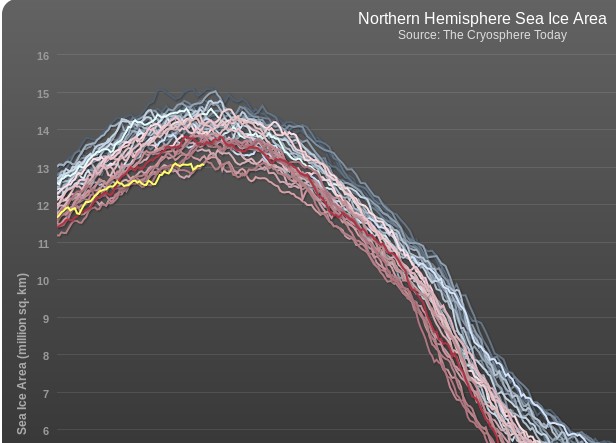
It’s highly probable that whatever metric you choose to use the 2014 Arctic sea ice maximum area and extent will occur this month. Consequently the volume of nonsense propagated by the “skeptics” amongst the “mass media” is increasing also. Earlier today yesterday’s sea ice metrics were published and currently both the Cryosphere Today Arctic sea ice area and NSIDC daily extent are at all time lows for the date. Needless to say that hasn’t stopped the denialosphere prattling on about an “Arctic Ice Recovery” yet again.
First of all, here’s our evidence:
Cryosphere Today Arctic sea ice area graph, as at March 8th 2014
Now I couldn’t help but notice that yet another reproduction of the Mail on Sunday’s erroneous graphic first printed at the time of the 2013 minimum appeared on Steven Goddard’s “Real Climate” blog last week. Steve has been using a variety of other graphics in his assorted attempts to persuade his readers that there is in fact an “Arctic Ice Recovery”. Needless to say, we beg to differ!
Them:
Shocking Increase In Arctic Ice Dooms The Planet – How Ice Sheet Grew 533,000 Square Miles in a Year
Us:
Whilst we’re on the subject of cherry picking, it looks a lot like the left hand part of the image dates from August 27th 2012 whereas the right hand part dates from August 15th 2013. If you’re interested in seeing a similar image dating from September 8th 2013, when the original version of the image above was originally published in the Mail on Sunday over here in once Great Britain then please feel free to take a long hard look at:
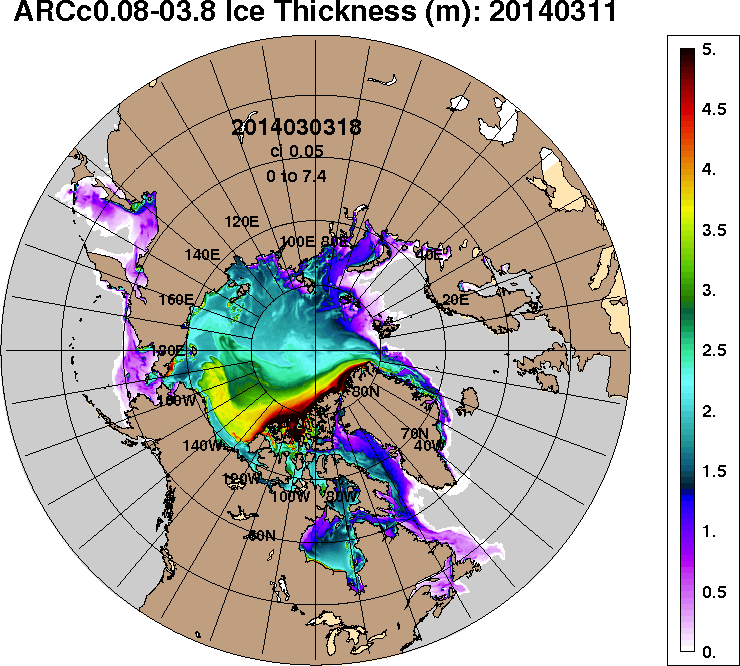
The dirty little secret of Arctic sea ice, is that it is controlled by winter winds – not temperature. Over the last few years, the older thicker ice has pushed into the Beaufort Sea where it survives the winter and slows summer melt. Thus the Arctic continues to “recover.”
ACNFS forecast for Arctic sea ice thickness on March 11th 2014
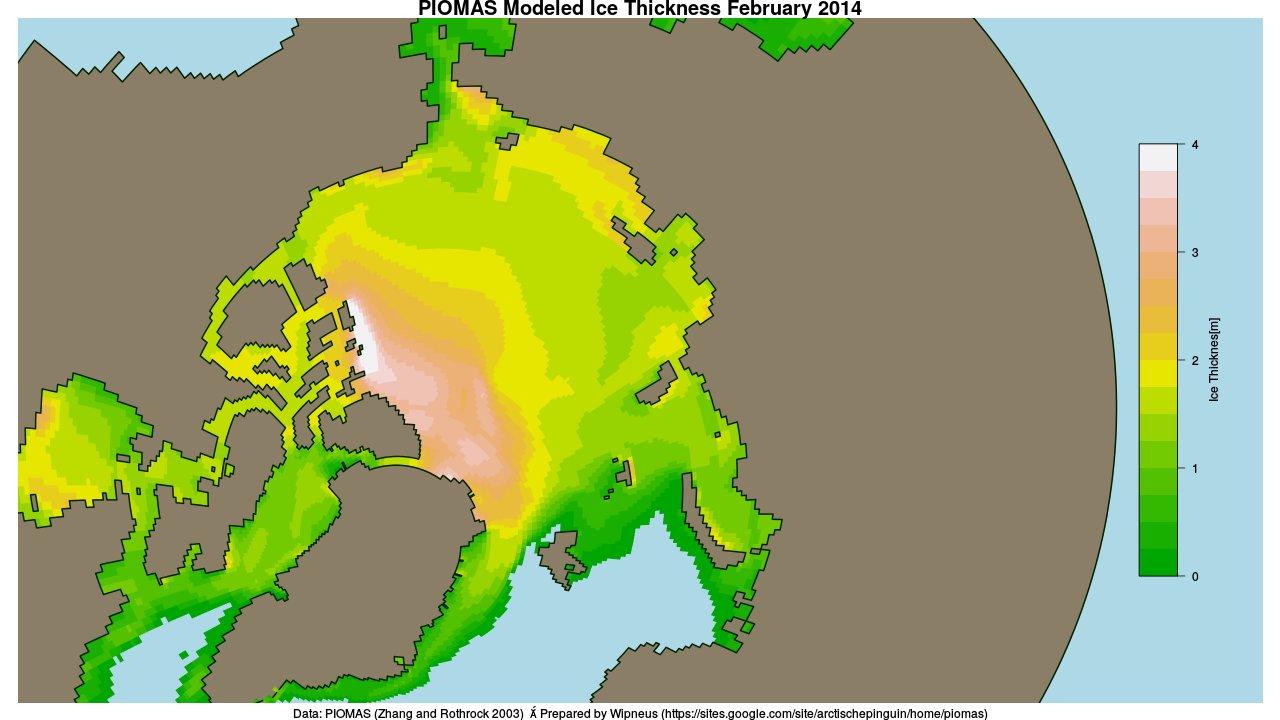
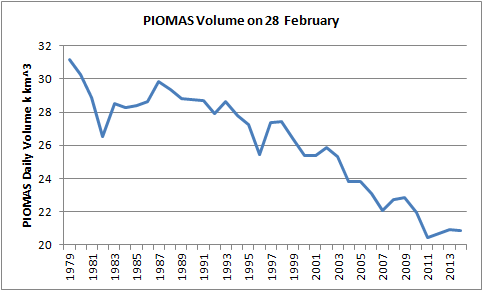
Actually the Arctic doesn’t “continue to recover”. Whilst a bit hard to see on their rather cluttered chart the latest PIOMAS Arctic sea ice volume estimates show that the so called “recovery” had almost completely “melted away” by the end of February:
PIOMAS Arctic sea ice volume on February 28th from 1979-2014
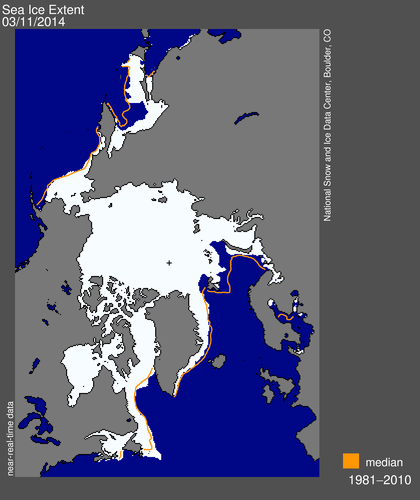
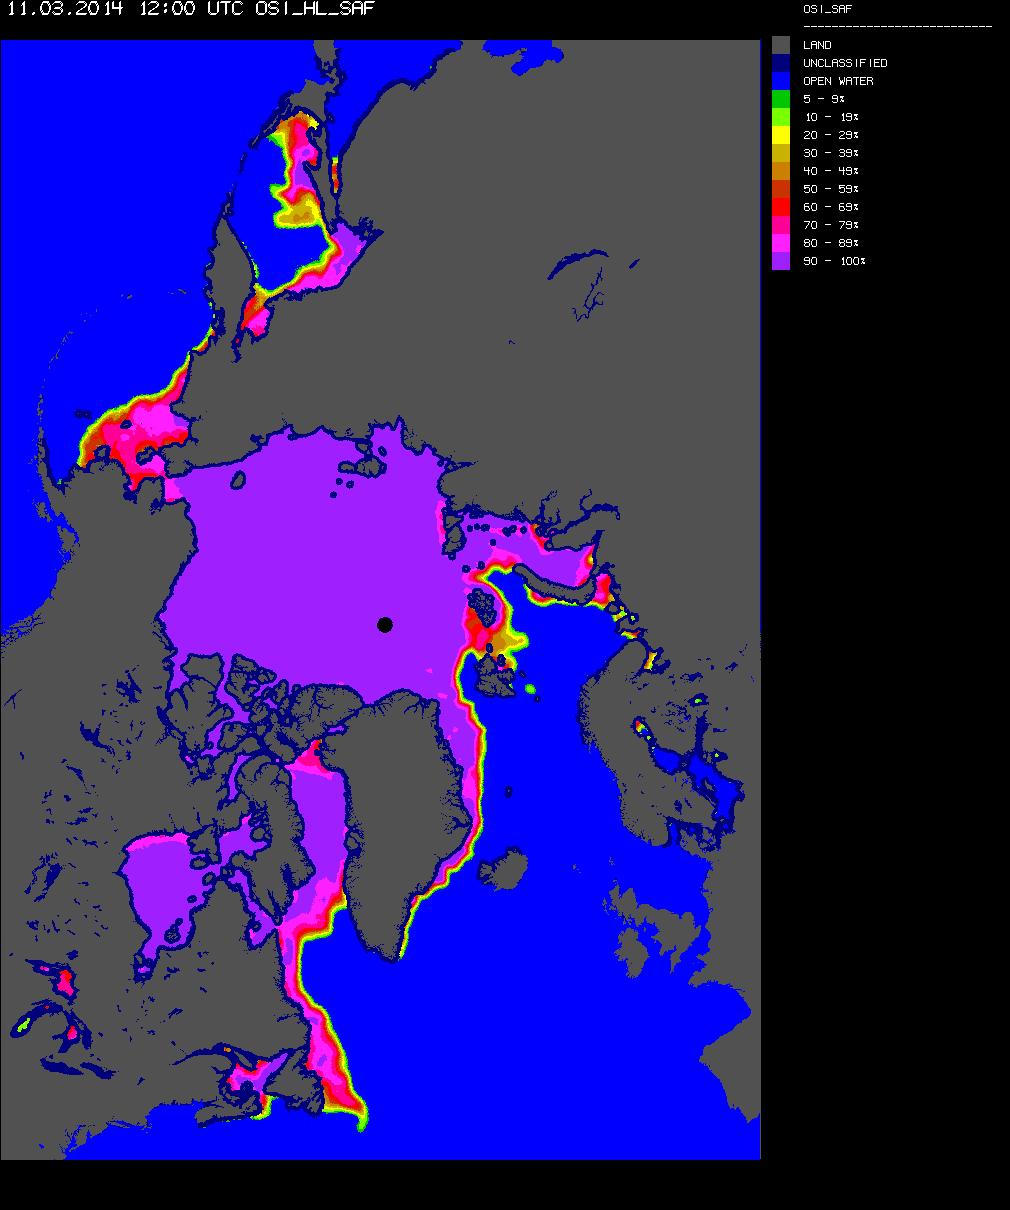
NSIDC visualisation of Arctic sea ice daily extent for March 6th 2014
Us:
Here’s the thing (well, 2 things actually)
1. Steve’s “map” shows the NSIDC Arctic sea ice extent, but you make no mention of it. Perhaps that’s because that particular metric is currently at the lowest it has ever been on this day of any year since the satellites started attempting to measure it? How on Earth can he possibly characterize that as any sort of “recovery”?
2. Surely the very title of this thread (“ice cube”) implies a volume, does it not? I believe Steve’s an engineer, and so he is presumably well aware that a square and a cube are completely different kettles of fish (metaphorically speaking)? All that being the case, why on Earth would Steve choose to illustrate his point with a “map” of ice extent instead of a “graph” of ice volume?
For the moment we rest our case, but rest assured that there is plenty more where this lot came from!
This website uses cookies to improve your experience. We'll assume you're ok with this, but you can opt-out if you wish. Cookie settingsACCEPT
Privacy & Cookies Policy
Privacy Overview
This website uses cookies to improve your experience while you navigate through the website. Out of these, the cookies that are categorized as necessary are stored on your browser as they are essential for the working of basic functionalities of the website. We also use third-party cookies that help us analyze and understand how you use this website. These cookies will be stored in your browser only with your consent. You also have the option to opt-out of these cookies. But opting out of some of these cookies may affect your browsing experience.
Necessary cookies are absolutely essential for the website to function properly. This category only includes cookies that ensures basic functionalities and security features of the website. These cookies do not store any personal information.
Any cookies that may not be particularly necessary for the website to function and is used specifically to collect user personal data via analytics, ads, other embedded contents are termed as non-necessary cookies. It is mandatory to procure user consent prior to running these cookies on your website.