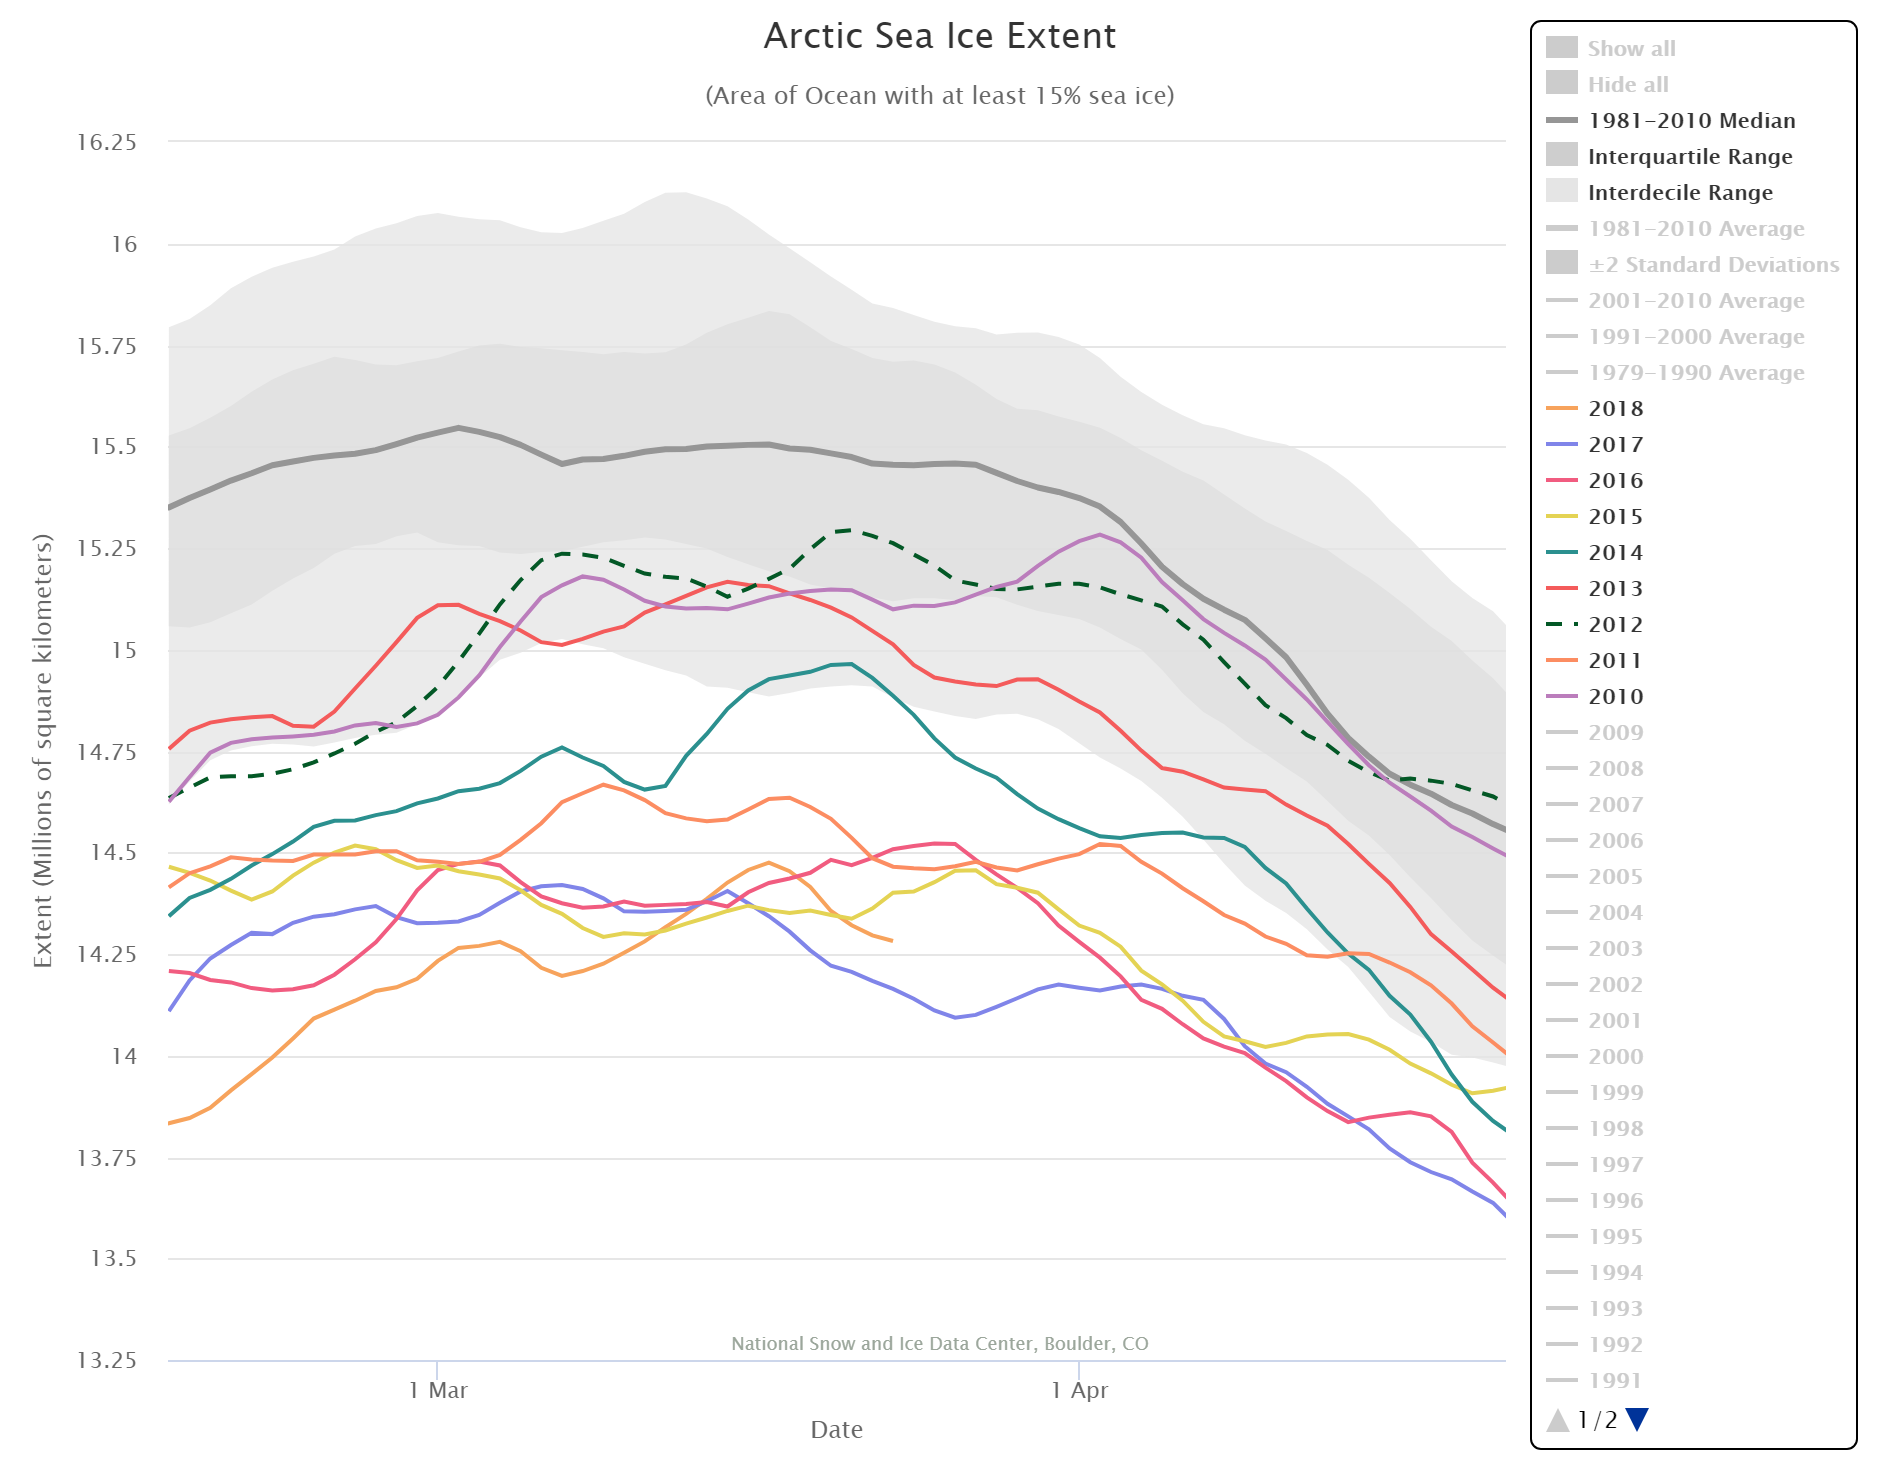
According to the latest edition of the National Snow and Ice Data Center’s “Arctic Sea Ice News”
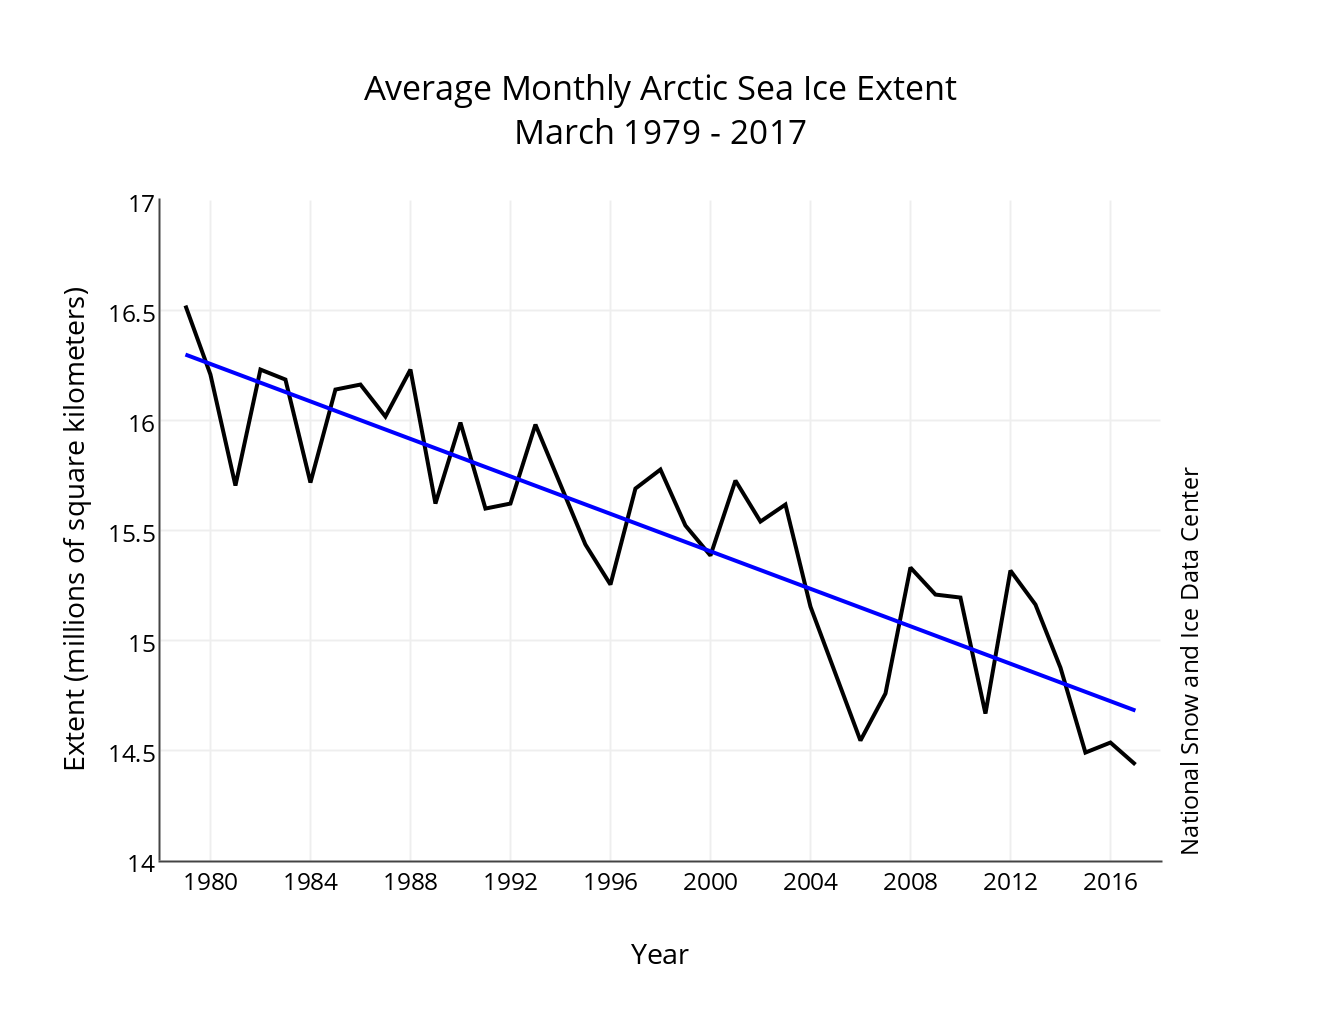
On March 17, 2018, Arctic sea ice likely reached its maximum extent for the year, at 14.48 million square kilometers (5.59 million square miles), the second lowest in the 39-year satellite record, falling just behind 2017. This year’s maximum extent is 1.16 million square kilometers (448,000 square miles) below the 1981 to 2010 average maximum of 15.64 million square kilometers (6.04 million square miles).
The four lowest seasonal maxima have all occurred during the last four years. The 2018 maximum is 60,000 square kilometers (23,200 square miles) above the record low maximum that occurred on March 7, 2017.
Here’s a close up view of recent maxima via the NSIDC’s Charctic interactive sea ice graph:
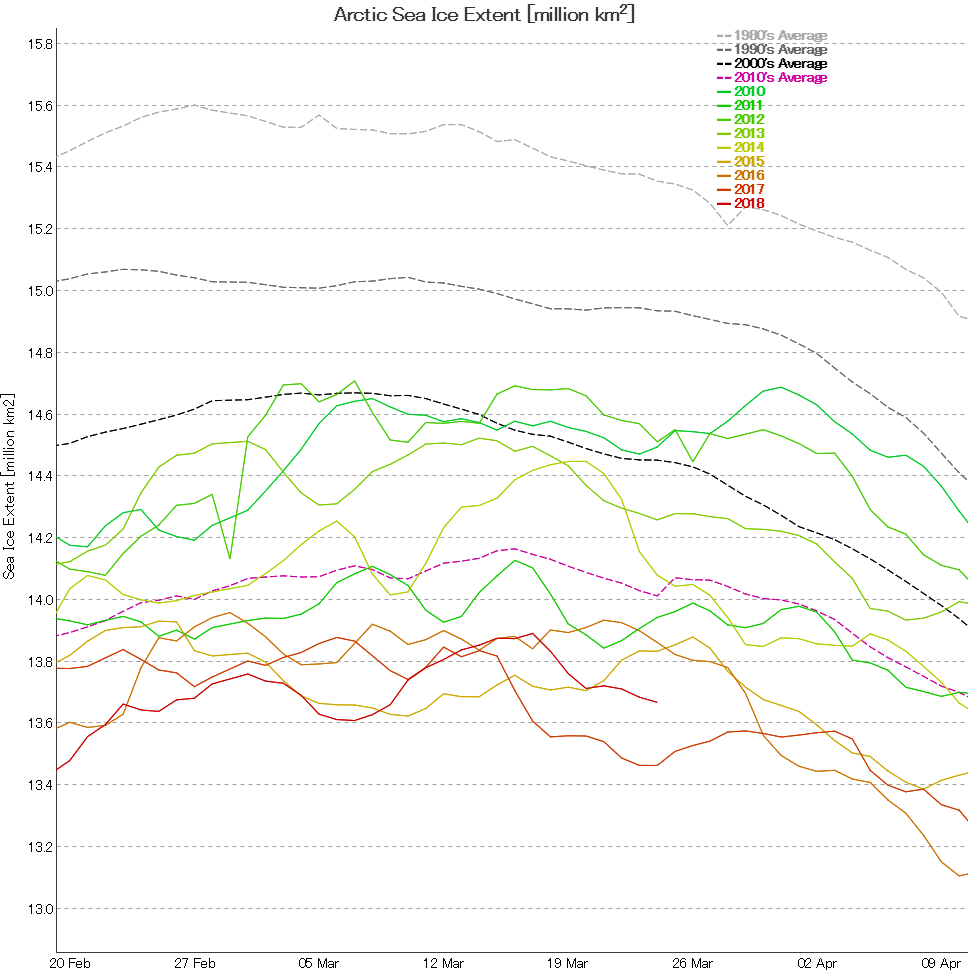
Next let’s take a look at extent data from the Japanese National Institute of Polar Research, colloquially referred to as “JAXA extent”
In this case the maximum was 13.89 million square kilometers, also on March 17th.
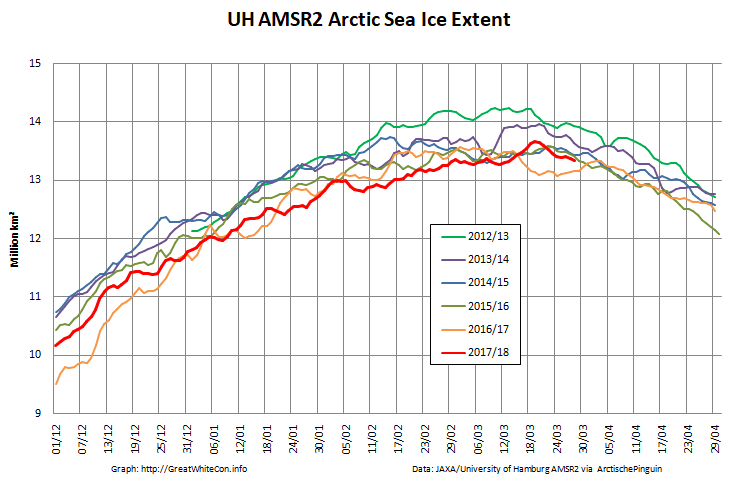
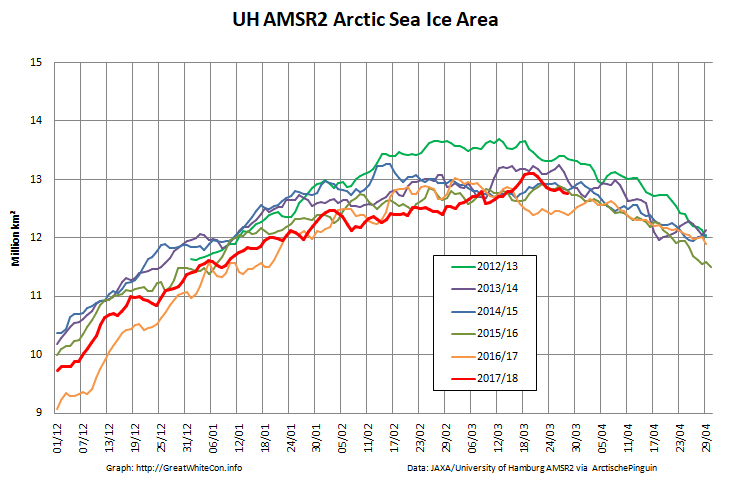
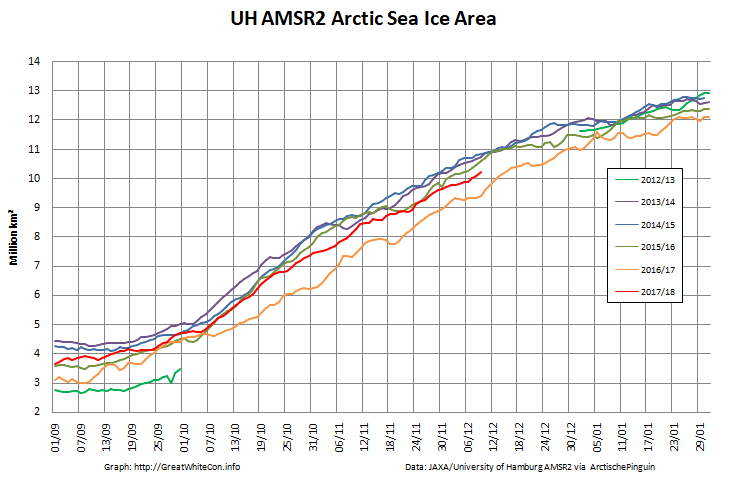
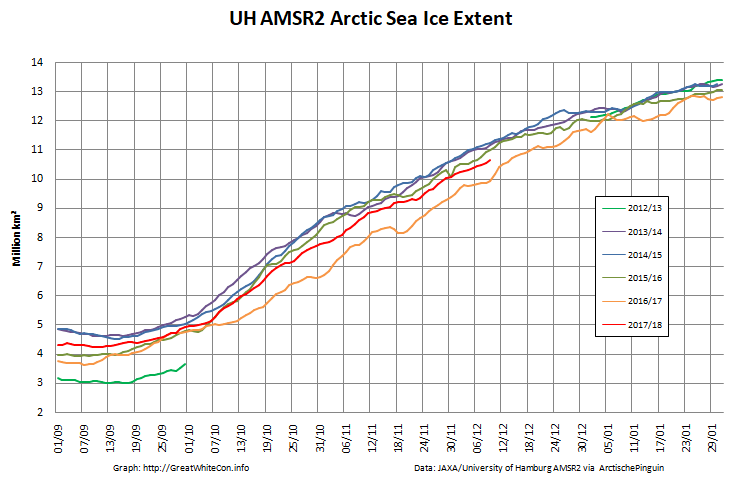
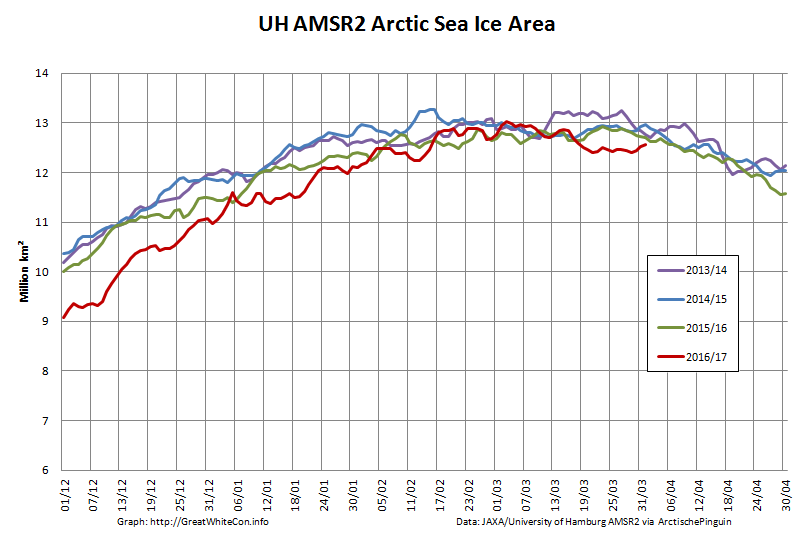
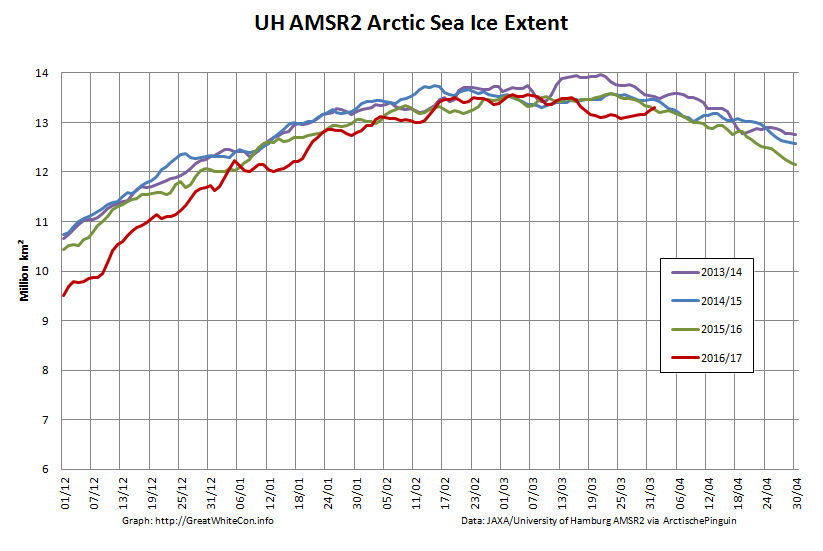
Here too are the extent and area graphs based on Wipneus’ processing of the University of Hamburg’s AMSR2 based concentration data:
They highlight the surge in Arctic sea ice area in the middle of March due to the sudden “cold snap”:
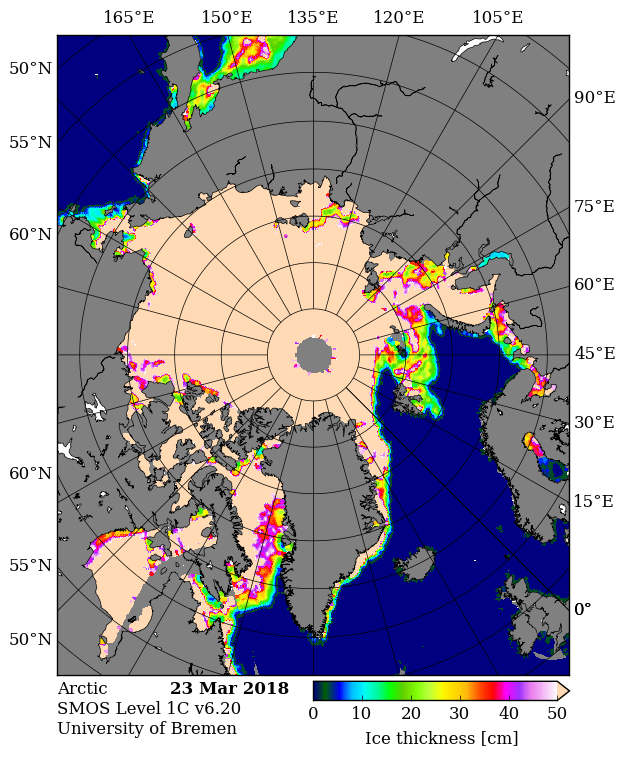
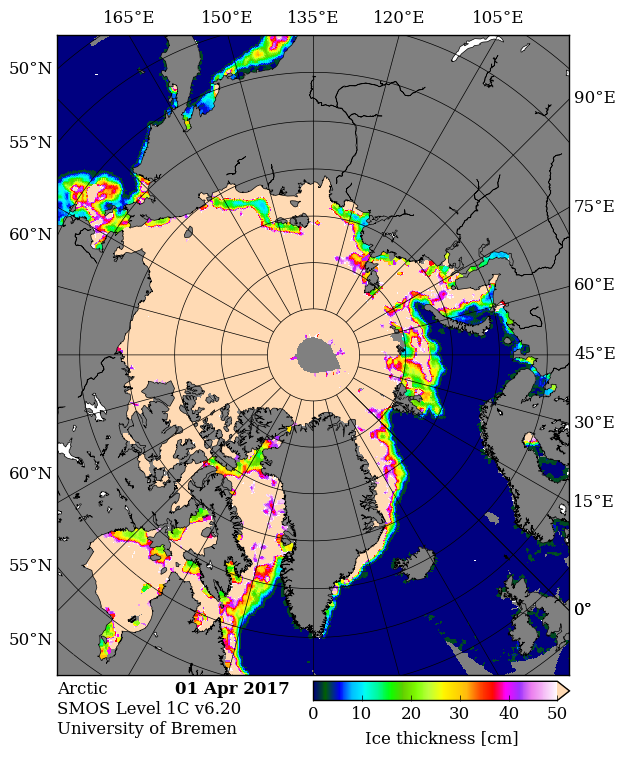
Looking at the third Arctic dimension, here’s the latest SMOS thickness map from the University of Bremen:
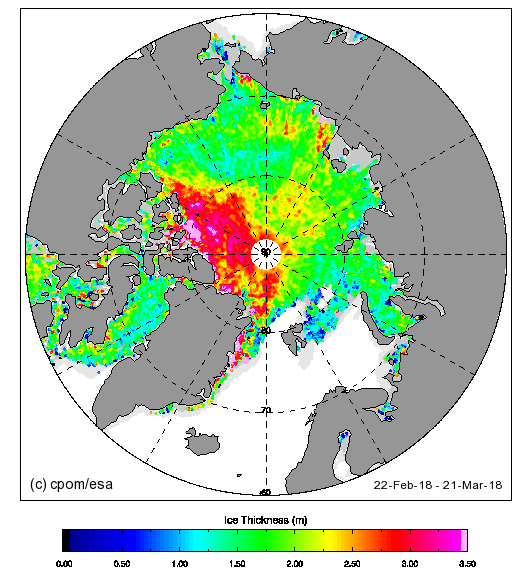
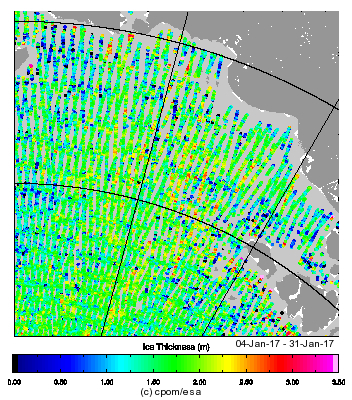
and here’s the latest CryoSat-2 thickness map:
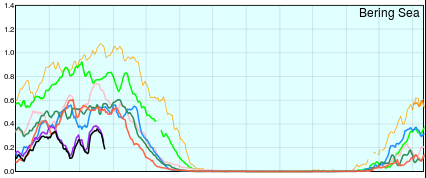
They reveal large areas of relatively thin sea ice in the Okhotsk and Barents Seas where the ice can now be expected to melt as quickly as it formed. There is also remarkably little sea ice in the Bering Sea for the time of year:
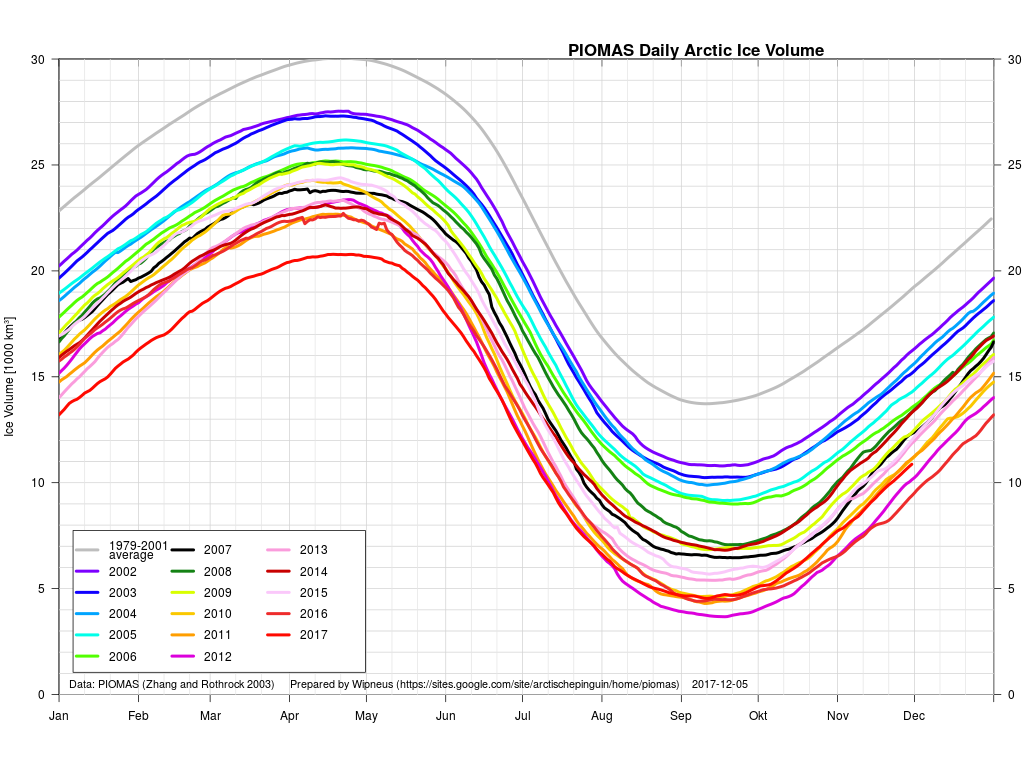
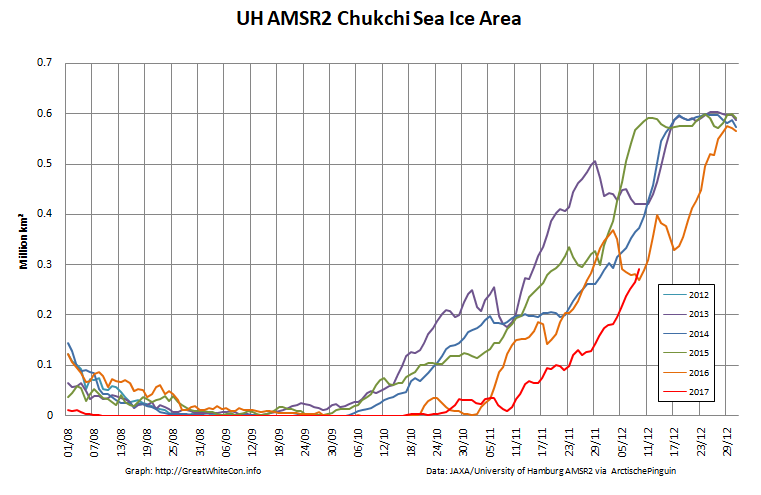
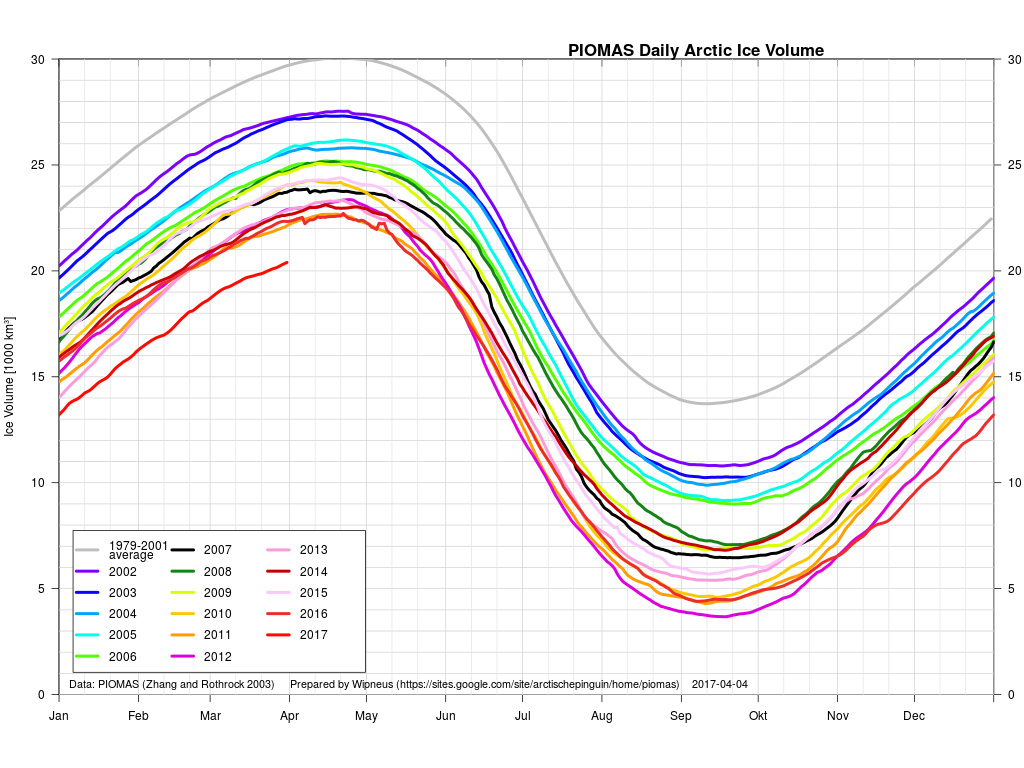
Christmas is coming, and Santa’s secret summer swimming pool has frozen over once again. However the same can’t be said for the Chukchi Sea! More on that in due course, but first let’s take a look at the PIOMAS volume graph at the end of November, courtesy of the wondrous Wipneus on the Arctic Sea Ice Forum:
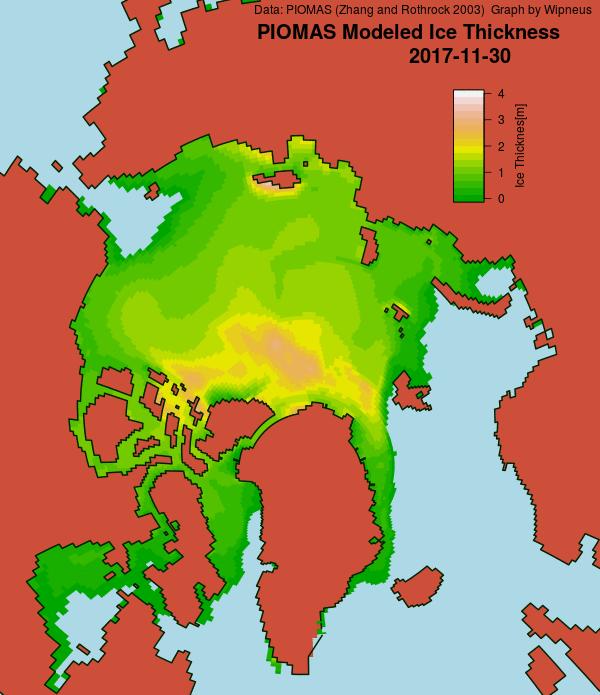
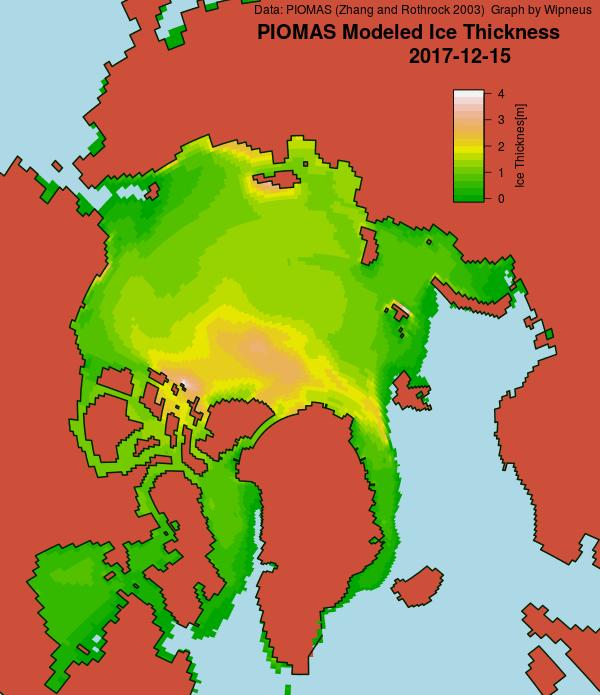
2017 is currently third lowest, behind 2012 and 2016. Next let’s take a look at Wipneus’ PIOMAS Arctic sea ice thickness map:
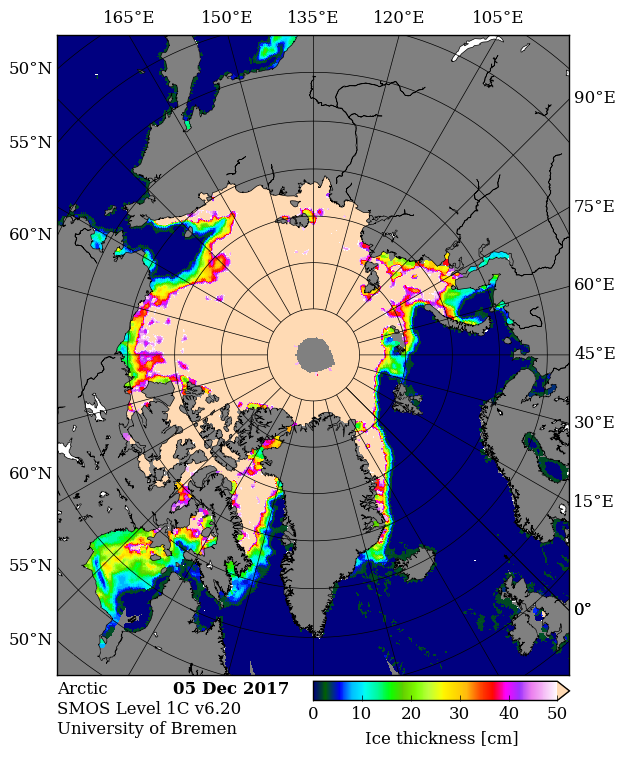
followed by the University of Bremen’s SMOS Arctic sea ice thickness map:
Note the large area of pale blue open ocean still visible in the Chukchi Sea towards the top left of both maps.
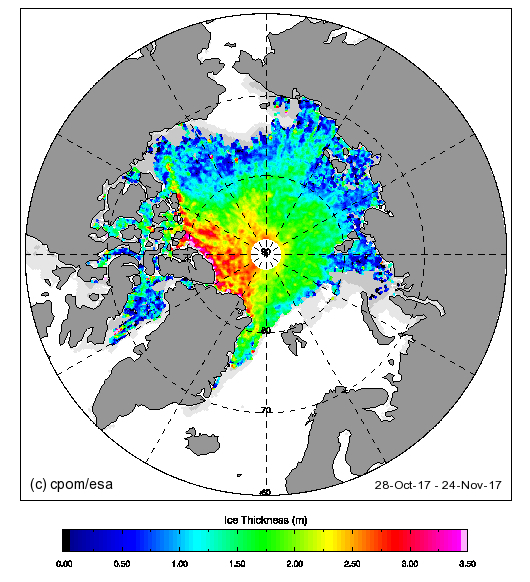
For another perspective on Arctic sea ice thickness here’s the latest Cryosat-2 map, which currently is based on the month up to November 24th:
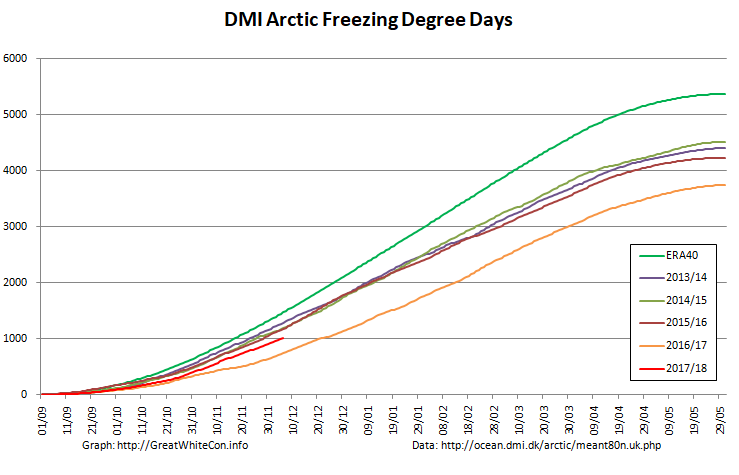
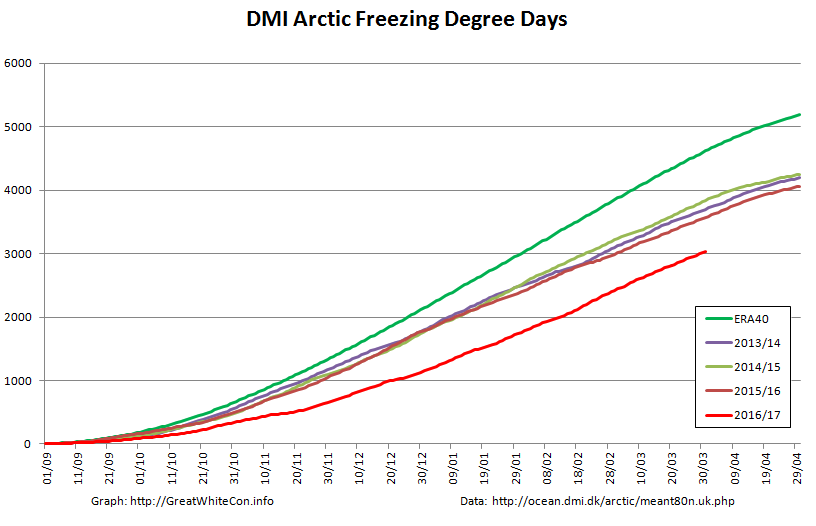
Finally, for the moment at least, here’s our very own Arctic Freezing Degree Days graph based on the DMI’s >80N data:
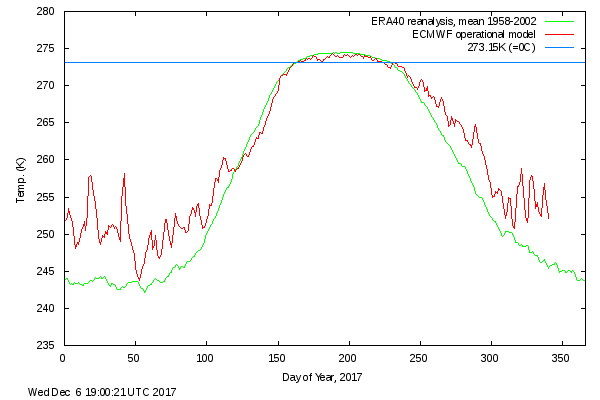
2017 is currently occupying the wide open space between the astonishingly low numbers last year and all previous years in DMI’s record. Here’s their graph for 2017 so far:
[Edit – December 10th]
Current Arctic sea ice area and extent derived from the University of Hamburg’s high resolution AMSR2 data:
Plus the latest update on the Chukchi Sea situation:
Particularly in view of all the balderdash concerning “climate science” being spouted in Washington DC on Wednesday lets first of all run through some Arctic sea ice facts from April 1st 2017 or thereabouts:
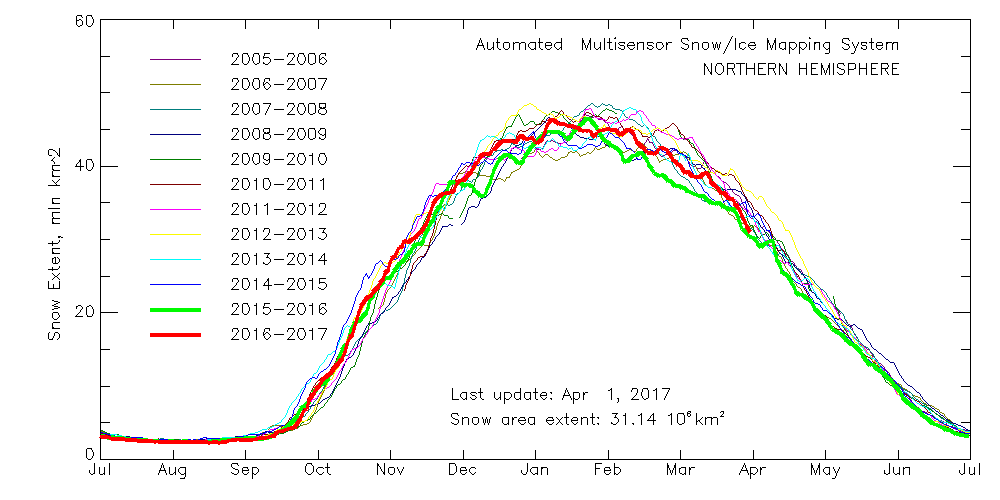
Northern Hemisphere Snow Extent:
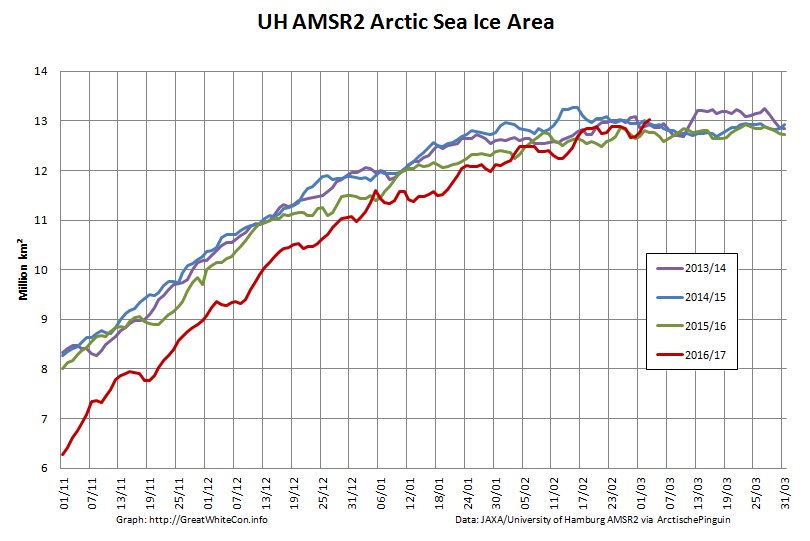
Arctic Sea Ice Area:
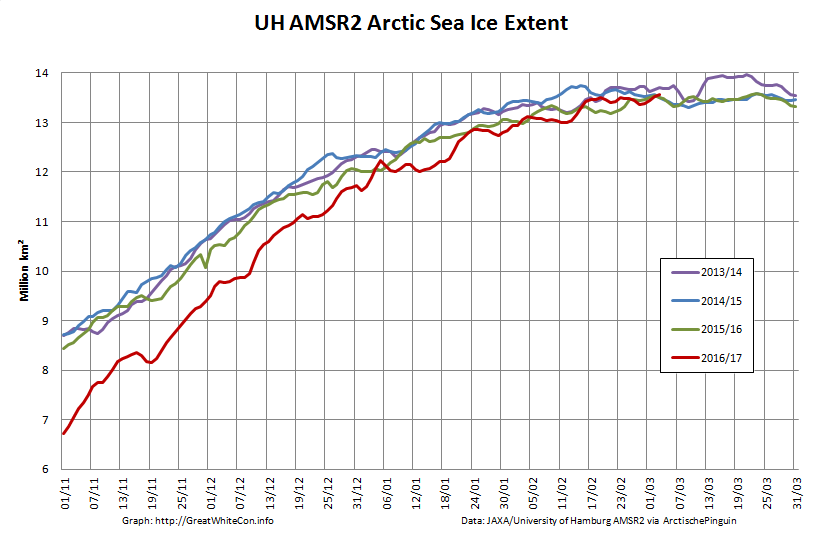
Arctic Sea Ice Extent:
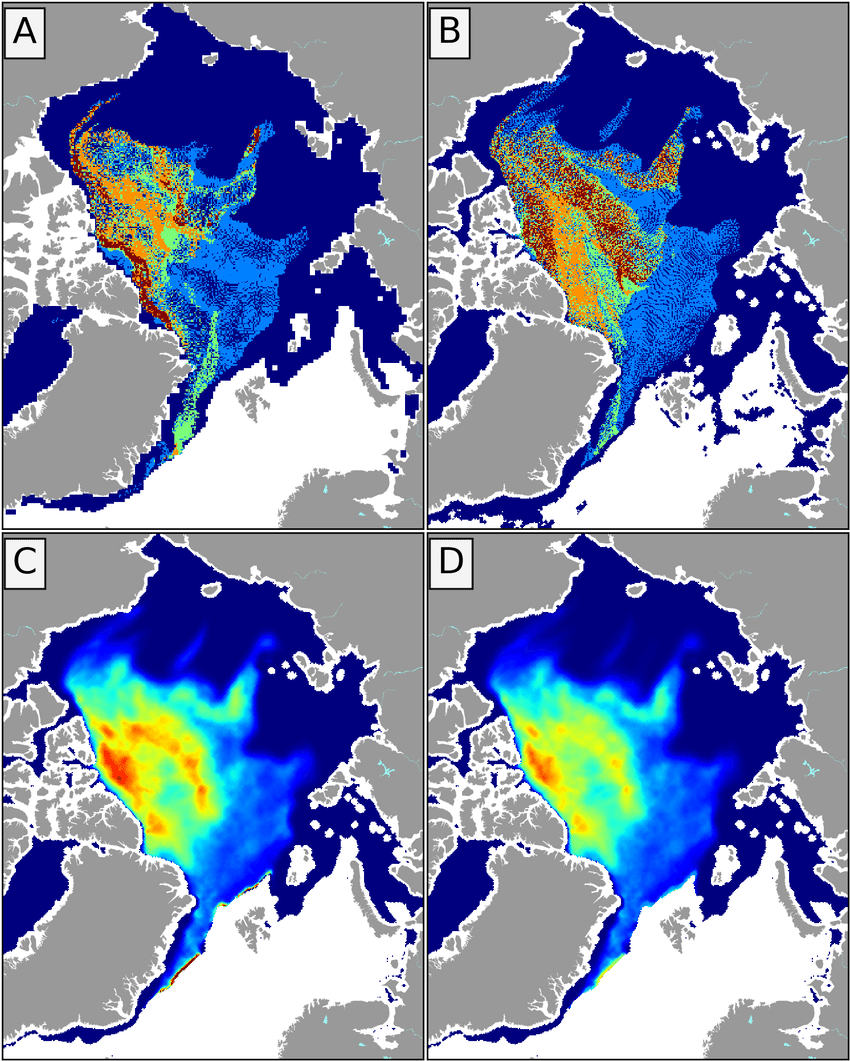
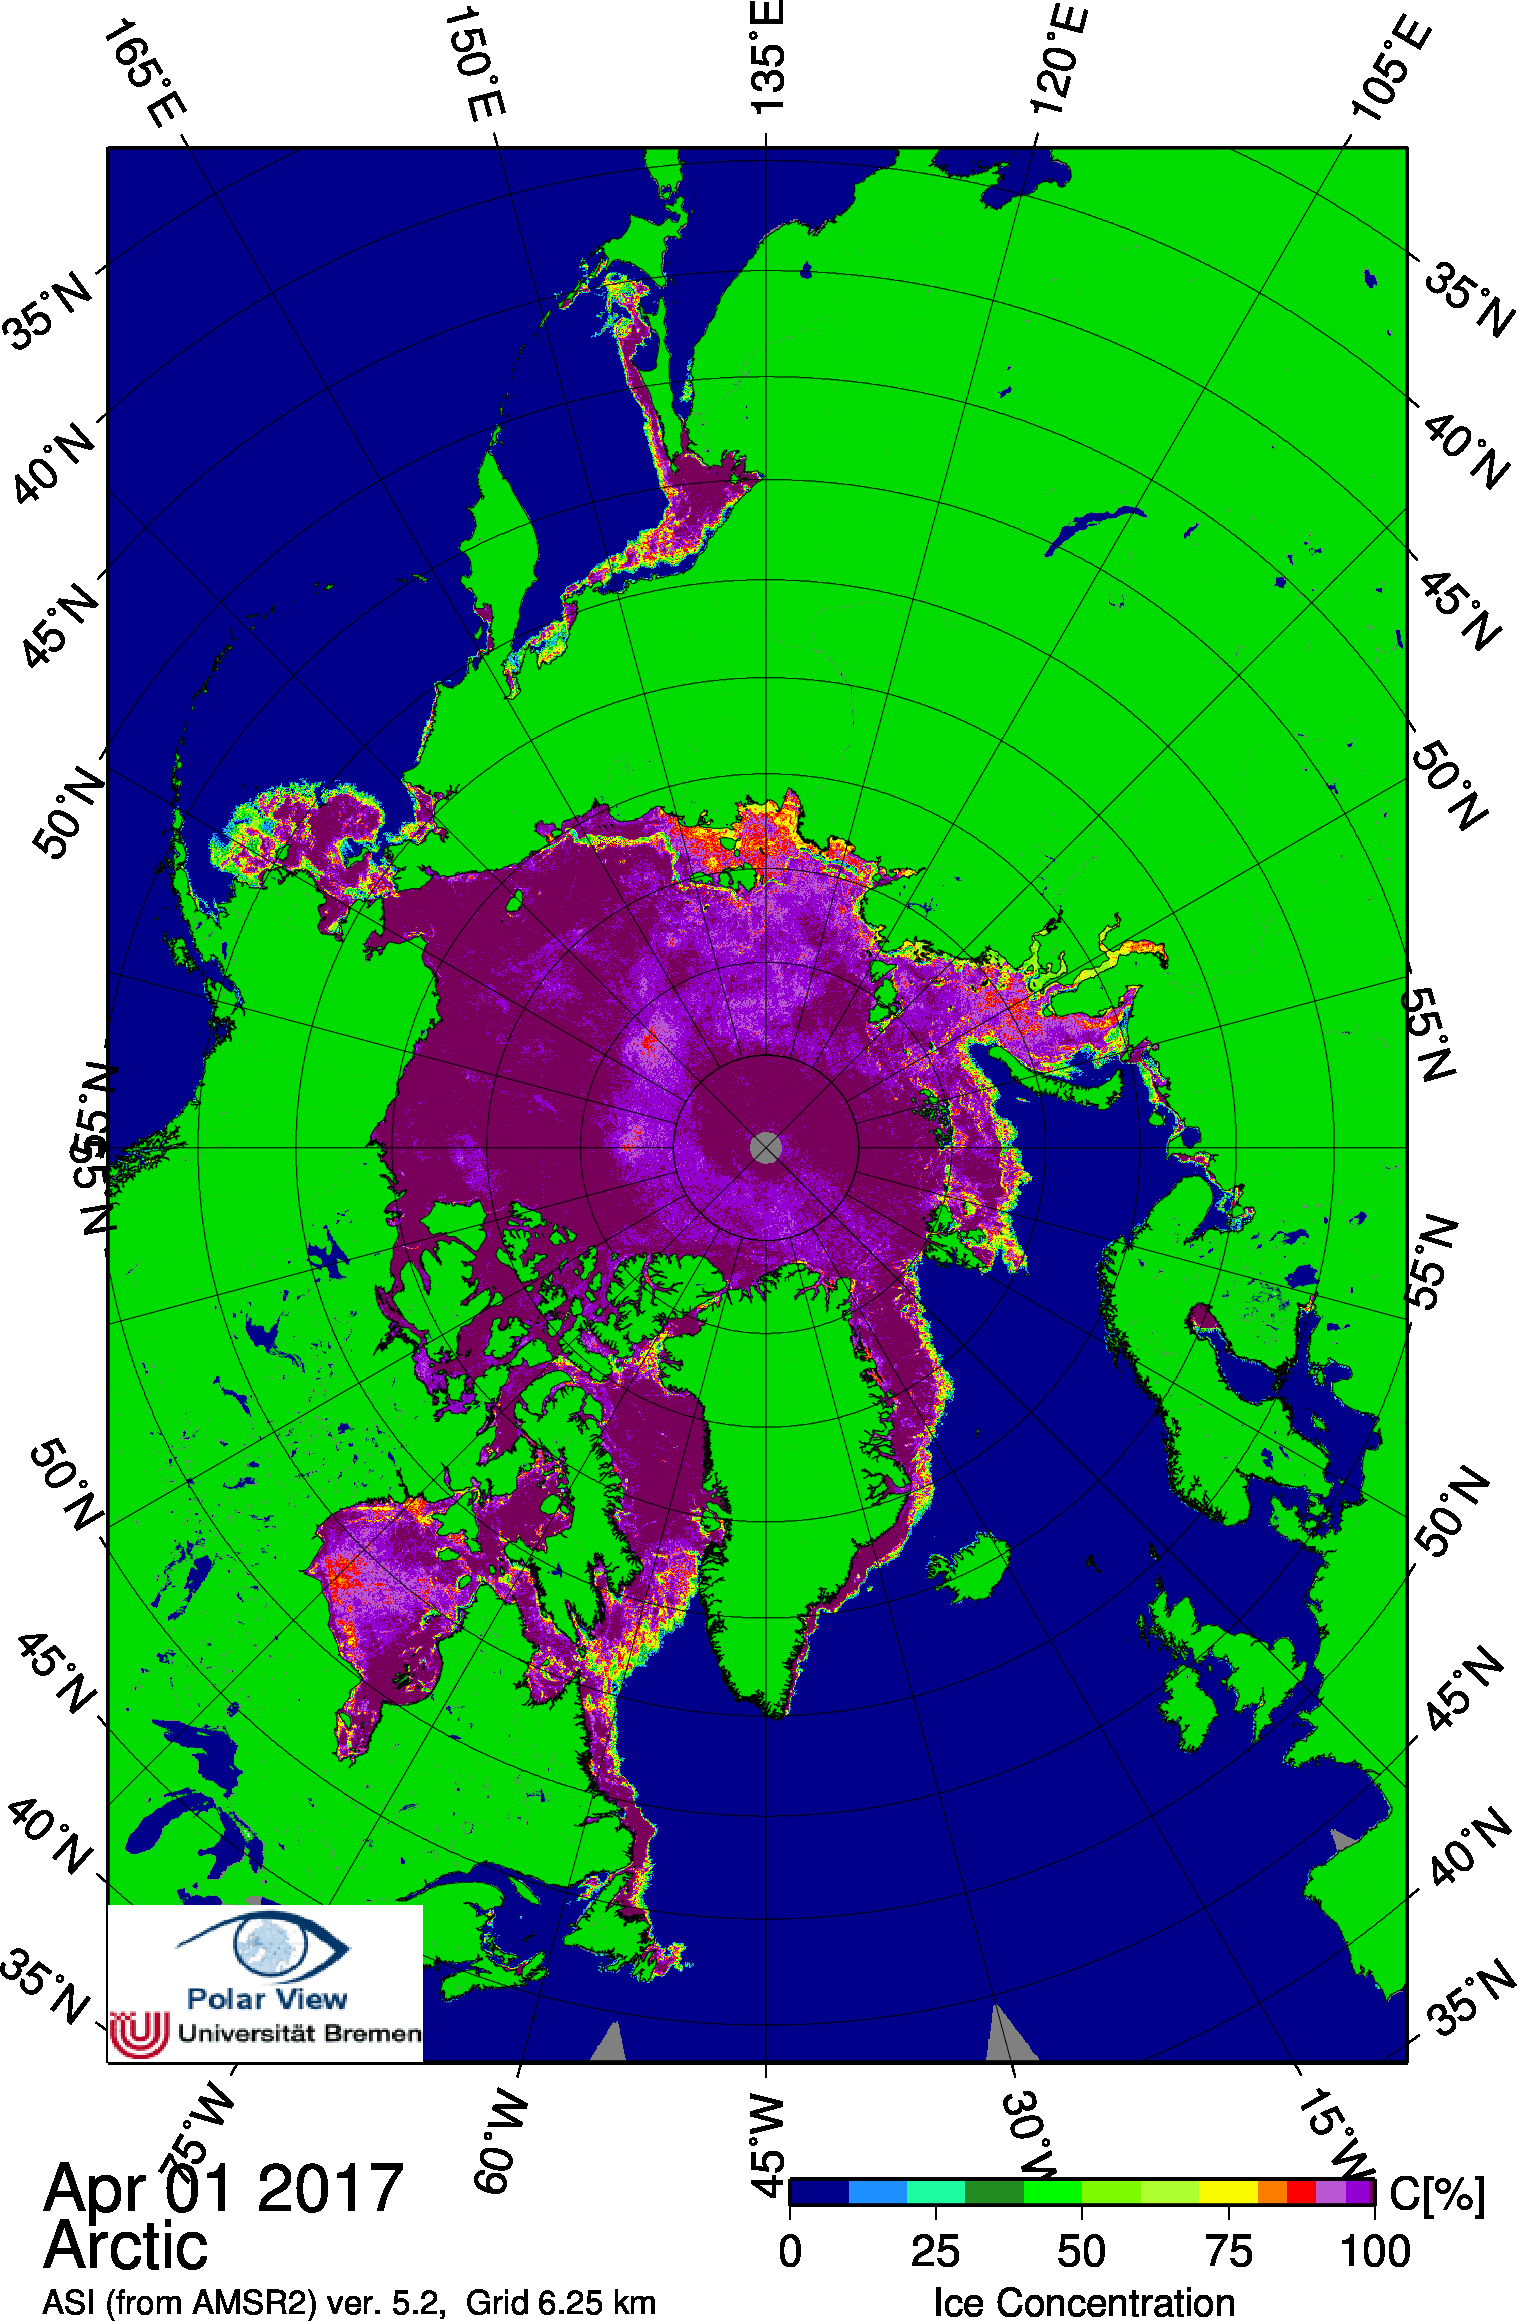
Arctic Sea Ice Concentration:
Thin ice map from the University of Bremen SMOS:
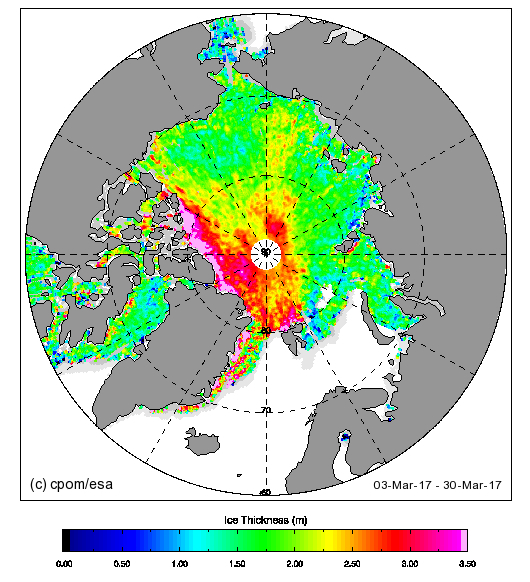
Thick ice map from CPOM CryoSat-2
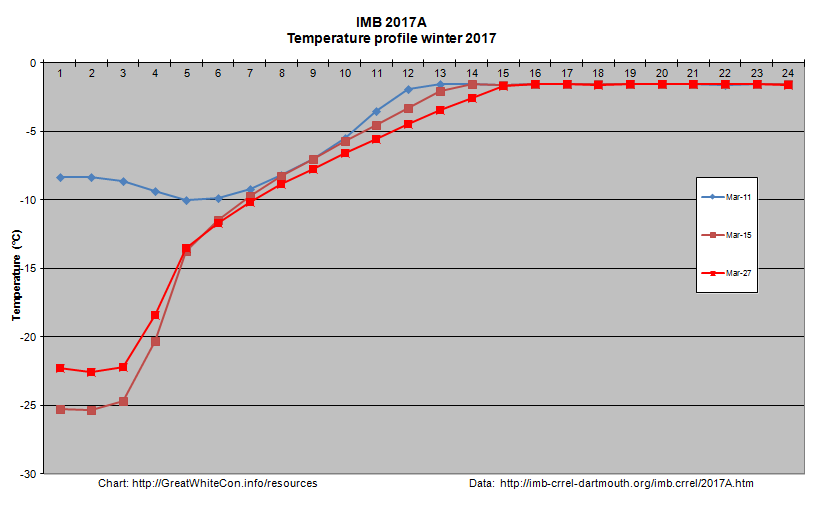
Beaufort Sea ice thickness growth graph:
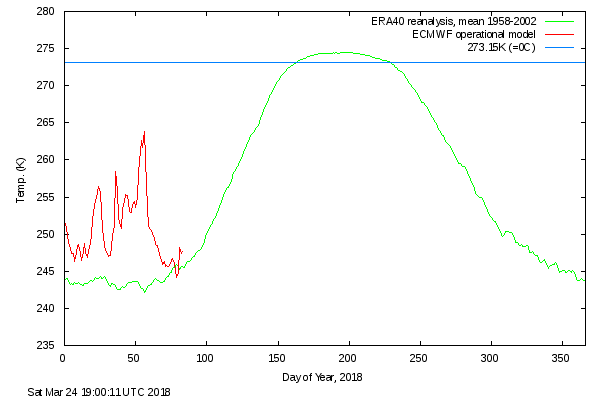
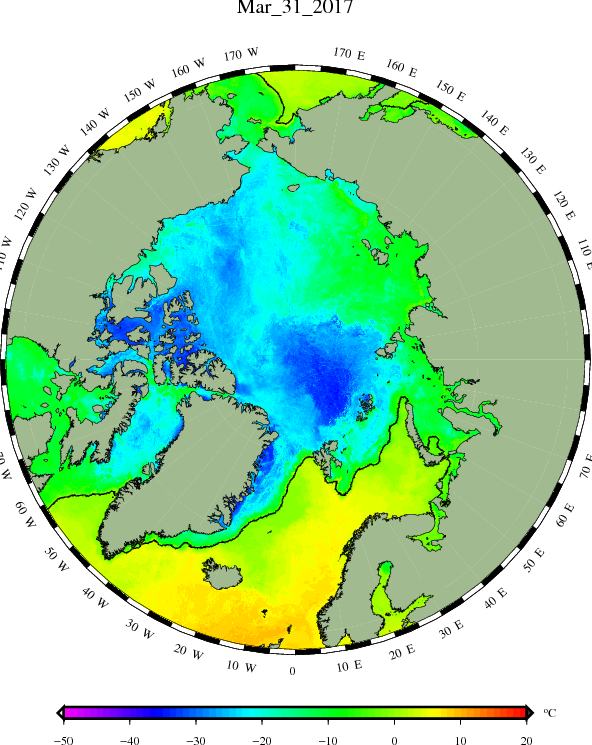
DMI sea ice temperature map:
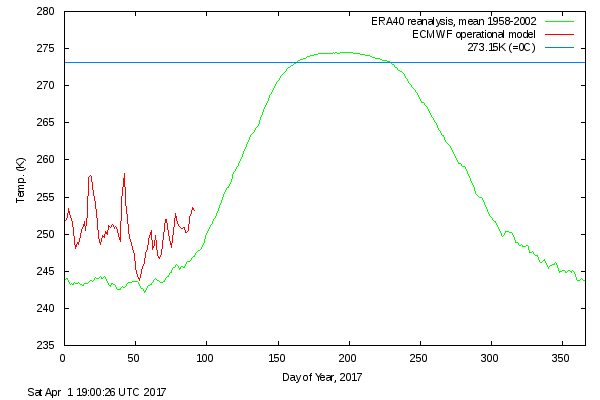
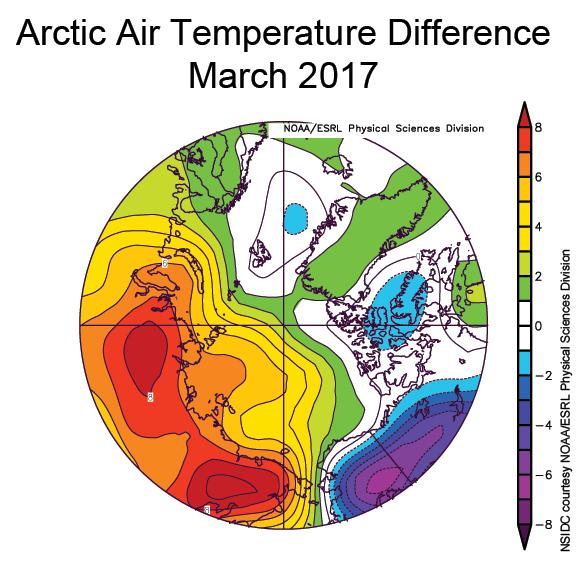
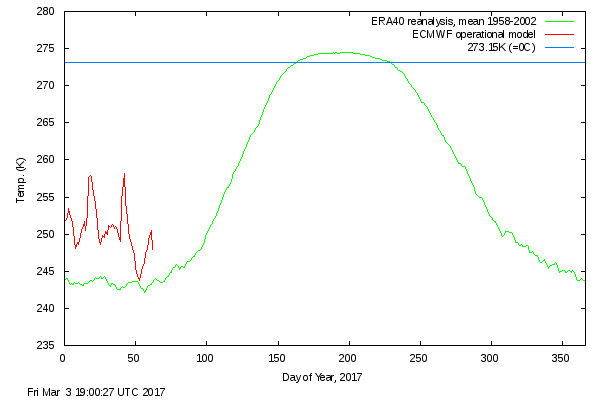
DMI atmospheric temperature graph:
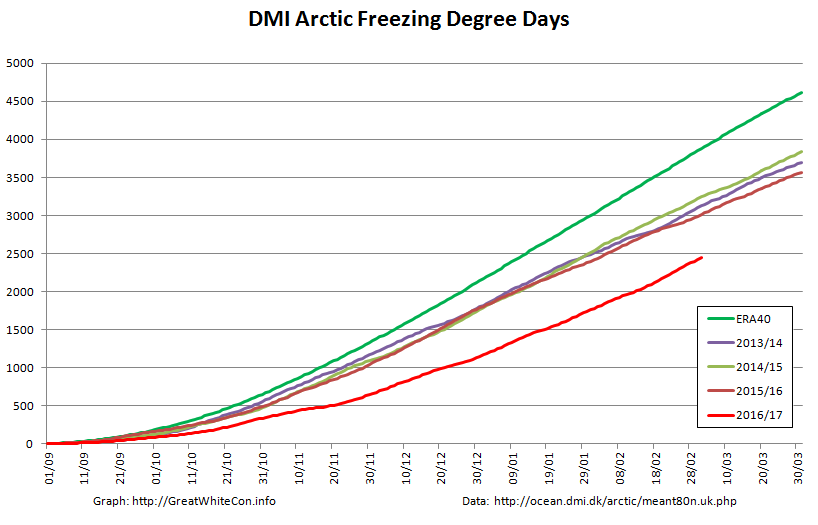
DMI Arctic Freezing Degree Days:
PIOMAS volume for March will follow in a few days, but it’s extremely unlikely to be anything other than “lowest for the date”.
What preliminary conclusions can we draw from this plethora of pretty pictures? First of all the Arctic hasn’t suddenly gone into “deep freeze” mode. Temperatures above 80 degrees north are rising again and are well above the climatology. Freezing degree days are still the lowest on record by a wide margin. Northern hemisphere snow cover is falling fast and is currently just above last year.
In contrast to last year, and thanks to lots of cyclones and very little in the way of anticyclones, there’s plenty of sub half meter sea ice in the Laptev and East Siberian Seas and hardly any in the Beaufort Sea. There’s also plenty of thin ice to be seen on both the Atlantic and Pacific peripheries.
The usual southerly arch hasn’t formed in the Nares Strait between Greenland and Ellesmere Island, and as SMOS shows the sea ice in the strait is consequently very thin. That leads one to wonder when the northern arch in the Lincoln Sea might give way.
It’s not immediately apparent from the still images above, but there’s been relatively large amounts of “old ice” exported from the Central Arctic on the Atlantic side, hence the recent increase in overall extent which is now second lowest for the date (since satellite records began). Area has been creeping up as well over recent days, but is still lowest for the date, as it has been for most of the last year. Sea ice “compactness” has decreased somewhat and given all the thin ice around the edges extent will soon start dropping once again.
All in all, the Arctic sea ice prognosis is not good. Are you watching Lamar Smith? (Pun intended!)
[Edit – April 4th]
The March PIOMAS update is out! As suspected, Arctic sea ice volume is still by far the lowest on record:
Volume on March 31st 2017 was 20.398 thousand cubic kilometers. The previous lowest volume for the date was 22.129 thousand km³ in 2011.
Here too is the PIOMAS modelled Arctic sea ice thickness map:
PIOMAS daily gridded thickness for March 31st 2017
[Edit – April 12th]
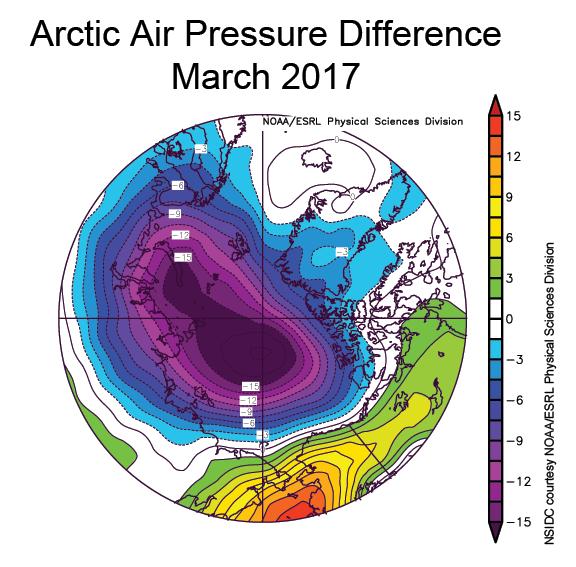
The latest edition of the NSIDC’s Arctic Sea Ice News confirms that their monthly extent metric for March 2017 was the lowest in the satellite record for the month:
As well as highlighting the anomalously warm temperatures across much of the Arctic:
the NSIDC article includes this telling pressure anomaly map:
New work by an international team led by Igor Polyakov of the University of Alaska Fairbanks provides strong evidence that Atlantic layer heat is now playing a prominent role in reducing winter ice formation in the Eurasian Basin, which is manifested as more summer ice loss. According to their analysis, the ice loss due to the influence of Atlantic layer heat is comparable in magnitude to the top down forcing by the atmosphere.
Our old friend Tony Heller has been publishing a glorious Gish gallop of articles showing OSI-SAF Arctic sea ice type maps and claiming amongst other things:
A decade after declaring the end of Arctic multi-year sea ice, it has increased 116% and now covers nearly half of the Arctic.
That is of course not true. In actual fact it’s an “alternative fact” par excellence!
I have been endeavouring to point out to Tony the error of his ways for weeks now, but my words have wisdom have fallen on deaf ears. My graphic graphics have been viewed only by “snow blind” eyes. My incontrovertible arguments have been misapprehended by purpose built dumb and dumberer wetware illogic. By way of example, here’s a refreshingly ad hom free riposte from a typical commenter:
Jimmy Boy actually thinks his honesty and integrity are equally to that of Anthony Watts???
No doubt we’ll get around to discussing Anthony Watts “honesty and integrity” again soon, but for now let’s see if we can finally set this particular badly warped record straight shall we?
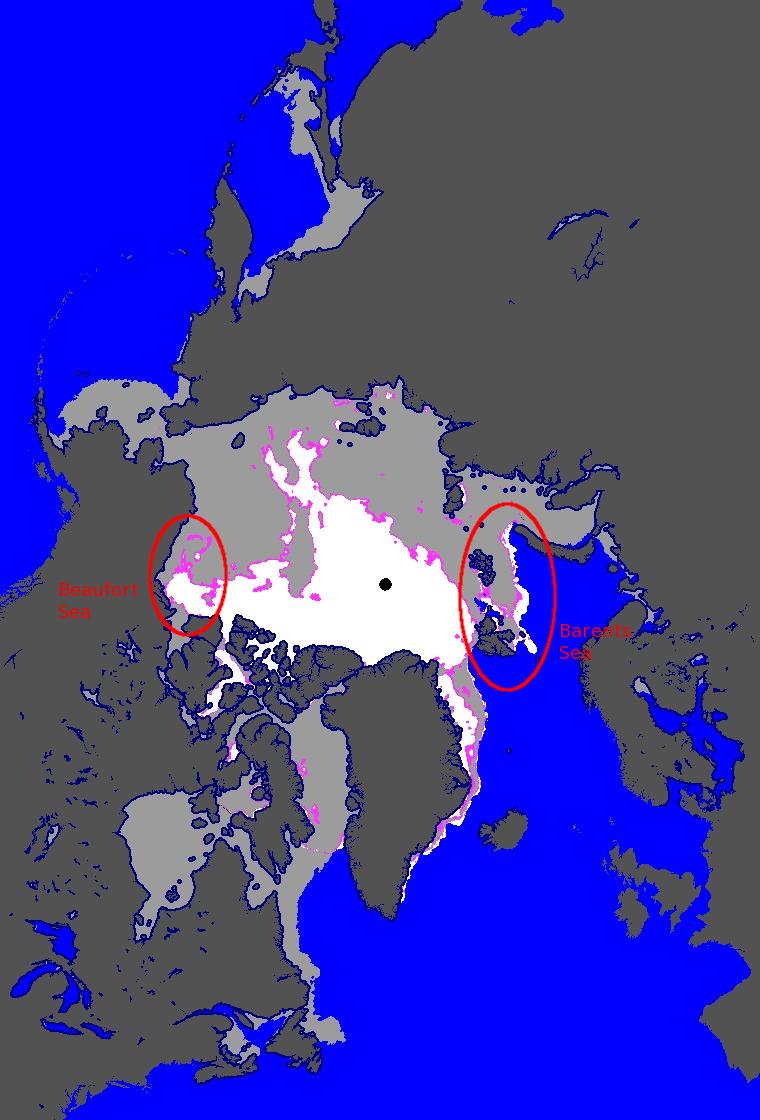
Here is the latest OSI-SAF ice type map, for March 16th 2017:
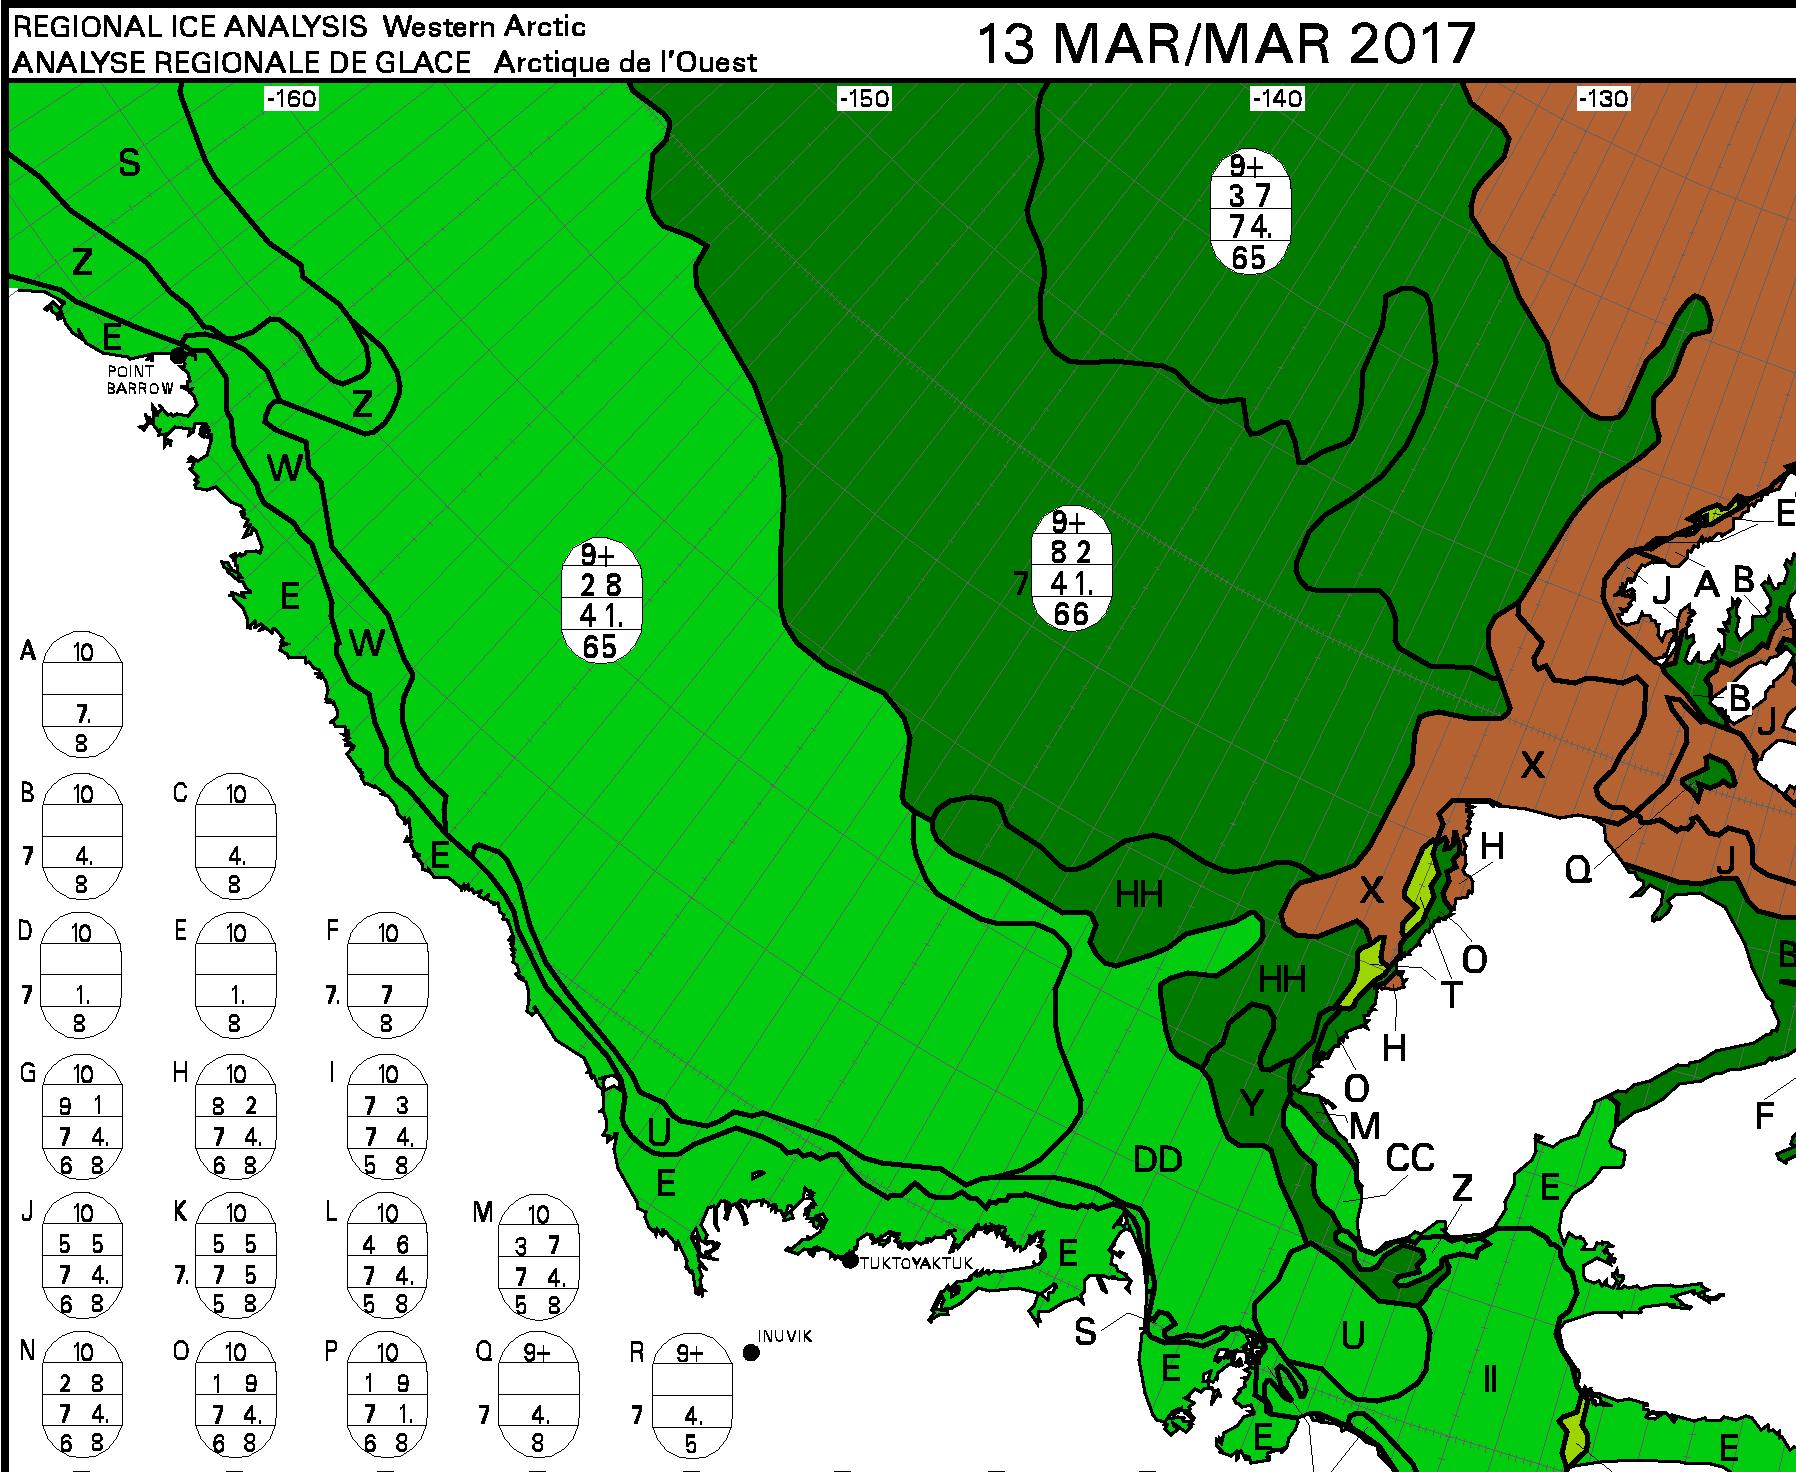
The highlighted area on the left is the Beaufort Sea to the north of Canada. If you’re not “snow blind” you can no doubt readily perceive a large area of allegedly “multi-year sea ice” coloured white. Let’s now take a look at the most recent Canadian Ice Service map of the same area, for March 13th 2017:
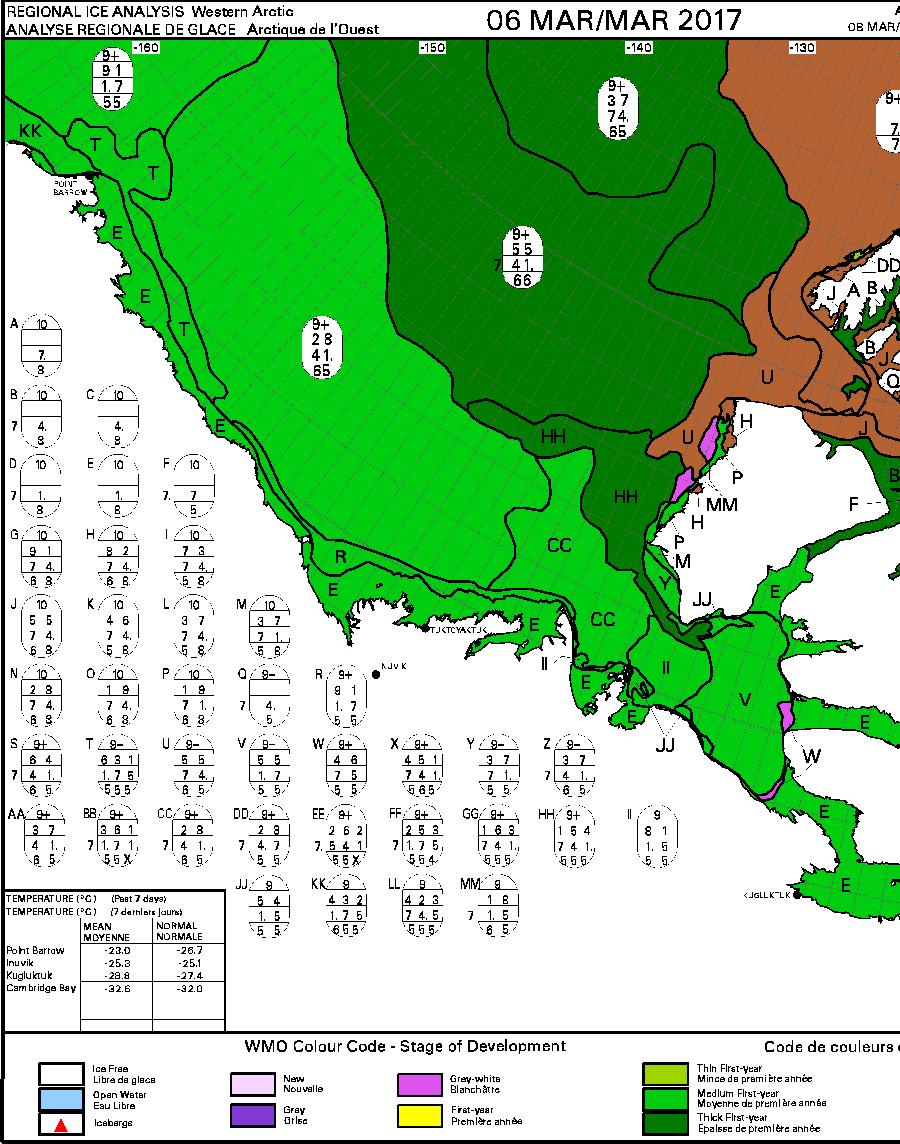
Canadian Ice Service sea ice stage of development on March 13th 2017
Can you see a large area of brown “old ice” covering most of the surface of the Beaufort Sea?
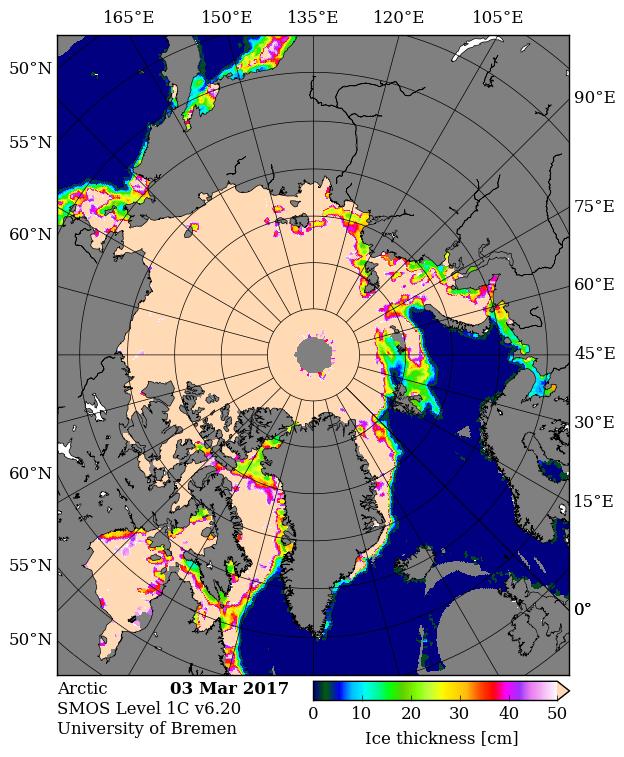
Now let’s take a look on the other side of the Arctic at the area north of the Barents Sea. Can you see a large area of allegedly “multi-year sea ice” coloured white inside the red ellipse on the OSI-SAF map? Next let’s take a look at the most recent University of Bremen SMOS map of the Arctic, for March 15th 2017:
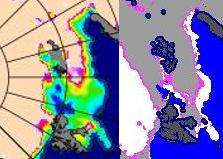
On this map the brightly coloured areas show sea ice that’s less than 50 cm thick. Even when two people explain this point slowly to them the “deplorable denizens” at Mr. Heller’s blog do not manage to get the message! So now let’s look at a closeup comparison between the OSI-SAF ice type map and the University of Bremen SMOS sea ice thickness map:
As I popped the question to the deplorable denizens over on Tony Heller’s Deplorable Climate Science blog:
For anybody else here who isn’t deaf, dumb and blind, please note all the young, thin sea ice around Svalbard identified by SMOS that OSI-SAF currently classifies as “multi-year” ice.
At the risk of (repeating myself)^n, n → ∞:
Why do Tony, Tommy and Andy persist with this nonsense?
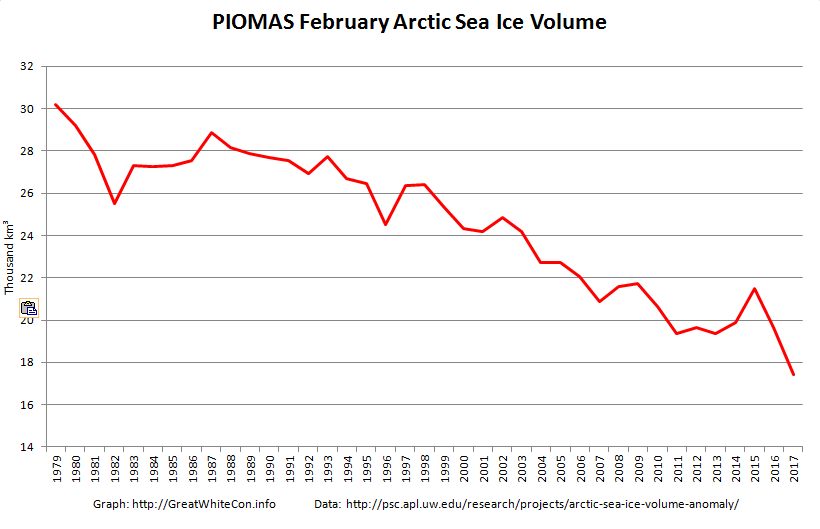
The February 2017 PIOMAS Arctic sea ice volume numbers are out. It’s no longer surprising to report that they are the lowest ever for the month of February in records going back to 1979:
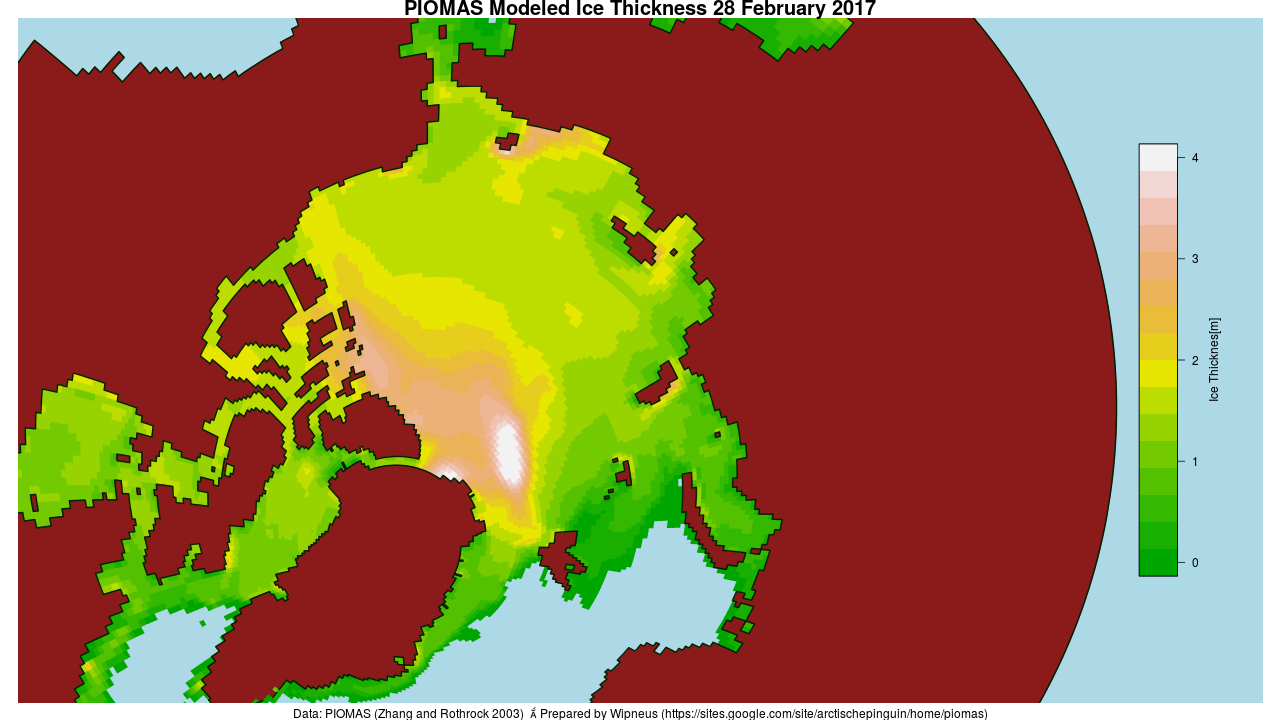
Here’s the PIOMAS gridded thickness map for February 28th:
There does seem to be a small patch of slightly thicker ice in the East Siberian Sea off Chaunskaya Bay, but there’s still a much larger area of sub 0.5 meter thick ice in the Laptev and Kara Seas.
The Danish Meteorological Institute’s temperatures for the “Arctic area north of the 80th northern parallel” graph shows somewhat more “normal” readings in February 2017, but still without falling below the ERA40 climatology this year or in 2016:
The graph of cumulative Freezing Degree Days (FDD for short) is still far below all previous years in DMI’s records going back to 1958:
Finally, for the moment at least, here’s the high resolution AMSR2 Arctic sea ice area and extent:
I’m going to have to eat some humble pie, or crow pie as I gather it’s usually referred to across the Atlantic, following my tentative “2017 maximum prediction” a couple of weeks ago. Both area and extent posted new highs for the year yesterday, with area creeping above 13 million square kilometers for the first time this year.
[Edit – March 7th]
Commenter Michael Olsen suggests that “thicker ice being pushed into the Alaskan and Russian parts of the Arctic Ocean”. Here’s some evidence:
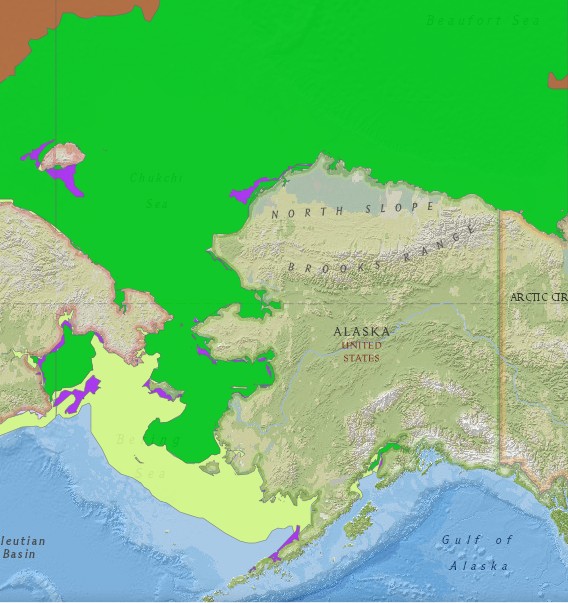
The United States’ National Weather Service current sea ice stage of development map for Alaskan waters:
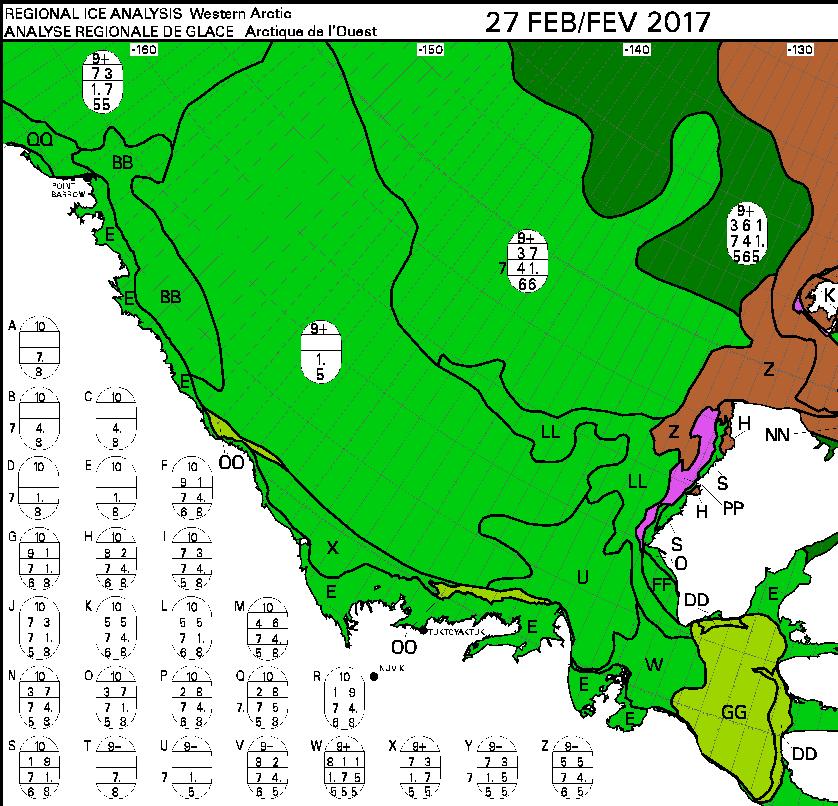
This week’s Canadian Ice Service sea ice stage of development map is expected later today, so for now here’s last week’s:
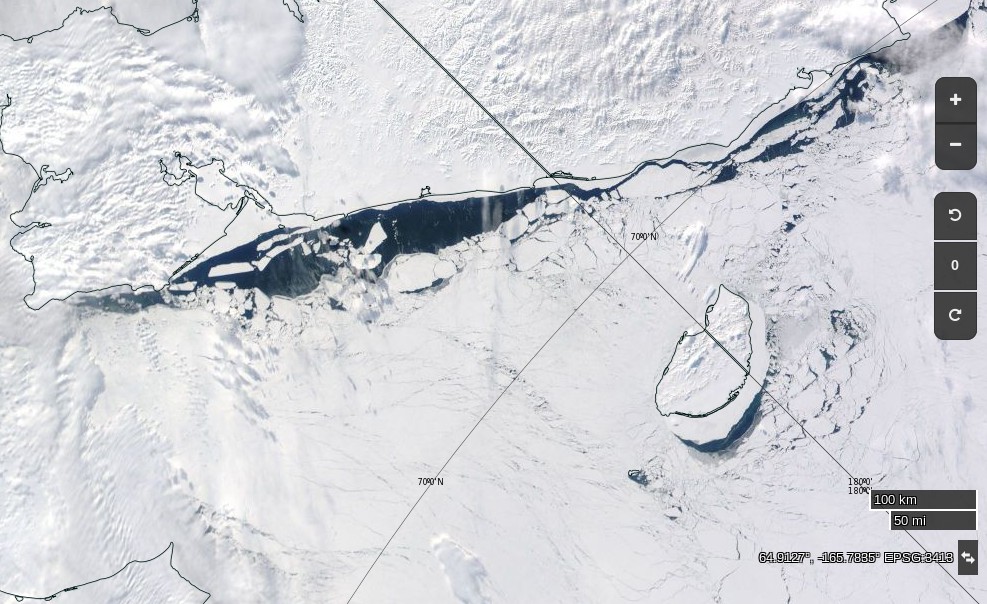
Especially for Michael, a visual image of all the “thicker ice [that’s been] pushed into the Russian parts of the Arctic Ocean” courtesy of the nice folks at NASA:
NASA Worldview “true-color” image of the Chukchi Sea on March 10th 2017, derived from the MODIS sensor on the Aqua satellite
[Edit – March 12th]
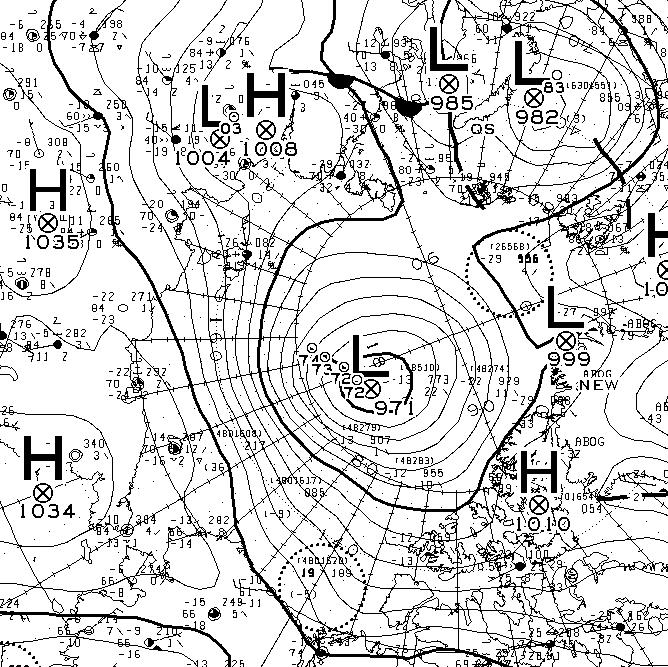
Yet another strong Arctic cyclone has been battering the sea ice in the Arctic Basin. According to Environment Canada this one bottomed out at 971 hPa at 06:00 UTC today.
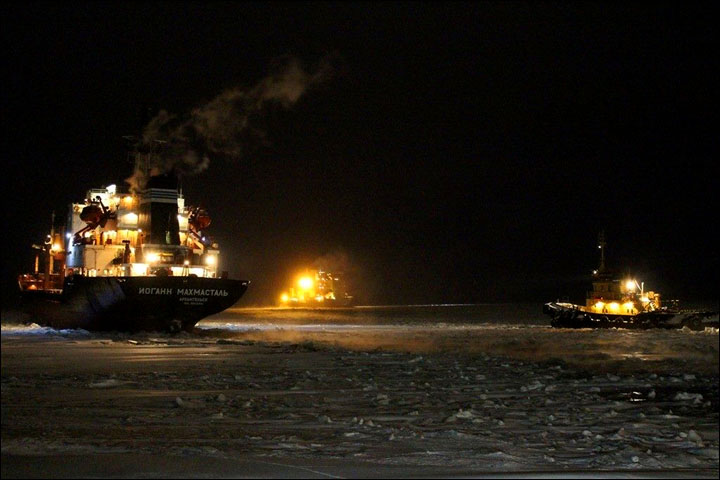
Yesterday I found myself in conversation with Nigel and “Steve” on Twitter about NOAA’s recent report on Arctic temperatures and the seemingly unrelated topic of Russian icebreakers. Apparently Nigel has been perusing “Steve’s” recent railing against NOAA’s “Red Hot Arctic” in 2016 on his “Deplorable Client Science” blog. Here’s how my conversation with Nigel went:
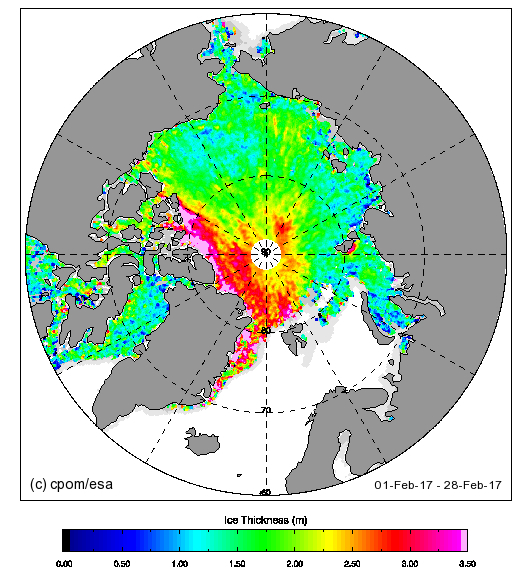
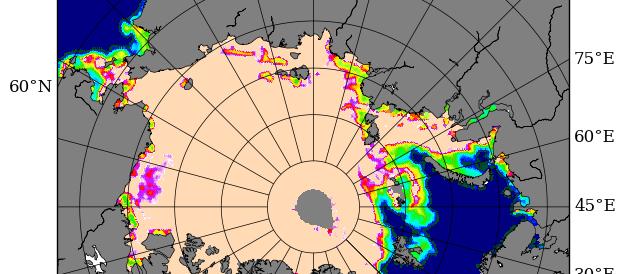
It appears that Nigel believes that an image like this:
is far more relevant than an image like this:
when it comes to determining the thickness of “the ice up in the north of Russia”!
Then of course there was my “conversation” with “Steve” after he butted in on my “debate” with Nigel. It went like this:
Just like Nigel, “Steve” still hasn’t got around to commenting on my map of Arctic sea thickness or explaining the significance of 2 Russian icebreakers NOT stuck in the East Siberian Sea.
The Journal of Alternative Facts article guidelines insist on peer review by politicians, so I’ve invited a few local, national and international politicians to comment on my draft paper:
Please feel free to add your peer reviews in the space provided for that purpose below.
This website uses cookies to improve your experience. We'll assume you're ok with this, but you can opt-out if you wish. Cookie settingsACCEPT
Privacy & Cookies Policy
Privacy Overview
This website uses cookies to improve your experience while you navigate through the website. Out of these, the cookies that are categorized as necessary are stored on your browser as they are essential for the working of basic functionalities of the website. We also use third-party cookies that help us analyze and understand how you use this website. These cookies will be stored in your browser only with your consent. You also have the option to opt-out of these cookies. But opting out of some of these cookies may affect your browsing experience.
Necessary cookies are absolutely essential for the website to function properly. This category only includes cookies that ensures basic functionalities and security features of the website. These cookies do not store any personal information.
Any cookies that may not be particularly necessary for the website to function and is used specifically to collect user personal data via analytics, ads, other embedded contents are termed as non-necessary cookies. It is mandatory to procure user consent prior to running these cookies on your website.