Tag Archives: O-Buoy

Facts About the Arctic in August 2017

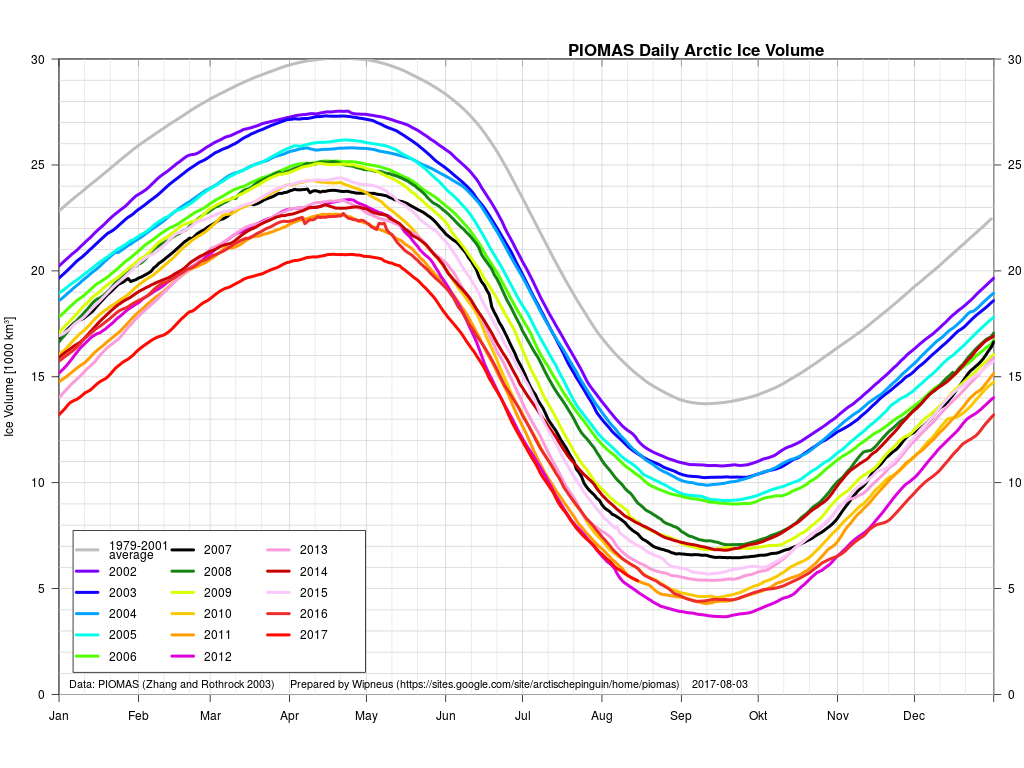
What seems likely to be the most interesting period of the 2017 Arctic sea ice melting season is upon us! The PIOMAS gridded data hasn’t been released yet, but the overall volume numbers reveal that 2017 has now relinquished its “lowest ever” position to 2012. Here’s Wipneus’ graph of the volume data:

piomas-trnd4-20170731

plus his anomaly plot:

piomas-anomaly-20170731

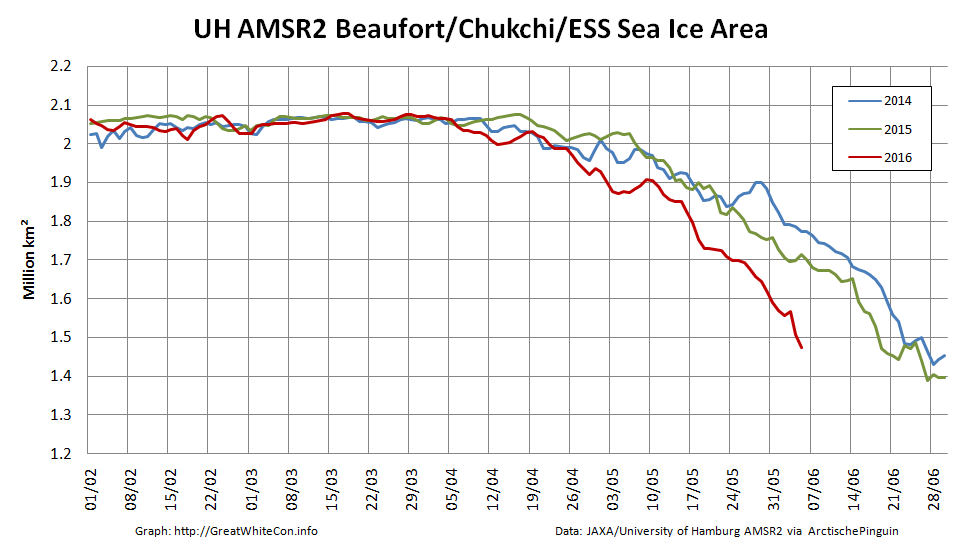
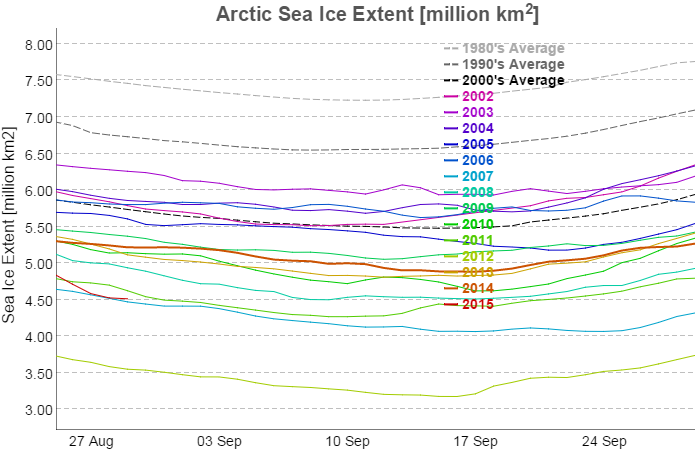
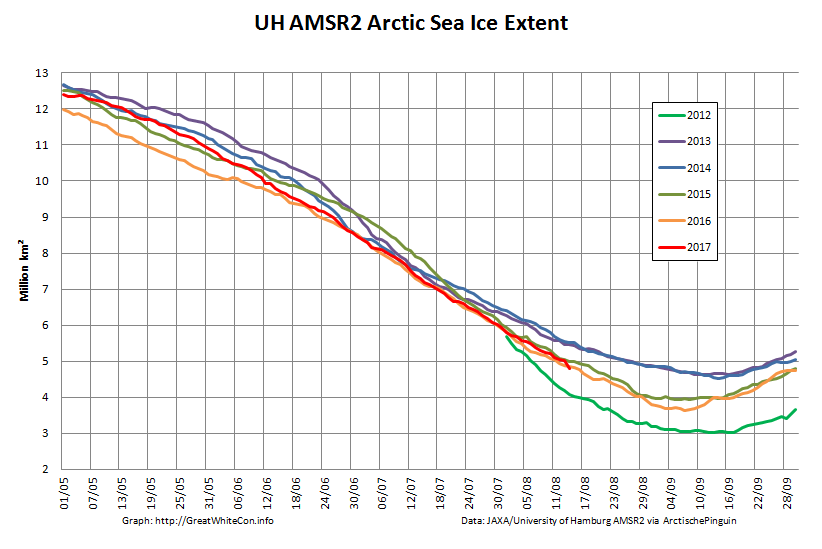
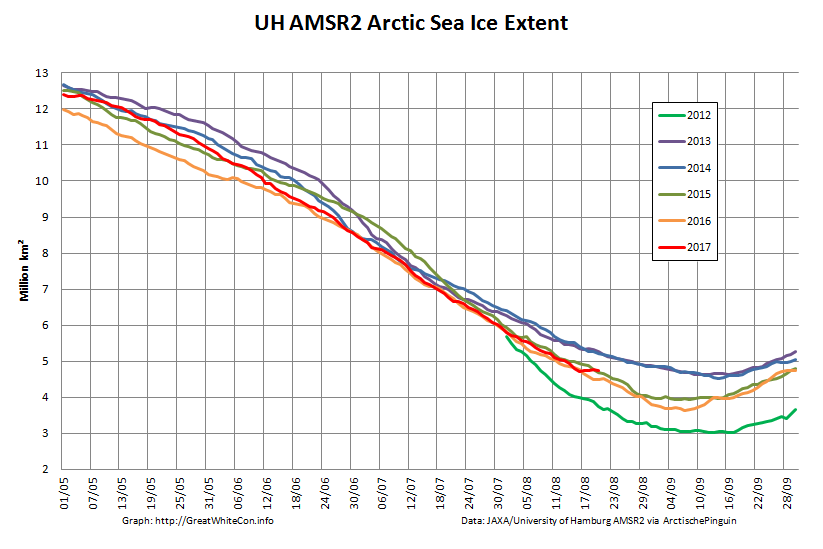
Our favourite high resolution AMSR2 area and extent graphs now also allow comparison with 2012. Here’s how they look at the moment:

UH-Arctic-Extent-2017-08-04

UH-Arctic-Area-2017-08-04

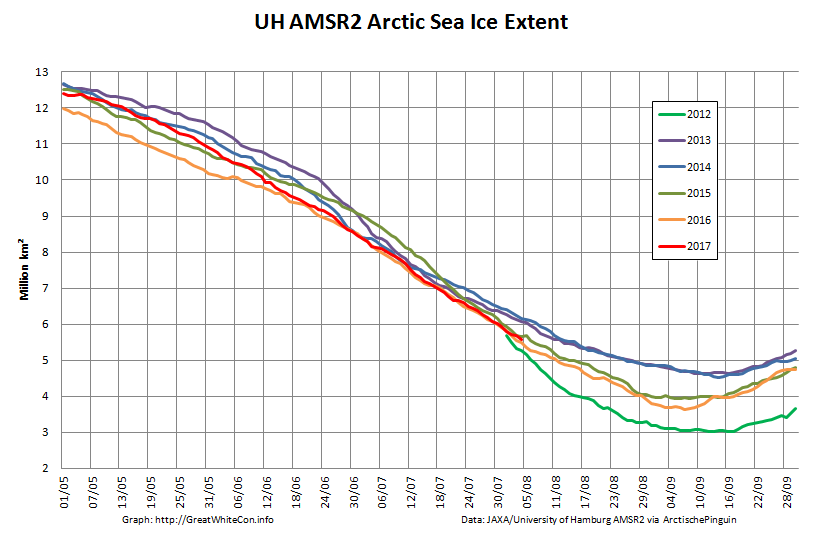
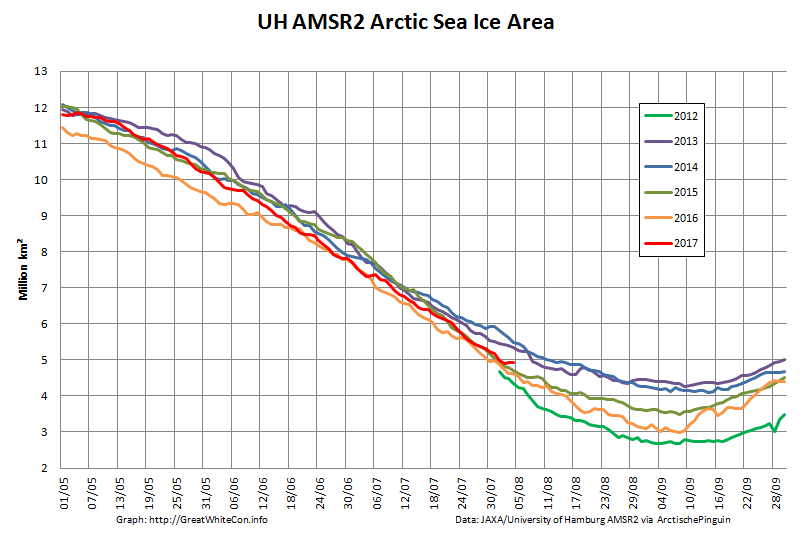
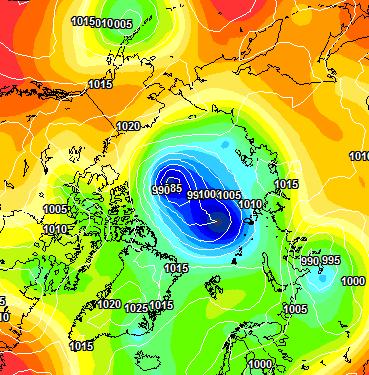
As you can see, round about now is when 2012 Arctic sea ice extent started to noticeably race ahead of the rest of the pack. Will 2017 follow suit? Are there any Arctic cyclones on the horizon for example? Well, the one forecast for August 4th hasn’t materialised. Here’s this morning’s Environment Canada synopsis:

Synopsis-20170804-00Z-Crop

However both ECMWF and GFS agree that a sub 985 hPa storm should have arrived by Sunday morning. Here’s the ECMWF version from MeteoCiel:

ECH1-20170804+48h

There’s stronger storms in the forecast further out, but once again we’ll believe them if and when we see them!

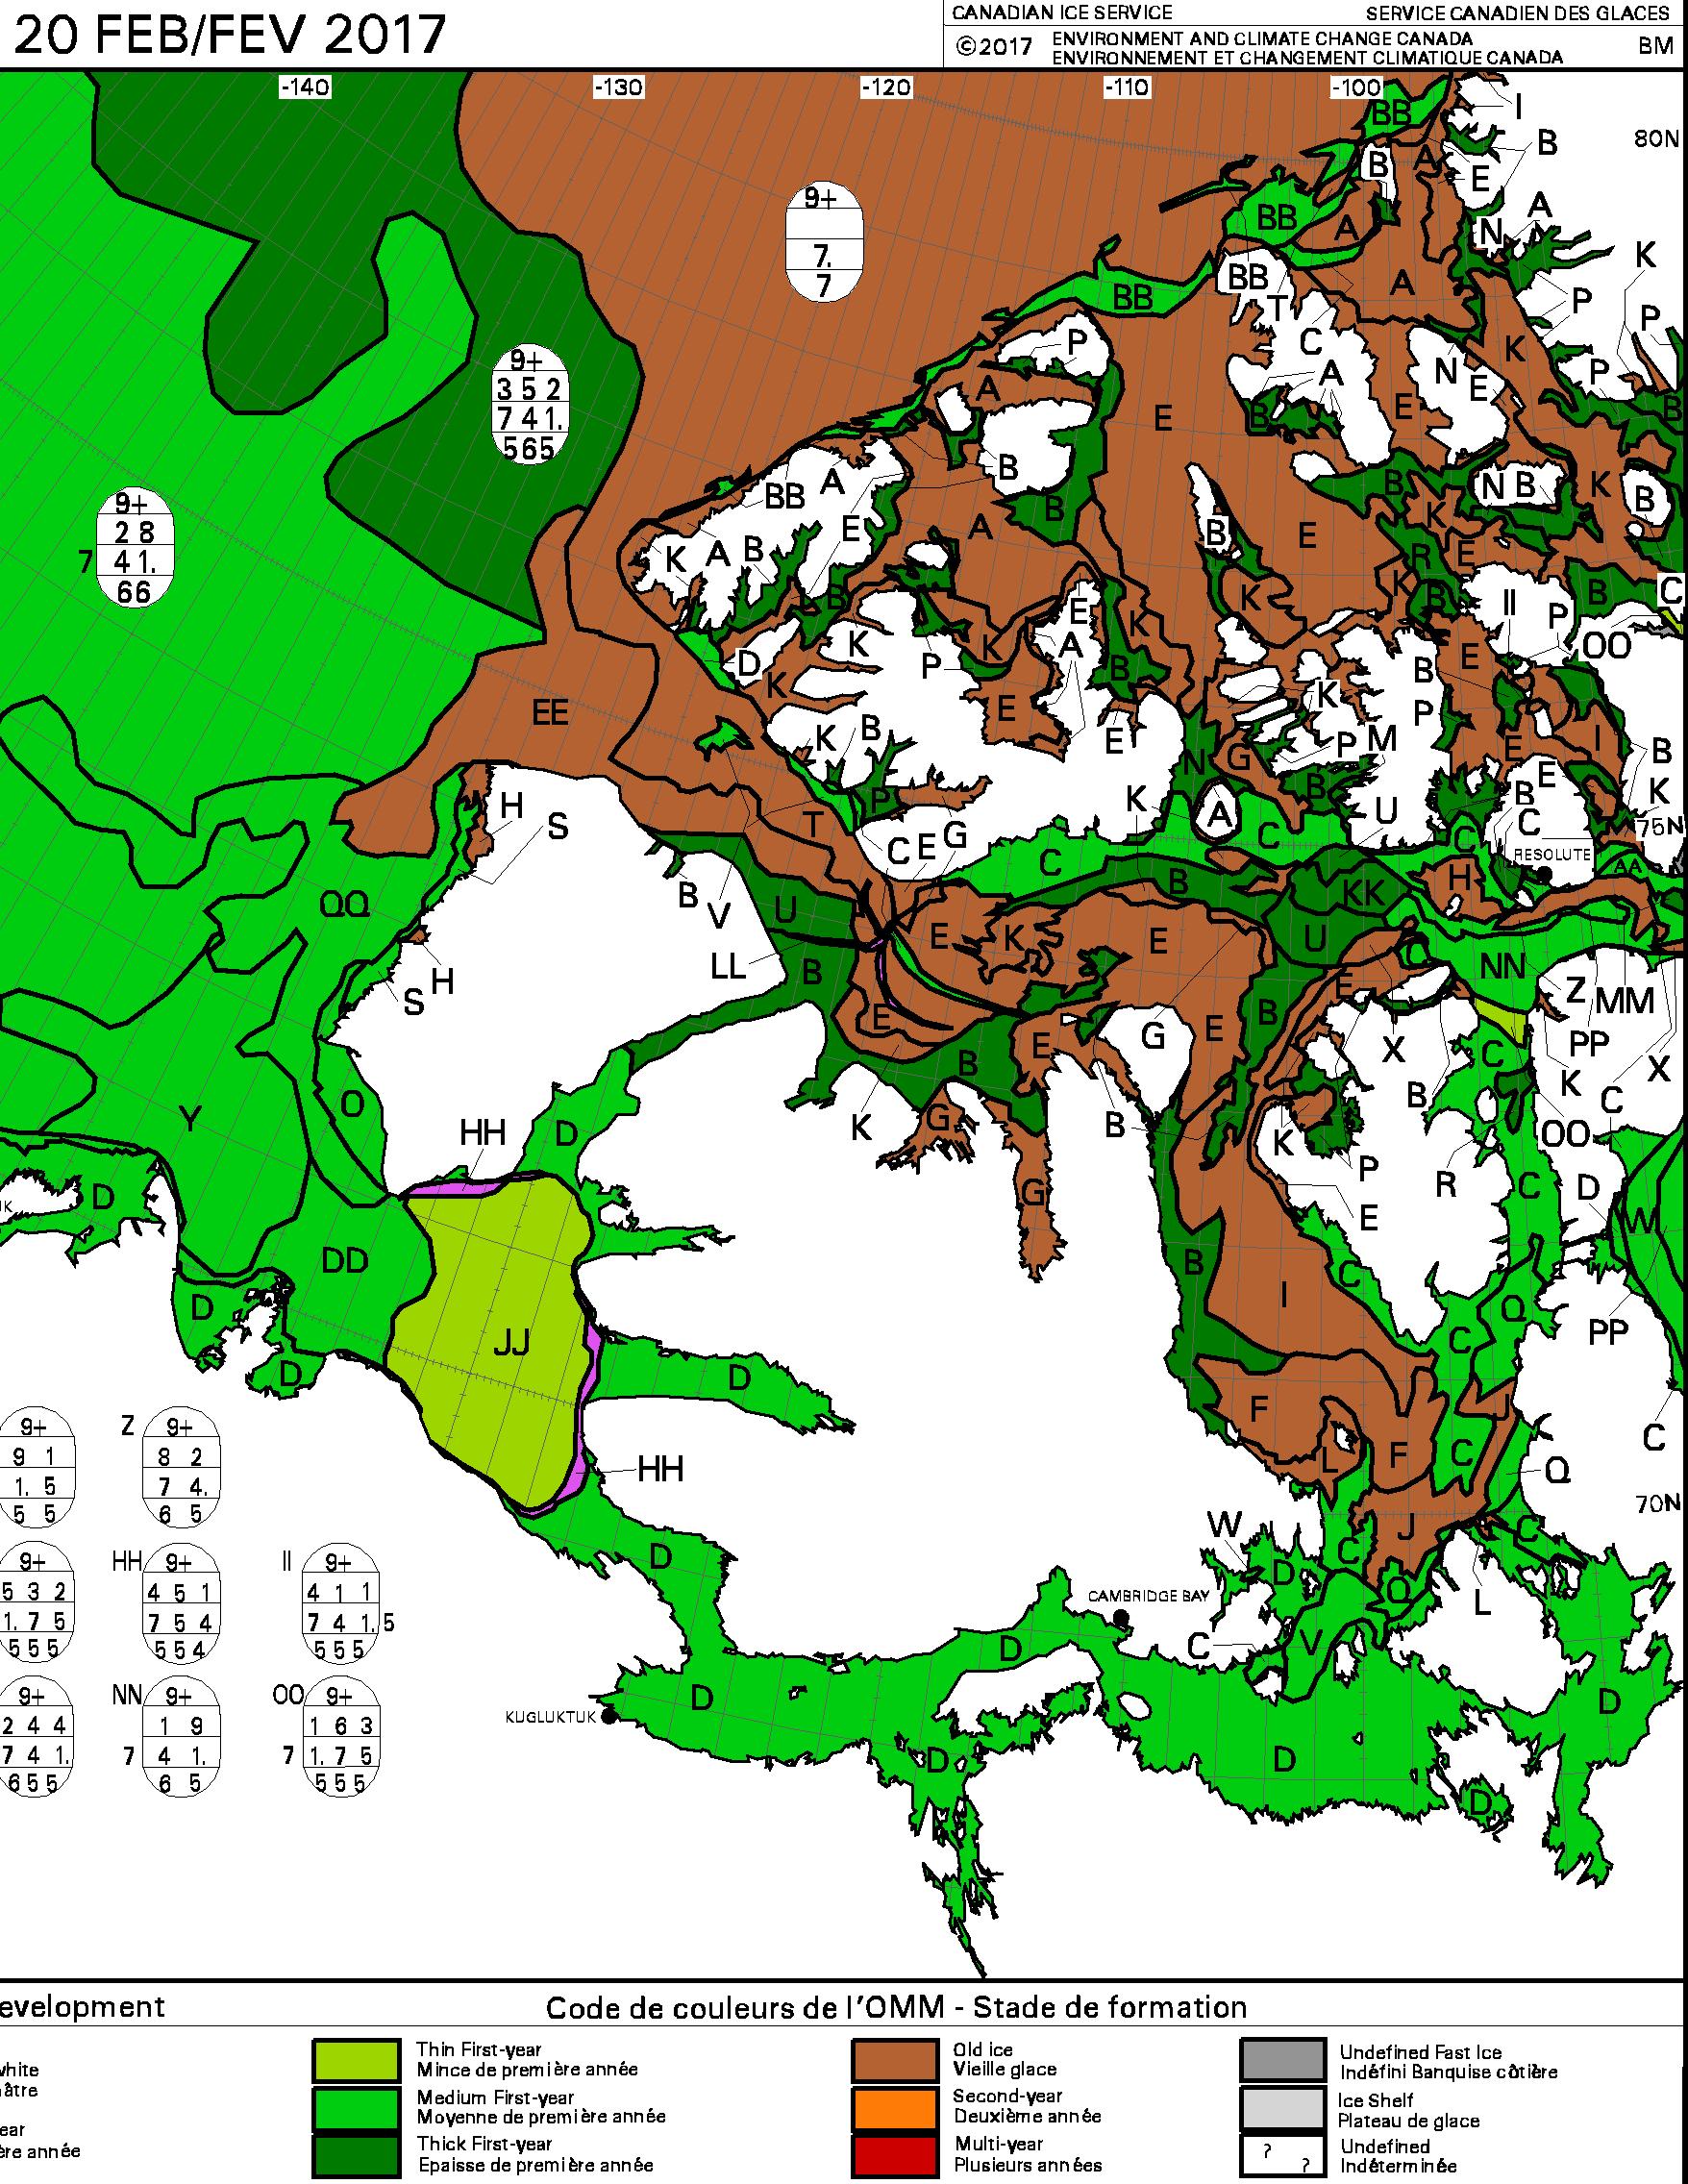
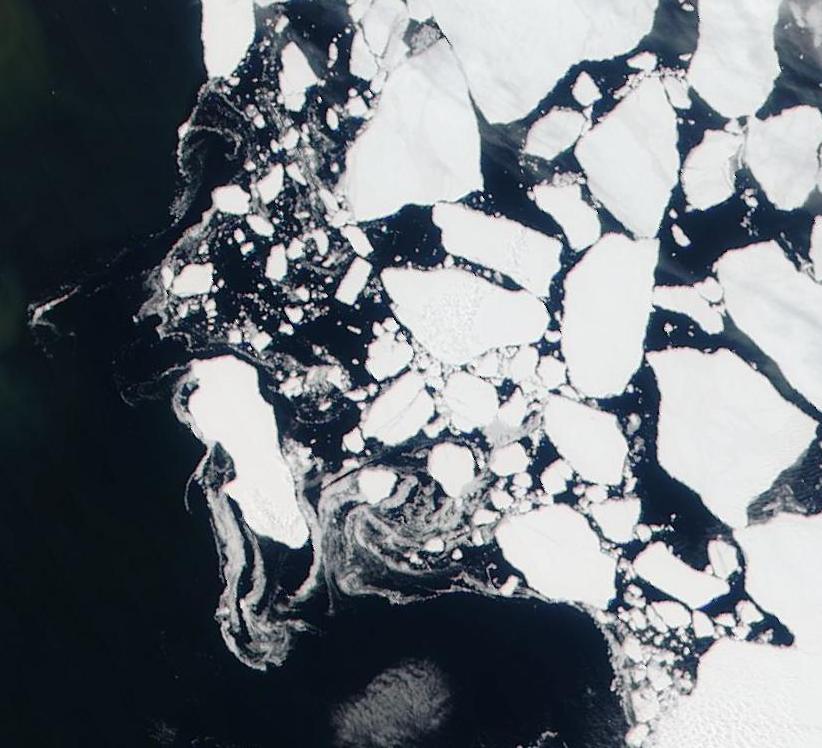
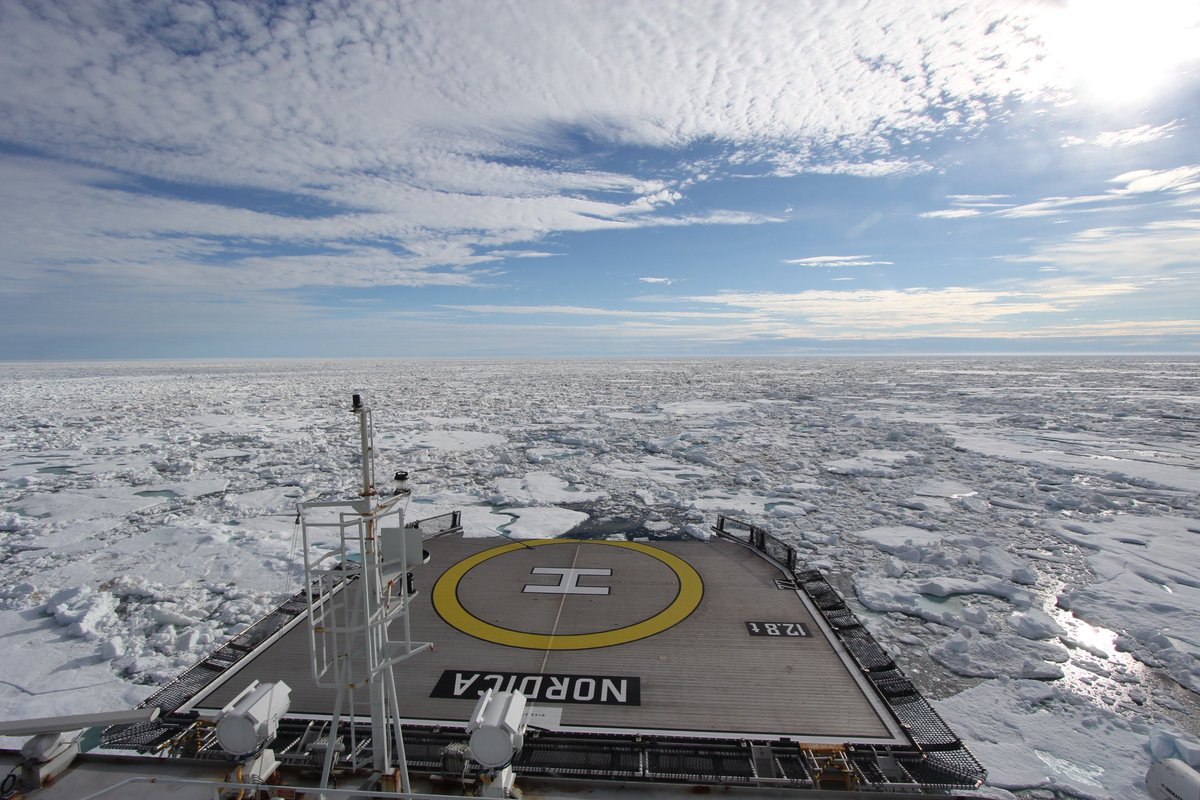
We’re keeping a close eye on the Northwest Passage once again this year. Most of the southern route is open already, but as we predicted the old ice in Larsen Sound has a lot of melting still to do. Here’s how it looked from the icebreaker Nordica a few days ago:

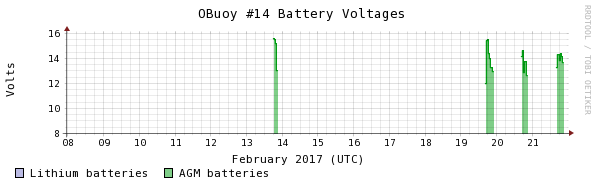
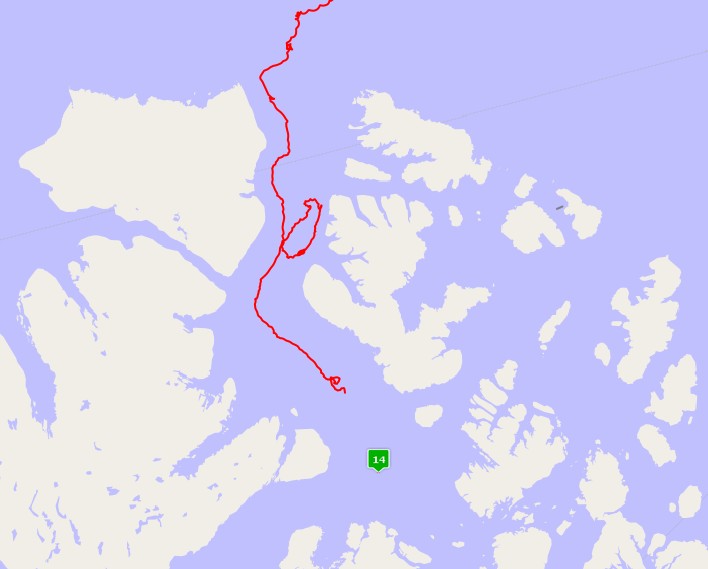
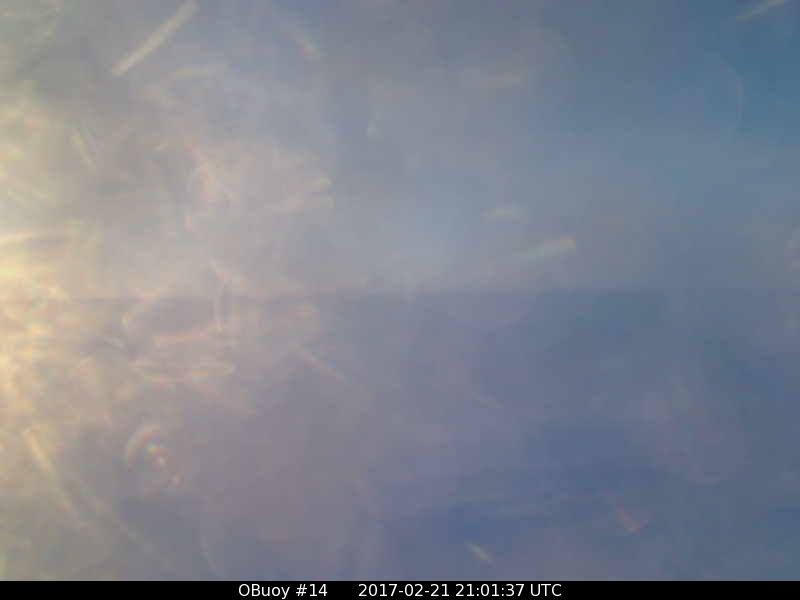
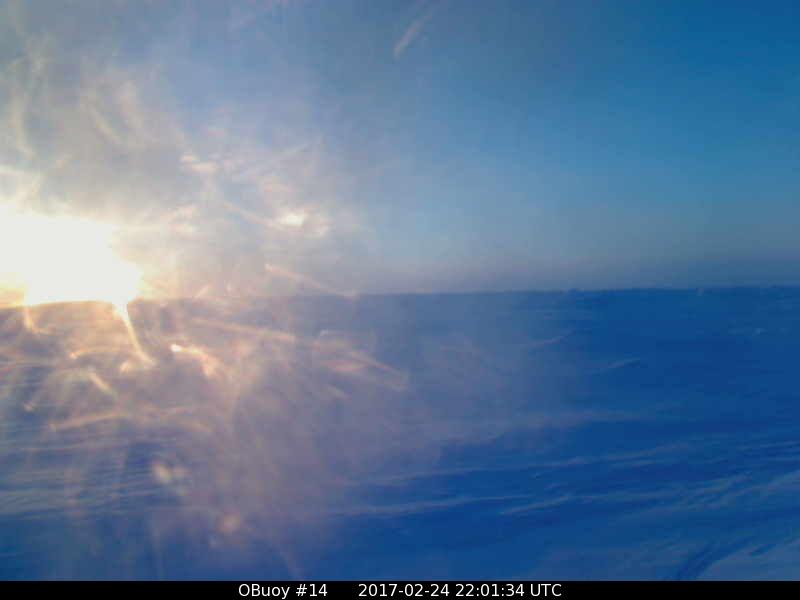
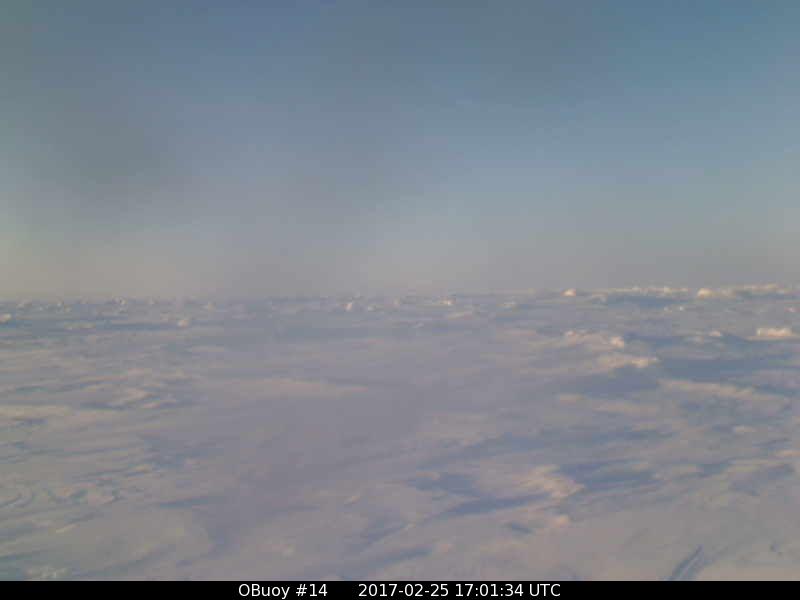
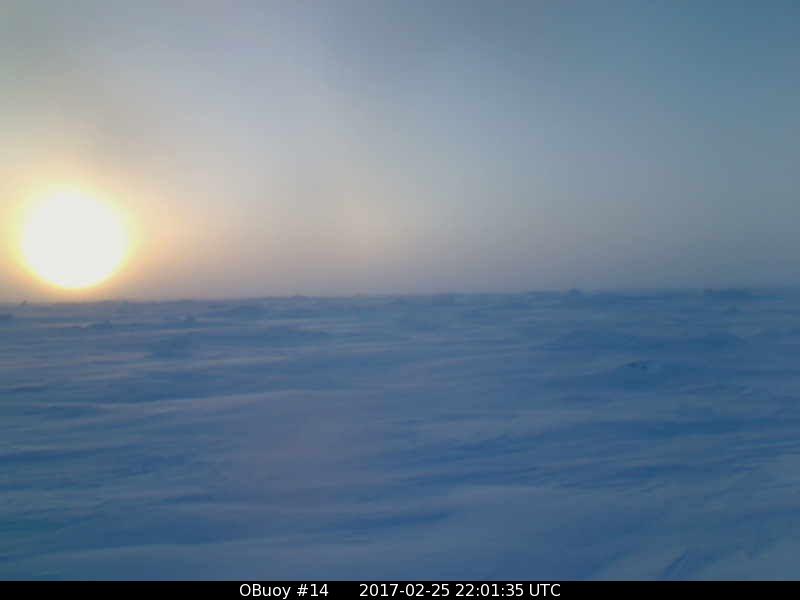
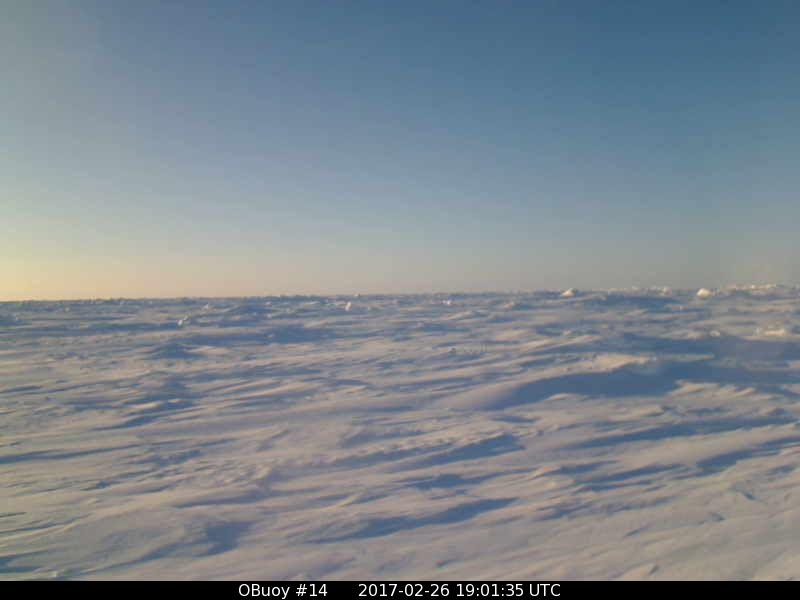
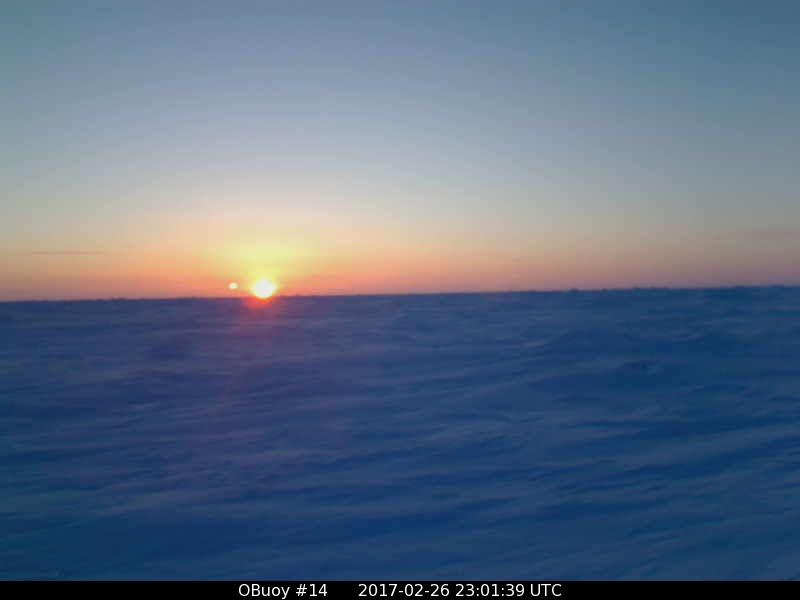
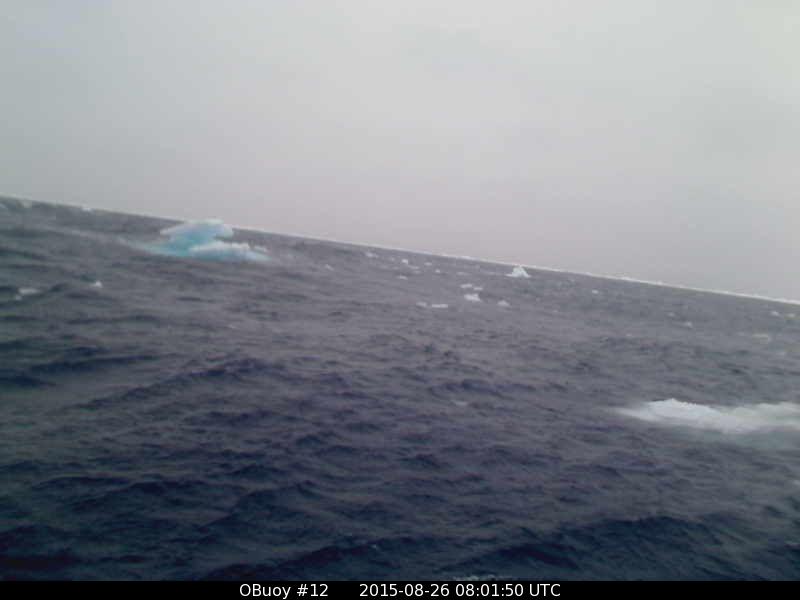
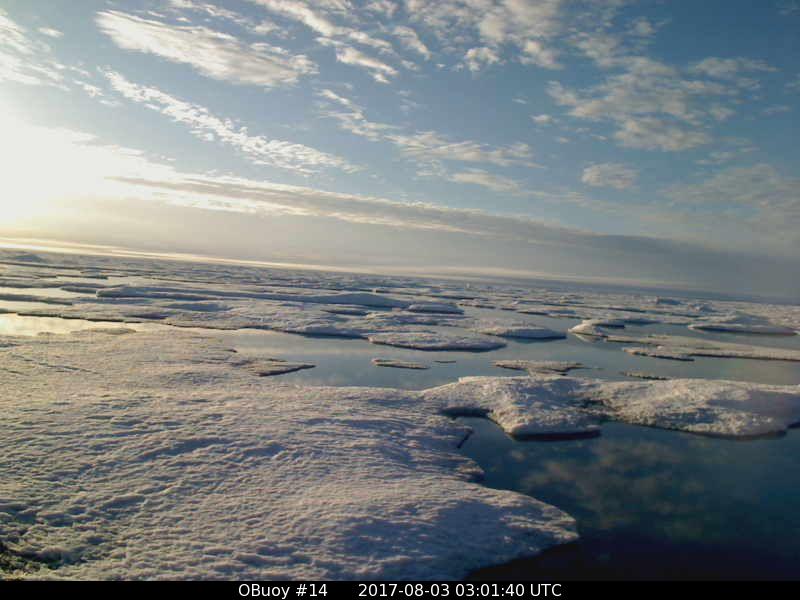
On top of that the old ice around O-Buoy 14 is currently rushing south down the McClintock Channel to replenish it. Here’s how that looks at the moment:

OBuoy14-20170803-0301

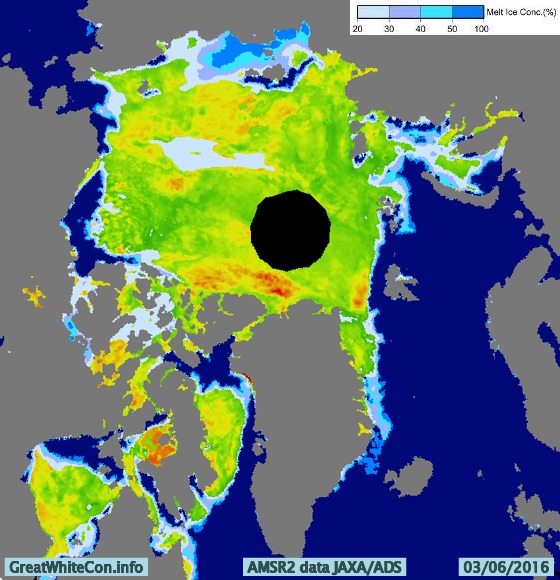
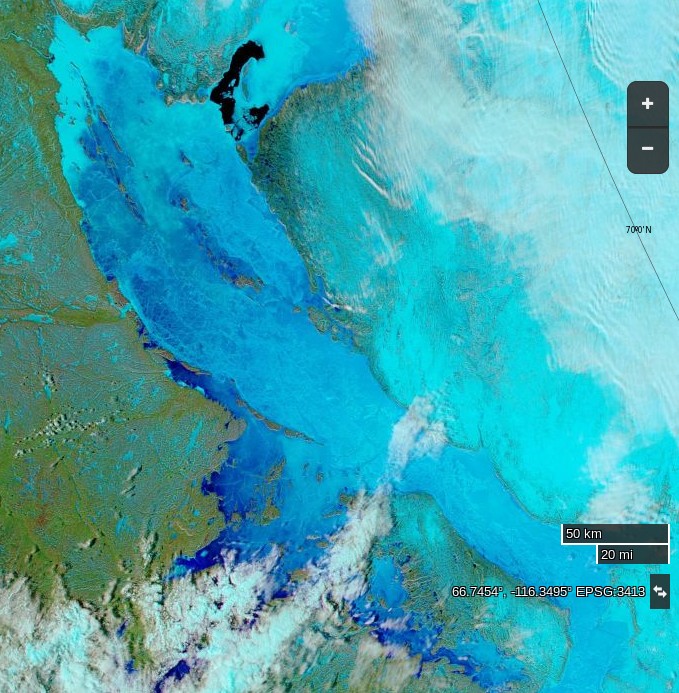
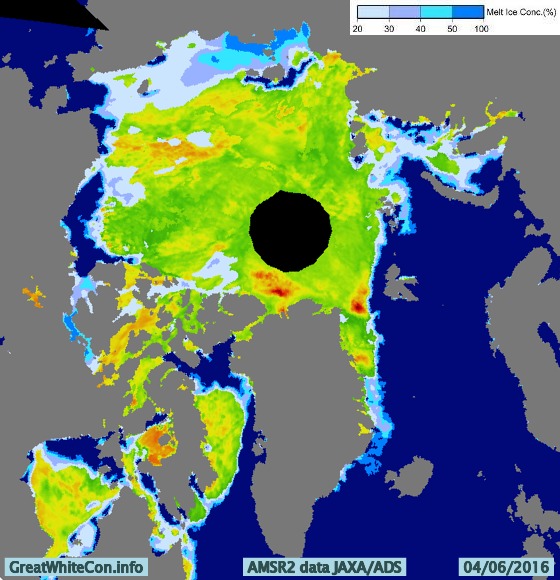
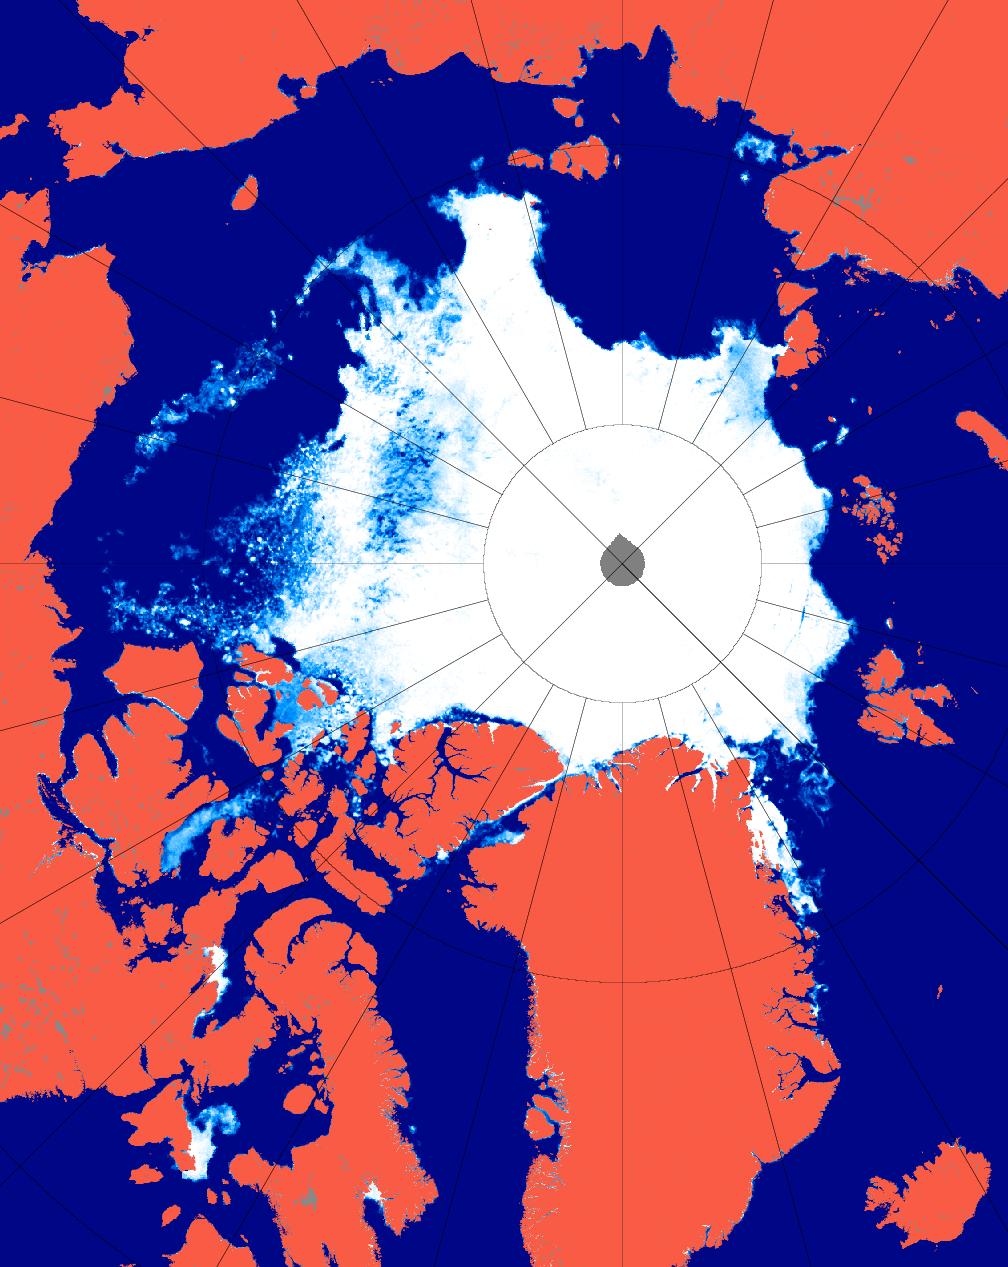
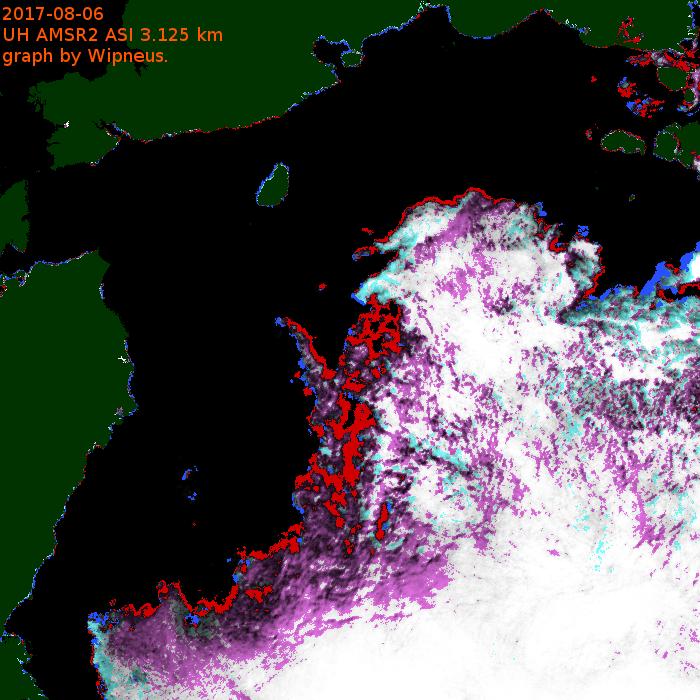
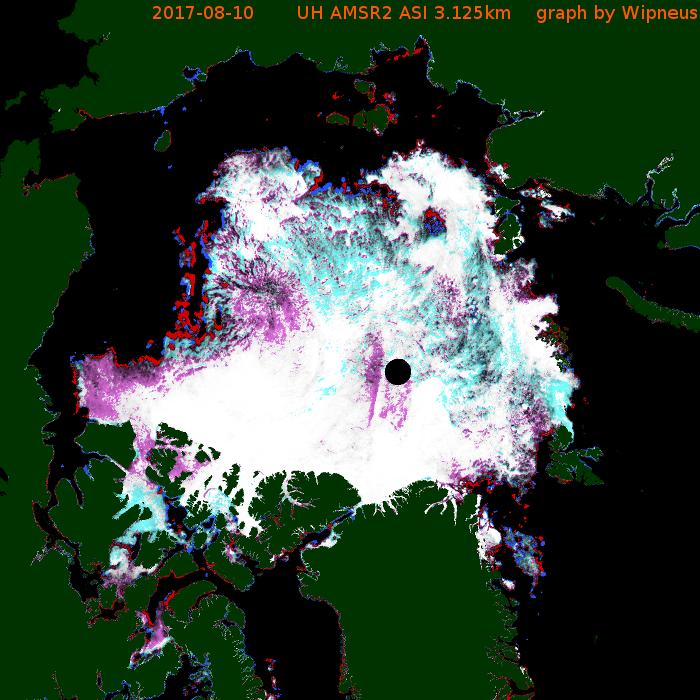
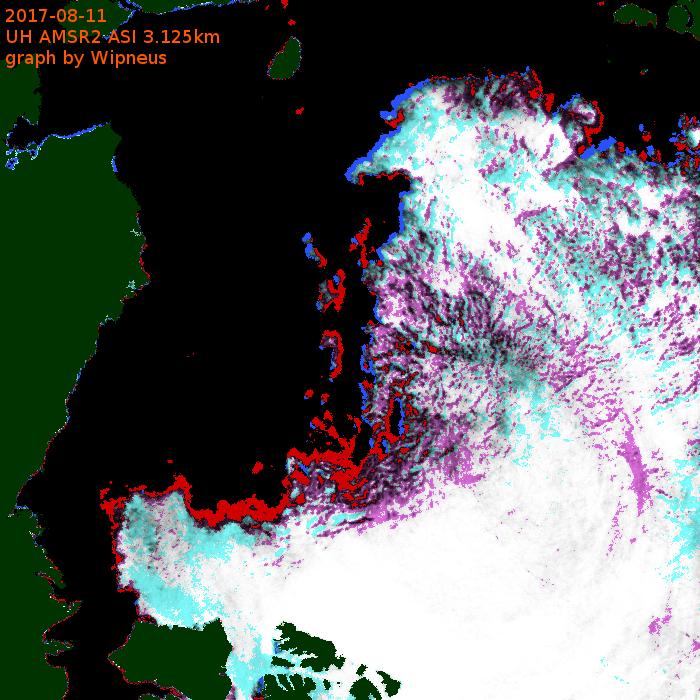
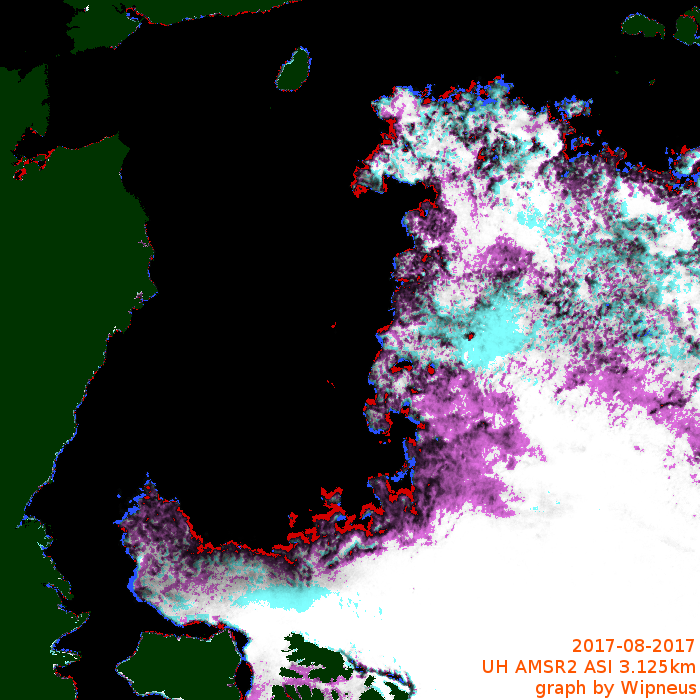
Meanwhile the melt along the Northern Sea Route is well ahead of last year. Here’s the University of Hamburg AMSR2 concentration map of the area:

Arc_20170803_res3.125_LARGE

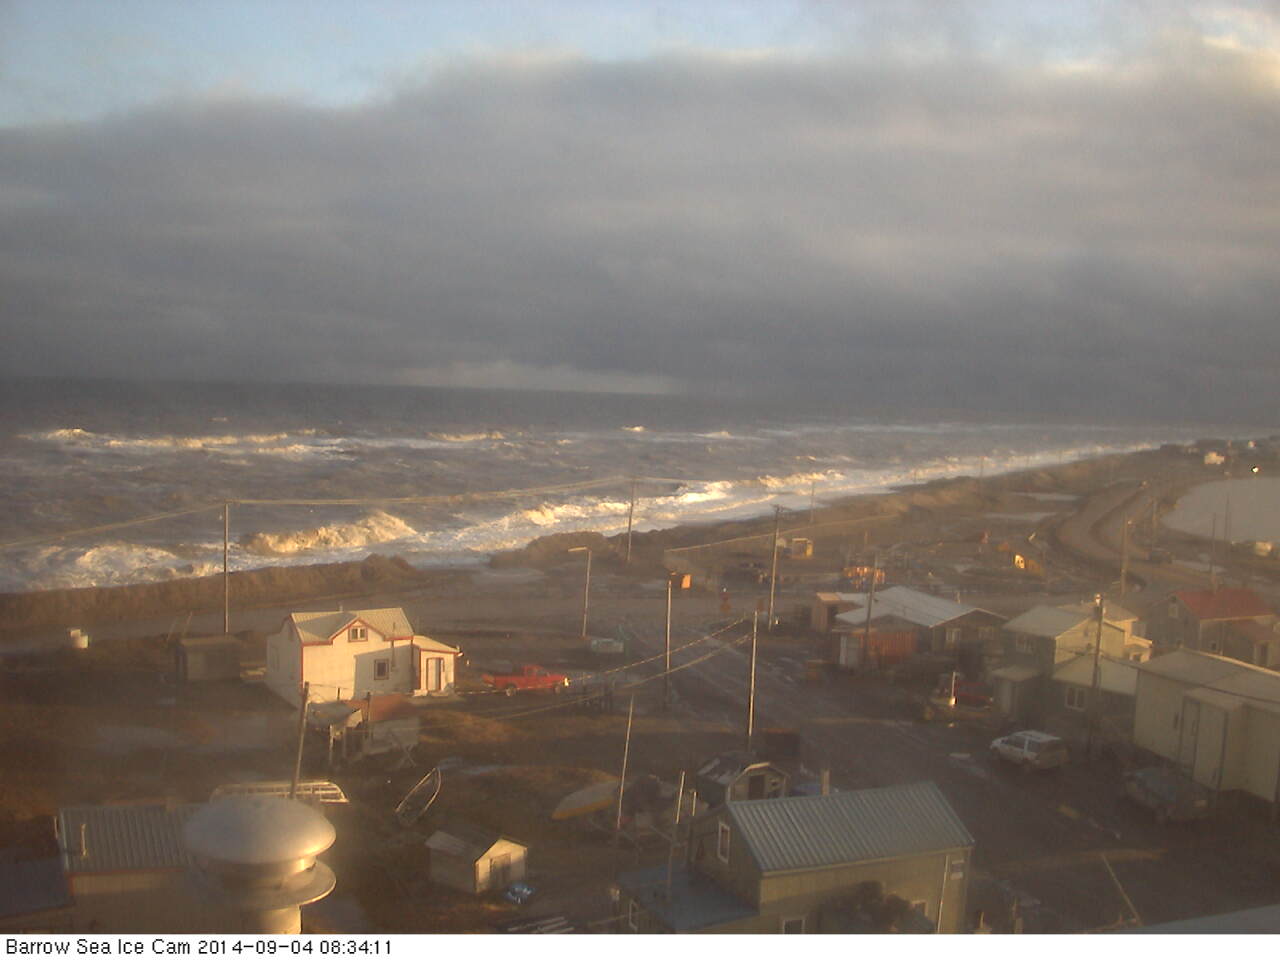
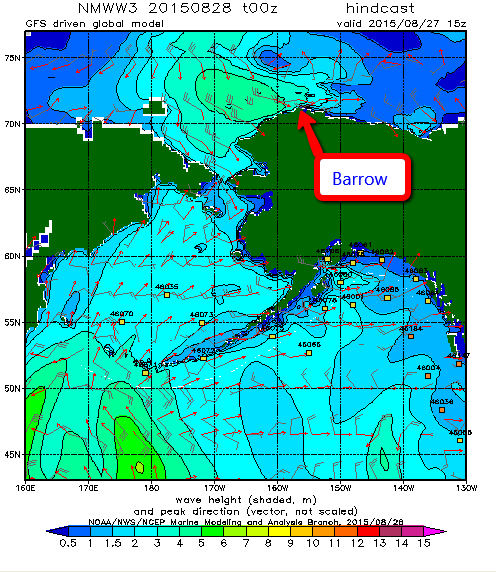
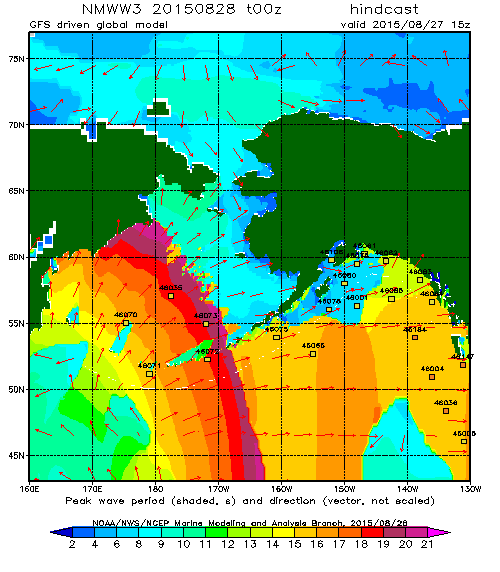
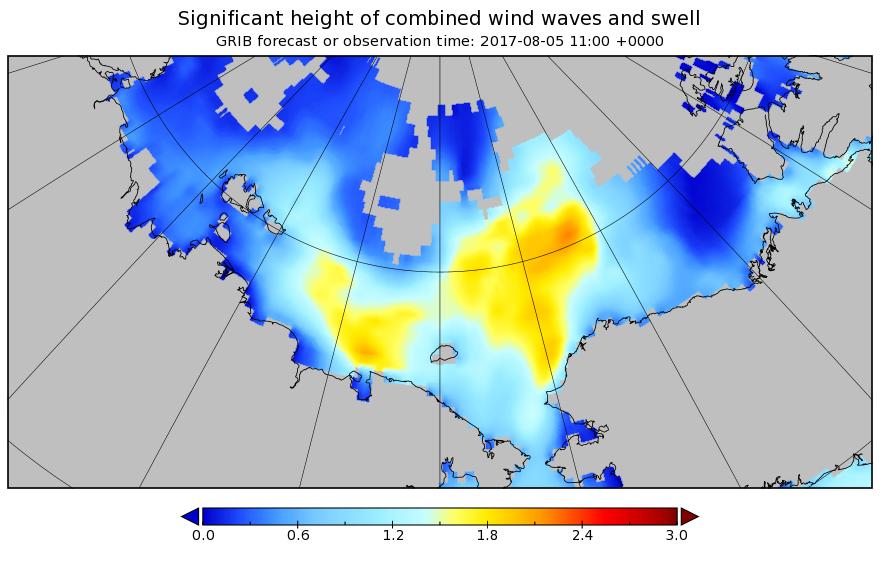
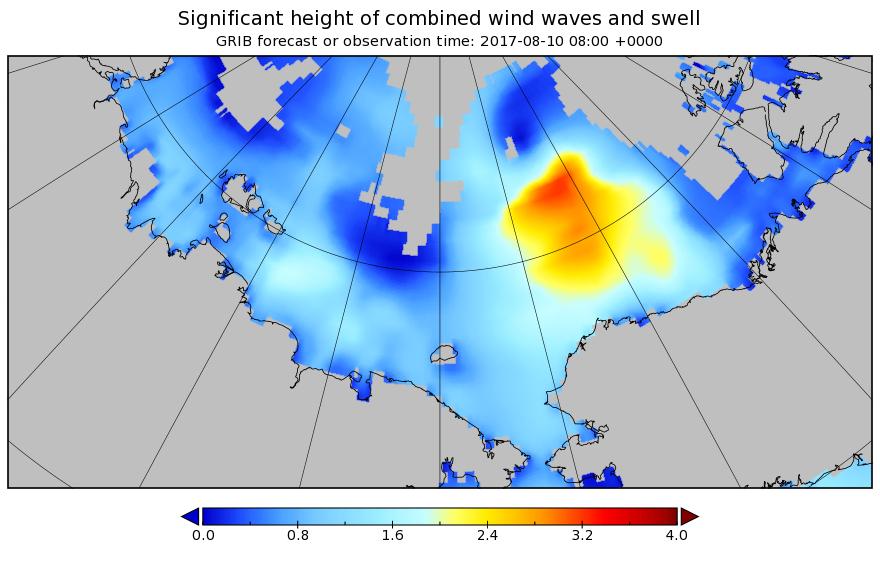
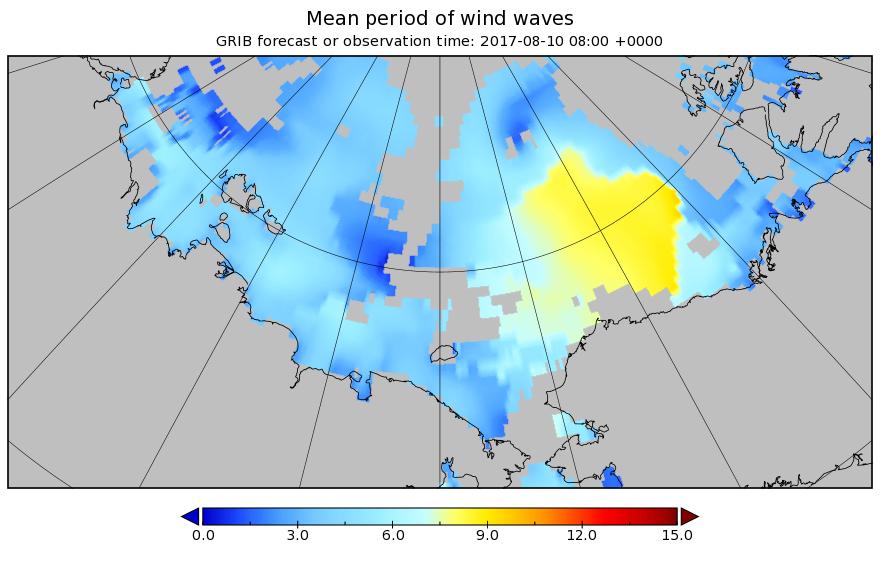
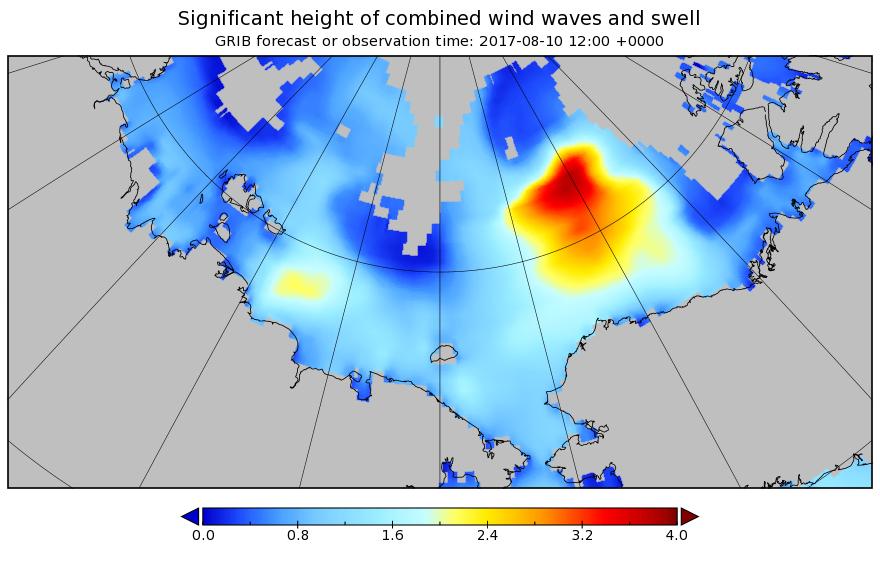
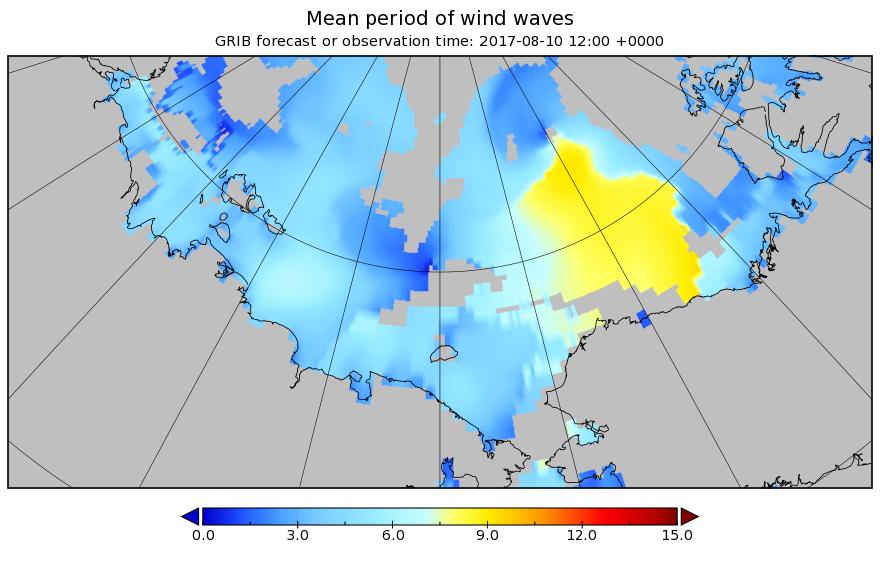
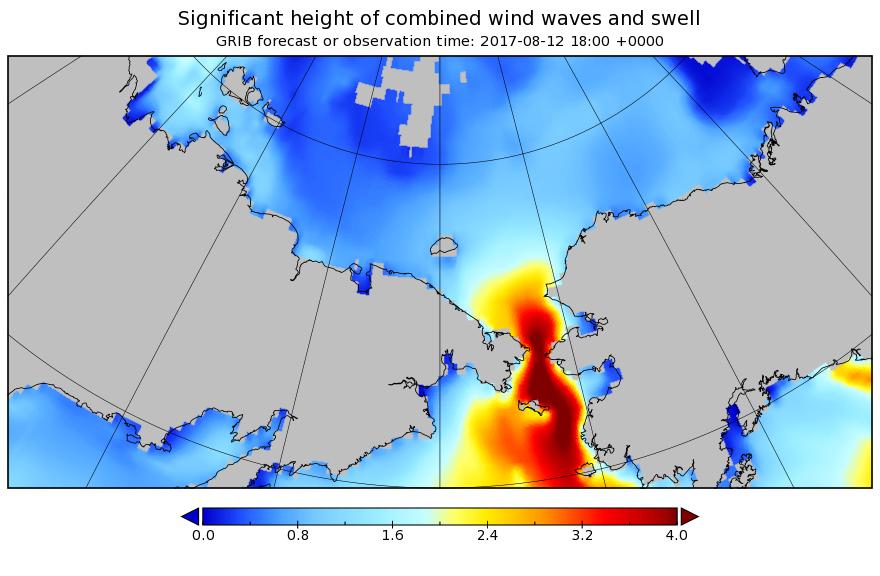
There’s also now a lot of open water on the Pacific side of the Arctic, and Sunday’s cyclone is forecast to create a large area of 2 meter plus waves heading in the direction of the ice edge:

Significant_height_of_combined_w in multi_1.glo_30mext.20170804_00024

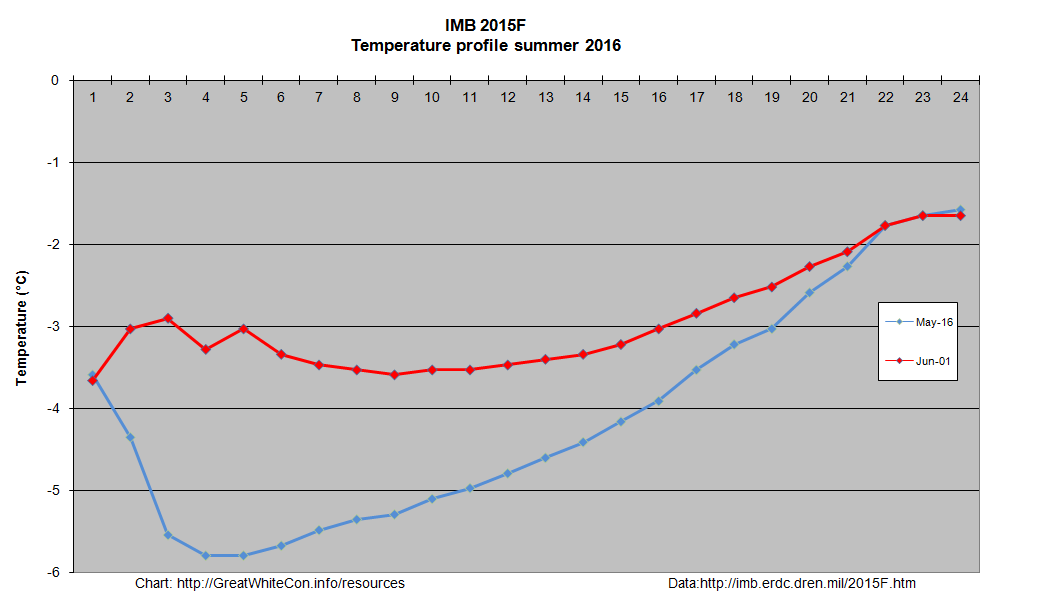
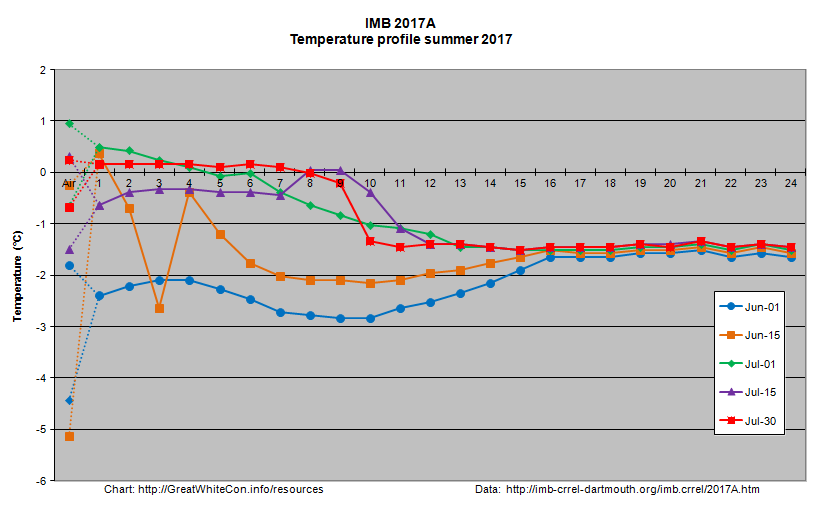
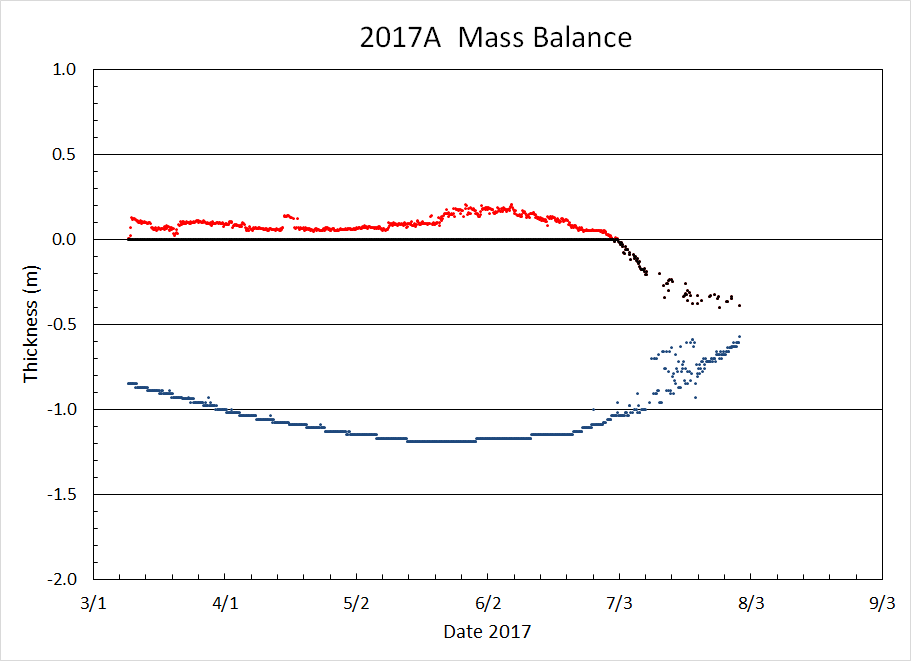
I expect that to have a noticeable effect on the already fragile sea ice by early next week, assuming the storm arrives as forecast! There is an ice mass balance buoy handily placed out on the ice in the path of the storm. Buoy 2017A is currently located near 77 N, 147 W, and its assorted sensors suggest the ice underneath it is now less than 20 cm thick:

2017A-2017-07-30

2017A_thick_20170731

Here’s how the area around the buoy looked a couple of weeks ago:


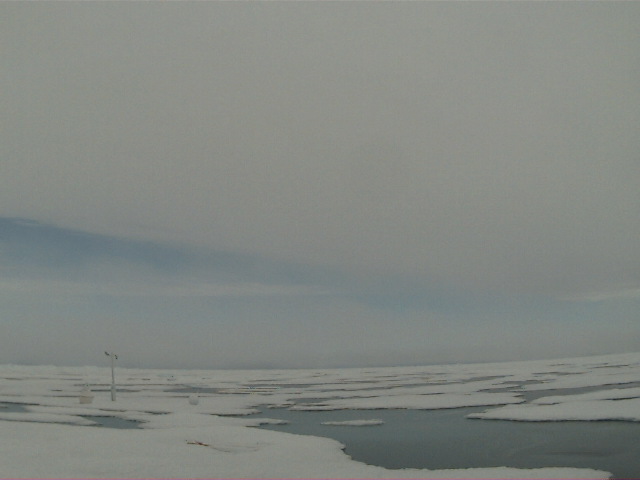
Image of 2017A from WARM 6 on July 18th 2017. NSF project: NSF OPP #1603548

The $64,000 question now is will the 2017 Arctic sea ice metrics stay in amongst the recent pack, or race after 2012 instead?


[Edit – August 6th]

This morning’s synopsis from Environment Canada suggests the cyclone has bottomed out at a MSLP of 982 hPa:

Synopsis-20170806-06Z-Crop

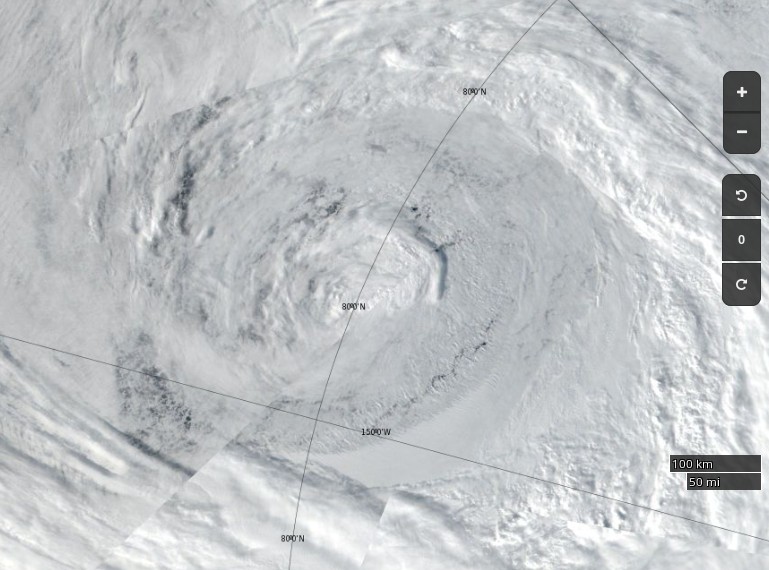
Here’s how the cyclone looked from space yesterday:

NASA Worldview “true-color” image of the sea ice north of the Beaufort Sea on August 5th 2017, derived from the VIIRS sensor on the Suomi satellite

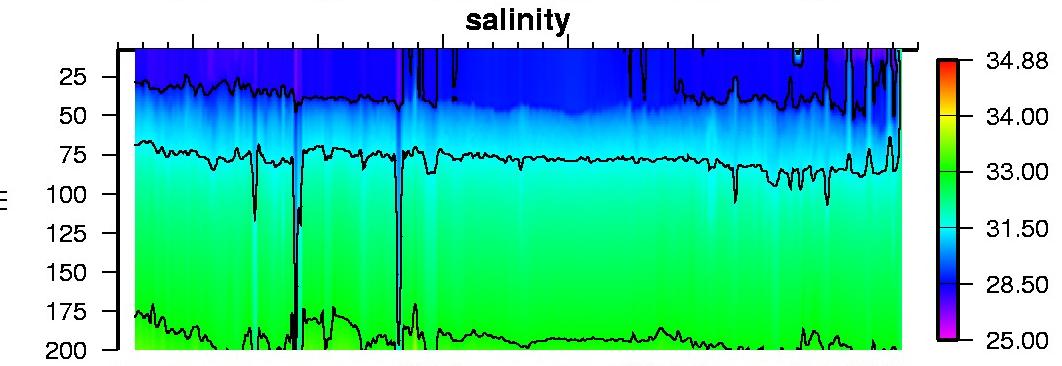
I think that I can convince myself that the salinity profile from ice tethered profiler 97, currently located at 73° N, 134° W, reveals mixing from depth in the wake of the storm:

itp97-Salinity-20170806

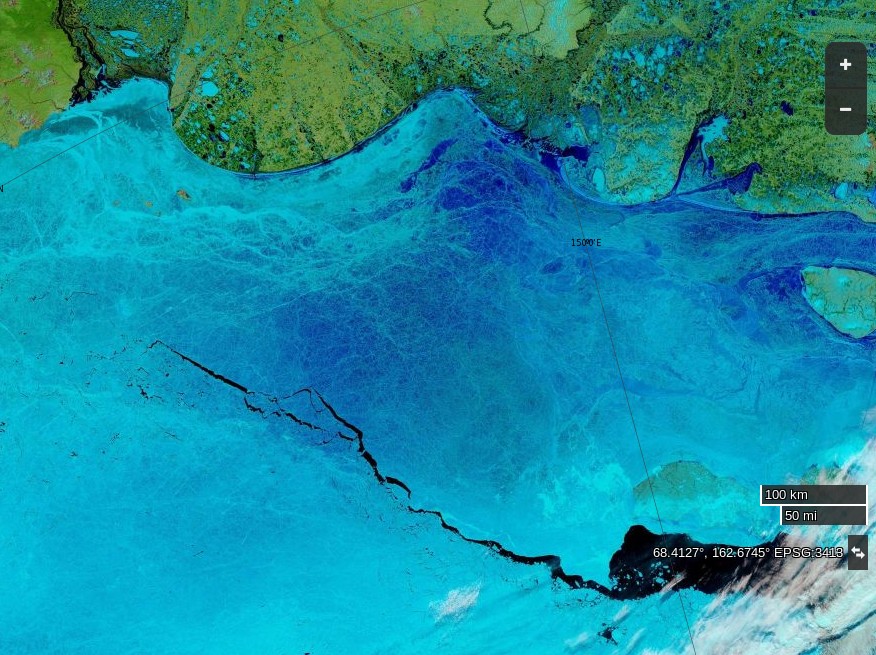
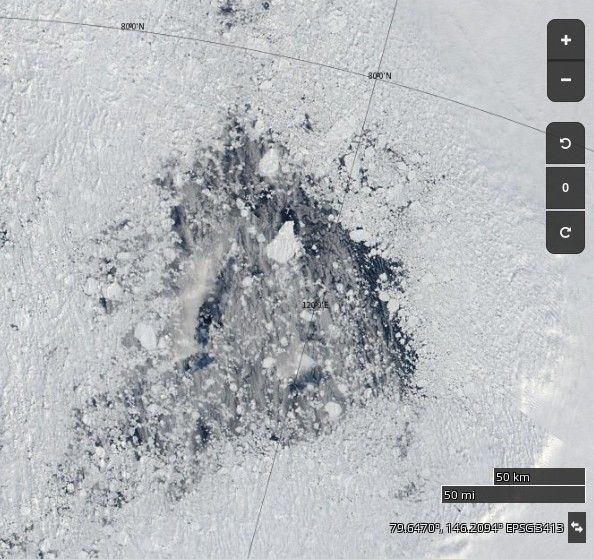
The synthetic aperture radar on the Sentinel 1B satellite can certainly see through the clouds, and reveals open water in the Central Arctic north of the Beaufort Sea yesterday evening (UTC):

Sentinel 1B image of Arctic sea ice at 79N, 160W on August 5th 2017
Sentinel 1B image of Arctic sea ice at 79° N, 160° W on August 5th 2017


[Edit – August 7th]

Here is Wipneus’ latest AMSR2 concentration delta map:

AMSR2-Delta-20170806

The effects of this weekend’s storm are readily apparent! Just in case you’re wondering Wipneus reports:

Area: -172.0 (+324k vs 2016, +138k vs 2015, -669k vs 2014, -523k vs 2013, +493k vs 2012)

UH-Arctic-Area-2017-08-06


[Edit – August 8th]

The next pulse of swell is currently forecast to be somewhat higher and longer period than the last one. This one is also taking aim at the Beaufort Sea MIZ:

Significant_height_of_combined_w in multi_1.glo_30mext.20170808-12Z_00045

Mean_period_of_wind_waves_surfac in multi_1.glo_30mext.20170808-12Z_00045


[Edit – August 9th]

According to Environment Canada the latest cyclone is already down to 980 hPa MSLP:

Synopsis-20170808-06Z-Crop


[Edit – August 9th PM]

The MSLP of the current cyclone is now down to 976 hPA:

Synopsis-20170808-18Z-Crop

The latest WaveWatch III forecast has increased the predicted peak height and period of the resulting waves once again:

Significant_height_of_combined_w in multi_1.glo_30mext.20170809_00037

Mean_period_of_wind_waves_surfac in multi_1.glo_15mext.2070809_00037B


[Edit – August 10th]

Large holes are appearing in the sea ice on the other side of the Arctic too. Take a look north of the Laptev Sea for example:

NASA Worldview “true-color” image of the "Laptev Bite" polynya on August 10th 2017
NASA Worldview “true-color” image of the “Laptev Bite” polynya on August 10th 2017

Meanwhile the current cyclone on the Pacific side of the North Pole appears to have bottomed out at 974 hPa:

Synopsis-20170810-06Z-Crop


[Edit – August 11th]

Here’s the latest sea ice concentration one day delta map from Wipneus:

AMSR2-Delta-20170810
Despite the expected divergence caused by a low pressure area crossing the ice, both are and extent of sea ice on the Pacific side of the Arctic are still falling.


[Edit – August 12th]

The waves are considerably smaller in the Beaufort Sea today, but not in the Bering Strait!

Significant_height_of_combined_w in multi_1.glo_30mext.20170812-00Z_00007

Here’s the latest one day delta map:

AMSR2-Delta-20170811

and here’s video showing the motion of sea ice in the Beaufort & Chukchi Seas so far this summer:


[Edit – August 13th]

Here’s an animation from Wipneus revealing the effect of the two recent cyclones on the Pacific side, plus everything else that’s been going on in the Arctic:

AMSR2-Basin-Anim-20170812-600

Click the image to see a much larger (3.3 Mb) version.


[Edit – August 16th]

AMSR2 Arctic sea ice extent has taken another tumble, and has dropped below 2016:

UH-Arctic-Extent-2017-08-15

Only 2012 left to beat!


[Edit – August 18th]

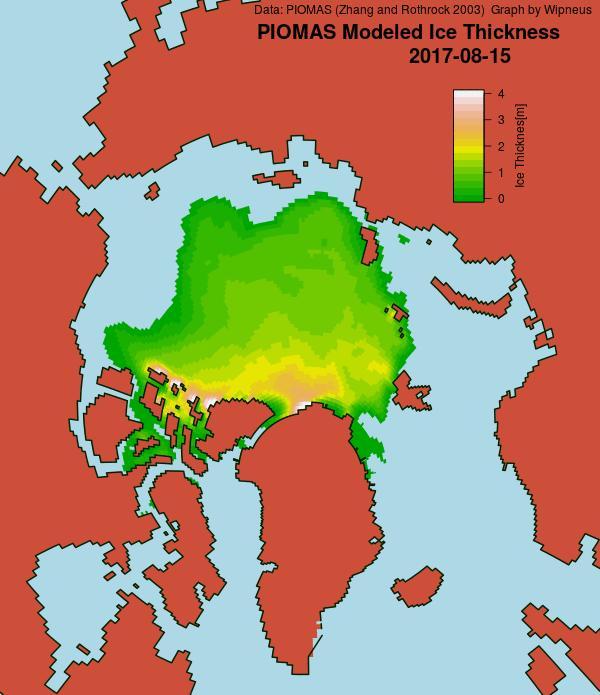
A PIOMAS mid month update has been released, including gridded thickness data. 2017 modelled volume has failed to follow 2012’s trajectory towards the September minimum, and is now on a par with 2011:

piomas-20170815

piomas_thickness_20170815


[Edit – August 21st]

After a “brief hiatus” in the wake of the recent cyclones Arctic sea ice area has posted a new low for the year:

UH-Arctic-Area-2017-08-20

Extent has yet to follow suit:

UH-Arctic-Extent-2017-08-20

The main loss of area has been in the “Beaufort Bite” once again:

AMSR2-Delta-20170820


[Edit – August 24th]

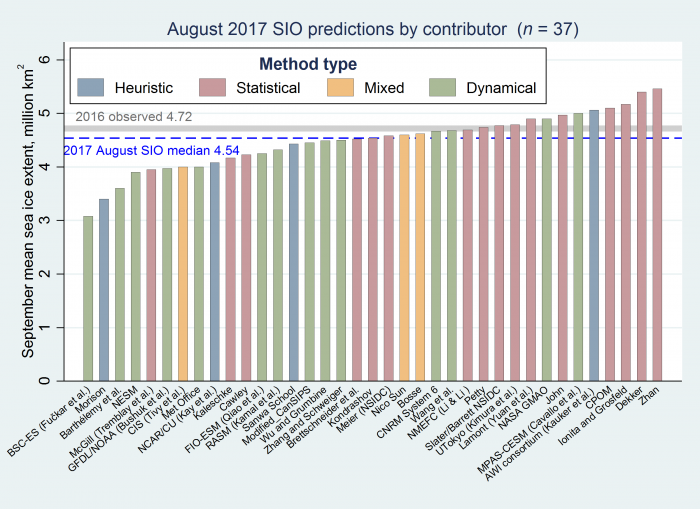
The SIPN August sea ice outlook has been released. Here are the predictions:

Watch this space!

O-Buoy 14 Awakens in the Heart of the Northwest Passage

Enough sunlight is now reaching O-Buoy 14 for it to power up briefly every day after a long sleep through the Arctic winter blackness:

OBuoy14-battery-voltage-2weeks

The buoy’s position has suddenly been revealed deep into the Northwest Passage after driting a considerable distance whilst out of radio contact:

OBuoy14-20170221-Location

Not only that, but the ice on the buoy’s camera has melted enough to reveal a distant horizon:

O-Buoy 14 image from February 21st 2017


[Edit – February 24th]

The glaze over the webcam’s lens is gradually melting:

OBuoy14-20170224-2201

As suggested by “Oale” below, here’s the CIS ice chart for the Canadian Arctic Archipelago:

CIS-CAA-SoD-20170220


[Edit – February 25th]

O-Buoy 14 is waking up earlier each day, and the view is getting clearer too:

OBuoy14-20170225-1701

OBuoy14-20170225-2201


[Edit – February 26th]

The lens of O-Buoy 14’s has cleared, resulting in some very pretty pictures being beamed back to base:

OBuoy14-20170226-1901

OBuoy14-20170226-2301


[Edit – February 28th]

There’s now enough energy stored in O-Buoy 14’s batteries when the sun is above the horizon to keep her operating into the long nights:

OBuoy14-battery-voltage-20170228

Watch this space!

Summer 2016 Surface Melt Takes Off

June has arrived, and according to the Great White Con Arctic sea ice calendar that means the summer surface melting season has started. Once July arrives bottom melt should have started in earnest too, but for now let’s stick to the surface. Here’s the Climate Reanalyzer map of Arctic surface air temperatures at 06:00 UTC this morning:

CCI-T2-2016-06-04-0600

Green areas are above 0 degrees Celsius, and bear in mind that the melting point of sea ice is at around -1.8 degrees Celsius. The red areas near the East Siberian Sea coast are 25-30 degrees Celsius. Given those sort of temperatures you might well think that some snow and/or ice in that area would be melting, and you would be correct! Here is the Japan Aerospace Exploration Agency’s current map of Arctic surface melting:

AM2SI20160603A_SIT_NP

The assorted shades of blue/grey show the areas where surface melting is already underway. Whilst this melting is taking place you may possibly read in some quarters of the cryodenialosphere that “There is almost no melting going on in the Arctic“. The authors of such nonsense evidently don’t know their proverbial Arctic arse from their elbow.

Here’s how today’s surface melting in the East Siberian Sea looks from space:

NASA Worldview “false-color” image of the East Siberian Sea on June 4th 2016, derived from the MODIS sensor on the Terra satellite

Meanwhile over on the other side of the Arctic, here’s yesterday’s surface melting on “Amundsen’s Route” through the Northwest Passage:

NASA Worldview “false-color” image of the Northwest Passage on June 3rd 2016, derived from the MODIS sensor on the Aqua satellite

By way of further illustration of the fact that Arctic sea ice is and has been melting, here is a graph of the current area of sea ice in the all important central area of the Arctic Basin, courtesy of “Wipneus” at Arctische Pinguin:

basin-area-20160603

The areas included are the Central Arctic Basin, plus the Beaufort, Chukchi, East Siberian and Laptev Seas. The above zero temperatures are forecast to spread across the Central Arctic Basin early next week, whereupon it will be very interesting to discover what happens to the snow around the single ice mass balance buoy currently transmitting near real time data. Here is the current temperature profile for the sea ice underneath IMB buoy 2015F:

2016-06-02_2015F

The current conditions there are summarised this morning as:

Pos: 82.00 N, 147.45 W
Air Temp: -3.74 C
Air Pres: 1007.42 mb
Snow depth: 21 cm
Ice thickness: 202 cm

Normally by now there would also be a number of webcams beaming back pictures from across the sea ice in the Arctic Basin. However according to NOAA:

Due to funding constraints, it was not possible to deploy new Web Cams in Spring 2016, but deployments in Spring 2017 are planned.

Three of the camera carrying O-Buoys also seem to have failed over the winter, which leaves us with only O-Buoy 14 to reveal the forthcoming melt to us:

O-Buoy 14 image from June 2nd 2016

O-Buoy 14 is currently colocated with Ice Tethered Profiler 89, the yellow object in the foreground, at 77.49° N, 153.92° W, to the north of the Beaufort Sea. ITP 89 measures the temperature and salinity of the water beneath the sea ice and revealed this the last time it managed to take a measurement, a month or so ago:

itp89-20160604

If you examine the extreme right hand edge of the charts carefully you will no doubt note that the water underneath the ice has recently become both warmer and saltier.

Watch this space!

[Edit – June 5th 2016]

The latest JAXA/ADS map shows that the area of sea ice undergoing surface melting has increased since yesterday, particularly over the Chukchi Sea:

AM2SI20160604A_SIT_NP

The recent clouds over the Beaufort Sea cleared yesterday. Here’s a close up view of the open water between the big floes from the Suomi satellite:

Beaufort-Floes-Suomi-20160604

For a more distant perspective see our Summer 2016 image archive.

It’s not simply the surface that’s melting either. Here’s the latest “high resolution” AMSR2 sea ice area graph for the Pacific side of the Arctic:

2016-06-04-Pacific-AMSR2-Area

Barrow Battered By Big Waves

The first big waves of 2015 have been battering the town of Barrow, Alaska today and they’ve already broken through the coastal defences. Firstly take a look at the view from the Barrow webcam during a less damaging storm on September 4th last year:

BarrowCam_20140904_0834

Now take a look at the view from the same camera earlier today, and play “spot the difference” with me:

BarrowCam_20150827_1749

The cause of the flooding that is all too visible is a cyclone that’s been whirling around in the Chukchi Sea for a while, and here is a WaveWatch III “hindcast” of what the resultant winds have created in the way of waves. Firstly the “significant wave height”:

alaska_height_20150827_015h

and now the “peak period”:

alaska_period_20150827_015h

which reveal a swell 4 to 5 metres high with a period of 10 seconds heading directly towards Barrow Beach. According to the Alaska Dispatch News:

Huge, wind-whipped waves crashed onto the shore at Barrow on Thursday, forcing the closure of a nearby road. Westerly winds were gusting up to 50 miles an hour, pushing waves up to the top of the beach and causing some erosion, the National Weather Service said.

The service has issued a coastal flood warning for Barrow until Friday morning, along with a high surf advisory for the western part of the North Slope and a gale warning for much of the Beaufort and Chukchi Seas.

The big surf and flooding, which has covered a road that runs between the ocean and Barrow’s lagoon, is “not terribly unusual” at this time of the year, said Ryan Metzger, a National Weather Service meteorologist in Fairbanks. Fall is a stormy season, and the timing — right around the annual minimum sea ice extent — allows the surf to build and reach shore.

Photograph by Brittni Driver via Alaska Dispatch News

Just in case it’s not obvious from all the pictures, the respective advisory messages point out that:

A COASTAL FLOOD WARNING MEANS THAT RISING SEA WATER THAT CAUSES FLOODING IS EXPECTED. COASTAL RESIDENTS IN THE WARNED AREA SHOULD BE ALERT FOR RISING WATER…AND TAKE ACTIONS TO PROTECT LIFE AND PROPERTY.

A HIGH SURF ADVISORY MEANS THAT LOCALIZED BEACH EROSION IS EXPECTED. PRECAUTIONS SHOULD BE TAKEN TO PROTECT PROPERTY.

If you’re now wondering what might happen to other areas of the north coast of Alaska in similar circumstances, but with no bulldozer in attendance, here’s an example from Cape Halkett:

According to to the United States’ Climate Resilience Toolkit:

Thawing permafrost causes coastline collapse on Alaska’s North Slope, which is no longer kept frozen and protected from fall storms by sea ice—the ice now forms later in the season.

Away from the coast swell from the same cyclone has also been affecting the sea ice north of Barrow, and here’s what a webcam bobbing about on a buoy north of the Chukchi Sea showed as the winds started to build yesterday:

O-Buoy 12 image from August 26th 2015

O-Buoy 12 has now tipped over and then ceased transmitting. This is the last picture received, in the early hours of August 27th when the wind speed had reached 13 m/s and the buoy had been moving at over 5 m/s:

OBuoy12-20150827-1

Once upon a time O-Buoy 12 was sat on the same ice floe as ice mass balance buoy 2014G, which has also been free floating for a while. Here’s what it reveals about the temperature of the sea water on August 26th 2015 at 77.56 N, 163.86 W:

2015-08-26_2014G

Somewhere in the vicinity of -0.7 °C.

[Edit on 30/08/2015]

O-Buoy 12 has made no further transmissions, and therefore seems to have succumbed to the storm. In addition IMB buoys 2014F and 2013F stopped transmitting on the 26th and 27th of August respectively. Ice mass balance buoy 2014G has survived however, and reports two successive record daily distances travelled:

2015-08-29-2014G-Map

25.6 km on August 26th, followed by 36.3 km on the 27th. After a brief dip during the cyclone water temperature is still around -0.7 °C.

Presumably as a result of the cyclone JAXA Arctic sea ice extent has taken a tumble over the last few days. It has stabilised this morning slightly above 2007 levels:

JAXA-aug29

Here is the current AMSR2 Arctic sea ice concentration map from the University of Hamburg, revealing a large potential fetch across the East Siberian, Chukchi and Beaufort Seas should any further cyclones occur in the area over the next few weeks:

AMSR2 Arctic sea ice concentration on August 29th from the University of Hamburg

Hence the conditions now exist for an even more damaging swell to be generated before the 2015 minimum Arctic sea ice extent is reached.

Russia’s Northern Shores

Regular readers will have realised by now that we’ve been pestering the Mail and The Telegraph with telephone calls and emails for weeks now. That’s because, as The Economist put it last weekend:

There are climate facts—and facts are stubborn things.

Both The Mail and The Telegraph have now corrected a couple of the gross inaccuracies they printed (virtually and/or physically) on September 8th, but many more remain. One of those is the identical phrase in both articles saying:

An unbroken ice sheet more than half the size of Europe already stretches from the Canadian islands to Russia’s northern shores.

The fact of the matter is that this statement is untrue. I’ve recently received a couple of letters about this from “The Daily Telegraph” signed by “Robert Winnett, Head of News”. Here’s an extract from the first one:

Them:

Reputable evidence exists to show an unbroken ice sheet more than half the size of Europe already stretches from the Canadian islands to Russia’s northern shore.  This can be seen on the National Snow and Ice Data Center’s website [in the article] “A Real Hole Near the North Pole“.  The site states that the average ice extent for August 2013 was 6.09 million square kilometres, which is more than half the size of Europe.

Us:

Have I got news for you Robert!  If you’d read any of the articles on here, or watched any of the videos I linked to in my emails, that wasn’t the “fact” I was quibbling about. The fact is that the Arctic “ice sheet” was not “unbroken” and did not “stretch… to Russia’s northern shore” on September 8th 2013 and for considerable periods of time both before and after that date. Here’s an extract from The Telegraph’s second letter:

Them:

In reply to your enquiry, the Telegraph’s policy is to correct clear inaccuracies once we are alerted to them – and in appropriate cases update articles on our website.

Us:

I thought I’d already made this perfectly plain, but evidently not, so here’s yet another alert about clear inaccuracies in the “reporting” of climate science in The Telegraph: