Category Archives: Greenland

Steven Koonin’s Unsettled Greenland Ice Sheet Science

For our latest review of Steven E. Koonin’s new book, “Unsettled”, we’re moving from the ice covering the Arctic seas on to land. Greenland to be specific. Unlike Arctic sea ice the Greenland Ice Sheet does merit a mention in the book. In fact it’s one of the bullet points Steve leads with on page 2:

Here are three more [climate facts] that might surprise you, drawn directly from recent published research or the latest assessments of climate science published by the US government and the UN:

  • Humans have had no detectable impact on hurricanes over the past century.
  • ​Greenland’s ice sheet isn’t shrinking any more rapidly today than it was eighty years ago.
  • The net economic impact of human-induced climate change will be minimal through at least the end of this century.

So what gives?

A very good question Steve, because if we stick with the Arctic land ice referred to in the middle bullet, Professor Koonin makes no reference at this juncture to any “recent published research or latest assessment of climate science” to justify his assertion.

Which is a bit of a shame since in the Climate Feedback critique of Professor Koonin’s statement which was mentioned in our introductory article, Twila Moon from the United States’ National Snow and Ice Data Center points out that:

This statement is untrue. In fact, the Greenland Ice Sheet lost more mass during 2003-2010 than during all of 1900-2003 combined. This is evident in the following figure from Kjeldsen et al. (2015)

This image has an empty alt attribute; its file name is Greenland-Kjeldsen-2015-1024x713.png
Surface elevation change rates in Greenland during 1900-1983 (a), 1983-2003 (b), and 2003-2010 (c). The numbers listed below each panel are the integrated Greenland-wide mass balance estimates expressed as gigatonnes per year and as millimetre per year GMSL (global mean sea level) equivalents.

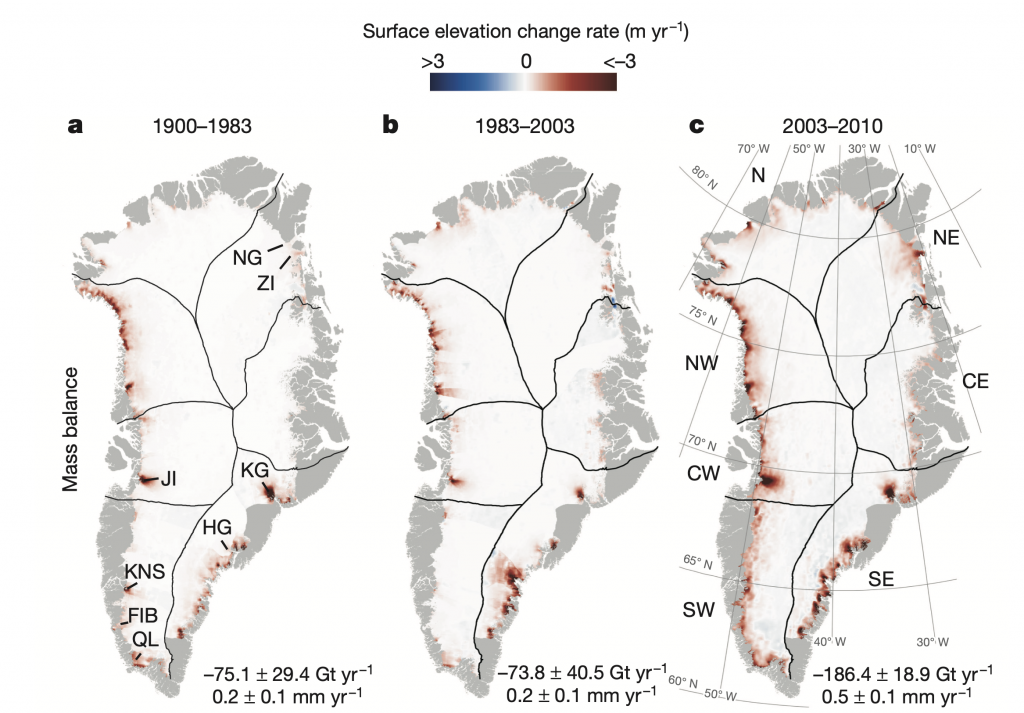
If we look in more detail at changes over 1972-2018, we can further see that the ice sheet was mostly in balance (gain about the same amount of snow/ice in winter as is lost in summer) during the 1970s and 1980s [Mouginot and Rignot et al. (2019)]. It was only in the mid-1990s that Greenland ice loss began to increase more substantially.

Over the last 20 years, ice loss has been rapid and large, creating measurable sea level rise, which we experience as increases in coastal erosion, flooding, problems with water and sewer systems at the coasts, and saltwater inundation of freshwater sources.

So how is it possible for Steve Koonin to have got his facts so wrong? For his attempt at justification we have to wait until chapter 8 of “Unsettled” on the subject of “Sea Level Scares”. On page 160 of my Kindle edition Steve writes:

So future global sea level rise is uncertain not only because of all of the model uncertainties in the global temperature rise discussed in Chapter 4, but also because the dynamics of the Greenland and Antarctic ice sheets are quite uncertain. The IPCC summarizes the situation (SMB is the Surface Mass Balance, measuring the net change in ice due to atmospheric processes): . . .

“For periods prior to 1970, significant discrepancies between climate models and observations arise from the inability of climate models to reproduce some observed regional changes in glacier and GIS [Greenland Ice Sheet] SMB around the southern tip of Greenland. It is not clear whether this bias in climate models is due to the internal variability of the climate system or deficiencies in climate models. For this reason, there is still medium confidence in the ability of climate models to simulate past and future changes in glaciers mass loss and Greenland SMB.”

The reference for this quotation is given as “IPCC SROCC Section 4.2.2.2.6“, which on inspection is entitled “Budget of global mean sea level change”. The immediate question that springs to my mind is “Why didn’t Steve refer to SROCC Section 1.4.2?”. That section is entitled “Observed and Projected Changes in the Cryosphere”, and skipping over the Arctic sea ice section for the moment it states:

AR5 assessed that the annual mean loss from the Greenland ice sheet very likely substantially increased from 34 (-6–74) Gt yr–1 (billion tonnes yr–1) over the period 1992–2001, to 215 (157–274) Gt yr–1 over the period 2002–2011.

Or Steve might have quoted from Section 4.2.2.2.4 “Greenland and Antarctic ice sheets”, but for some reason he didn’t:

Frequent observations of ice sheet mass changes have only been available since the advent of space observations (see Section 3.3.1). In the pre-satellite era, mass balance was geodetically reconstructed only for the GIS (Kjeldsen et al., 2015)

op. cit., or as suggested there he could even have quoted from Section 3.3.1 “Ice Sheet Changes”, but once again he didn’t:

The GIS was close to balance in the early years of the 1990s (Hanna et al., 2013; Khan et al., 2015), the interior above 2000 m altitude gained mass from 1961 to 1990 (Colgan et al., 2015) and both coastal and ice sheet sites experienced an increasing precipitation trend from 1890 to 2012 and 1890 to 2000 respectively (Mernild et al., 2015), but since the early 1990s multiple observations and modelling studies show strong warming and an increase in runoff (very high confidence).

Personally I have very high confidence that Professor Koonin had great difficulty cherry picking a Greenland Ice Sheet quote from the IPCC that could be “spun” into supporting his case. Frankly his “southern tip of Greenland” effort smacks of desperation.

Unsettling, is it not?

[Edit – June 12th]

Here’s a long thread on Twitter from Helen Fricker, explaining the genesis of the IPCC’s Special Report on the Ocean and Cryosphere in a Changing Climate. Essential reading for Steve Koonin, since he is apparently unaware of any of this!

Helen refers to her recent op-ed for The Hill which goes into slightly more detail:

The upcoming sixth IPCC report in 2022 will contain updated projections of future sea level rise based on tens of different simulations provided by research groups around the world. These groups all worked together in a community-led effort, involving ice sheet, ocean and atmosphere modeling and observational teams.

We have come a long way, but even after all this we are still playing “catch-up,” and there are still gaps in our understanding. We do know, however, that the ocean is warming and that both Antarctica and Greenland are vulnerable to this warming. The same goes for the atmosphere. We worry that the biggest portion of Antarctica, East Antarctica — which we still think of as a sleepy giant since it is so thick and vast, making it harder for warming ocean waters and increasing air temperatures to reach it — is starting to show signs of change. We also worry that there may be mechanisms, that we have not been able to witness in the modern record and hence that are not in the models, that may amplify the ice loss. Scientists are using paleo-reconstructions to figure out whether these may be important.

Still, we can say with confidence that sea level will continue to rise (faster) in the future and that our projections are conservative estimates. Indeed, satellite observations that measure the changing height (altimetry) and changing mass (gravimetry) of ice sheets are tracking the worst-case predictions from IPCC’s fifth report.

As we gather more data, both on and around the ice sheets using all available tools, including satellites, our observational record gets longer and our understanding improves. As our understanding improves, our models get better. Long-term measurements, sometimes acquired by launching new satellites (such as NASA’s ICESat-2 and other follow-on missions), coordinated modeling and international collaboration are key to delivering more accurate predictions, so that coastal communities can make informed decisions to protect infrastructure and citizens and manage resources.

Shock News – Massive Calving of Jakobshavn Isbræ

We reported on similar “Shock News” back in February 2015, and now it’s happened again.

Here is a large animation of recent events at the Jakobshavn Glacier calving front, courtesy of Espen Olsen at the Arctic Sea Ice Forum.

Click to view the ~5 Mb file at full resolution:

[Edit – May 6th]

In the absence of further input from the somewhat “skeptical” commenter below, here is an extract from one of the “~1420 recent academic articles” referred to. Namely “Bed elevation of Jakobshavn Isbrae, West Greenland, from high-resolution airborne gravity and other data: Bed topography of Jakobshavn Glacier” by Lu An, Eric Rignot et al.:

Jakobshavn Isbræ, West Greenland, which holds a 0.6 m sea level volume equivalent, has been speeding up and retreating since the late 1990s. Interpretation of its retreat has been hindered by difficulties in measuring its ice thickness with airborne radar depth sounders. Here we employ high-resolution, helicopter-borne gravity data from 2012 to reconstruct its bed elevation within 50 km of the ocean margin using a three-dimensional inversion constrained by fjord bathymetry data offshore and a mass conservation algorithm inland.

We find the glacier trough to be asymmetric and several 100 m deeper than estimated previously in the lower part. From 1996 to 2016, the grounding line migrated at 0.6 km/yr from 700 m to 1100 m depth. Upstream, the bed drops to 1600 m over 10 km then slowly climbs to 1200 m depth in 40 km.

Jakobshavn Isbræ will continue to retreat along a retrograde slope for decades to come.

Watch this space!

Could Northabout Circumnavigate Greenland in 2018?

Our regular reader(s) may recall our extended coverage on the plucky little yacht Northabout‘s ultimately successful attempt to circumnavigate the Arctic Ocean in the summer of 2016?

Many were the skeptics who said she stood no chance of finding a way through some “thick sea ice” apparently blocking her path across the Laptev Sea, but they were proved wrong:

As a thought experiment in the summer of 2018 we’re now thinking the unthinkable. If she put her mind to it could Northabout circumnavigate Greenland in 2018? Let’s take a look at the evidence shall we? The allegedly “oldest, thickest Arctic sea ice” north of Greenland isn’t there any more this summer:

Nord-Aqua-721-2018-08-19

Kap-Morris-Jesup-Terra-2018-08-19

The research icebreaker Polarstern has already inspected the open waters off Kap Morris Jesup, the most northerly tip of Greenland:

Polarstern-2018-08-19-2200

What’s more the waters of the Lincoln Sea currently look no more tricky to traverse than the Laptev Sea in August 2016:

Lincoln-Terra-2018-08-19

In conclusion, for the moment at least, what’s the theoretical solution to our 2018 thought experiment?

Here’s another thought to ponder as well. I don’t suppose it’s in the Alfred Wegener Institute’s PS115 mission plan, but do you suppose Polarstern could circumnavigate Greenland at the moment?


[Edit – August 23rd]

The University of Bremen used not to publish their Arctic sea ice “thinness” maps in summer. However now they do, so here’s a close up of Northern Greenland for August 22nd:

SMOS-Zoom-20180822


[Edit – August 26th]

First of all here’s one of our occasional sea ice motion videos:

This one reveals the open water north of Greenland in February as well as the much longer event in August. Next here’s a Sentinel 1B synthetic aperture radar image of the Kap Morris Jesup area from yesterday:

S1B_MorrisJesup_20180825T1700

Meanwhile thanks to a heads up from Treform2 on the Arctic Sea Ice Forum comes evidence that on the other side of the Lincoln Sea the last remnants of the Ward Hunt Ice Shelf are “disintegrating”:

S1B_WardHunt_20180824T1442

Greenland 2016 Melt Starts A Month Early

According to the Danish Arctic research institutions’ Polar Portal this year there’s been an “Unusually Early Greenland Melt“. The article by Ruth Mottram points out that:

An early melt event over the Greenland ice sheet occurred this week, smashing by a month the previous records of more than 10% of the ice sheet melting.

Greenland-Melt-2016-04-11

Based on observation-initialized weather model runs by DMI, almost 12% of the Greenland ice sheet had more than 1mm of melt on Monday 11th April, following an early start to melting the previous day. Scientists at DMI were at first incredulous due to the early date. “We had to check that our models were still working properly” said Peter Langen, a climate scientist at DMI. “Fortunately we could see from the PROMICE.dk stations on the ice sheet that it had been well above melting, even above 10 °C. This helped to explain the results”. The former top 3 earliest dates for a melt area larger than 10% were previously all in May (5th May 2010, 8th May 1990, 8th May 2006).

Just in case you think the DMI’s models really aren’t working properly, take a look at this satellite image of South West Greenland today:

NASA Worldview “true-color” image of South West Greenland on April 12th 2016, derived from the MODIS sensor on the Terra satellite

Then head over to NASA Worldview and flip back to last year using the controls at the bottom left:

SWGreenland-Terra-2015-04-12

Can you spot the difference? According to the Polar Portal once again:

Around the coast of Greenland where DMI has climate records dating back to 1873, Greenland came close to setting a record temperature for the whole of Greenland in April. Kangerlussuaq measured a daily maximum of 17.8°C, the previous record is 18.0°C and the DMI observation station at the Summit of Greenland set a new “warm” April record of -6.6°C. “Everything is melting” observed Nuuk resident Aqqaluk Petersen.

The melt was driven by warm air advected from the SW bringing rain along the coast, similar to an extreme melt event in 2012 when 95% of the surface of the ice sheet had melt, a situation that has been reported in detail by GEUS and DMI scientists (Fausto et al., 2016).

[Edit – April 15th 2016]

It has been brought to my attention that the cloud cover in the first image above makes it difficult to see the melting ice sheet. By way of explanation, at this time of year you can use images derived from the MODIS instrument on the Aqua and Terra satellites and the VIIRS instrument on the Suomi satellite to watch the snow cover retreat across Alaska, Canada, Siberia and indeed Greenland.

There is less snow on the ground in SW Greenland than “normal” this year, and hence lower albedo. This implies there will also be less snow on the ice sheet itself, which is hence more vulnerable to “early melt”. In order to get visual confirmation of melt ponds on the ice clear blue skies are needed. You can see hints of “blue ice” through the gaps in the cloud on my first image above. To bring out the “blue ice” try following the link above to NASA Worldview and then experiment with the controls on the left. If you select “Corrected Reflectance (Bands 7-2-1) you should be able to produce an image that looks like this:

NASA Worldview “false-color” image of South West Greenland on April 12th 2016, derived from the MODIS sensor on the Terra satellite

For a closer look between the clouds here’s a “natural colour” image from Landsat 8:

A “natural color” image of South West Greenland on April 12th 2016, from the Landsat 8  satellite
A “natural color” image of South West Greenland on April 12th 2016, from the Landsat 8 satellite