The latest Alfred Wegener Institute sea ice concentration map shows that the Pacific side of the Central Arctic Basin is now almost completely refrozen:
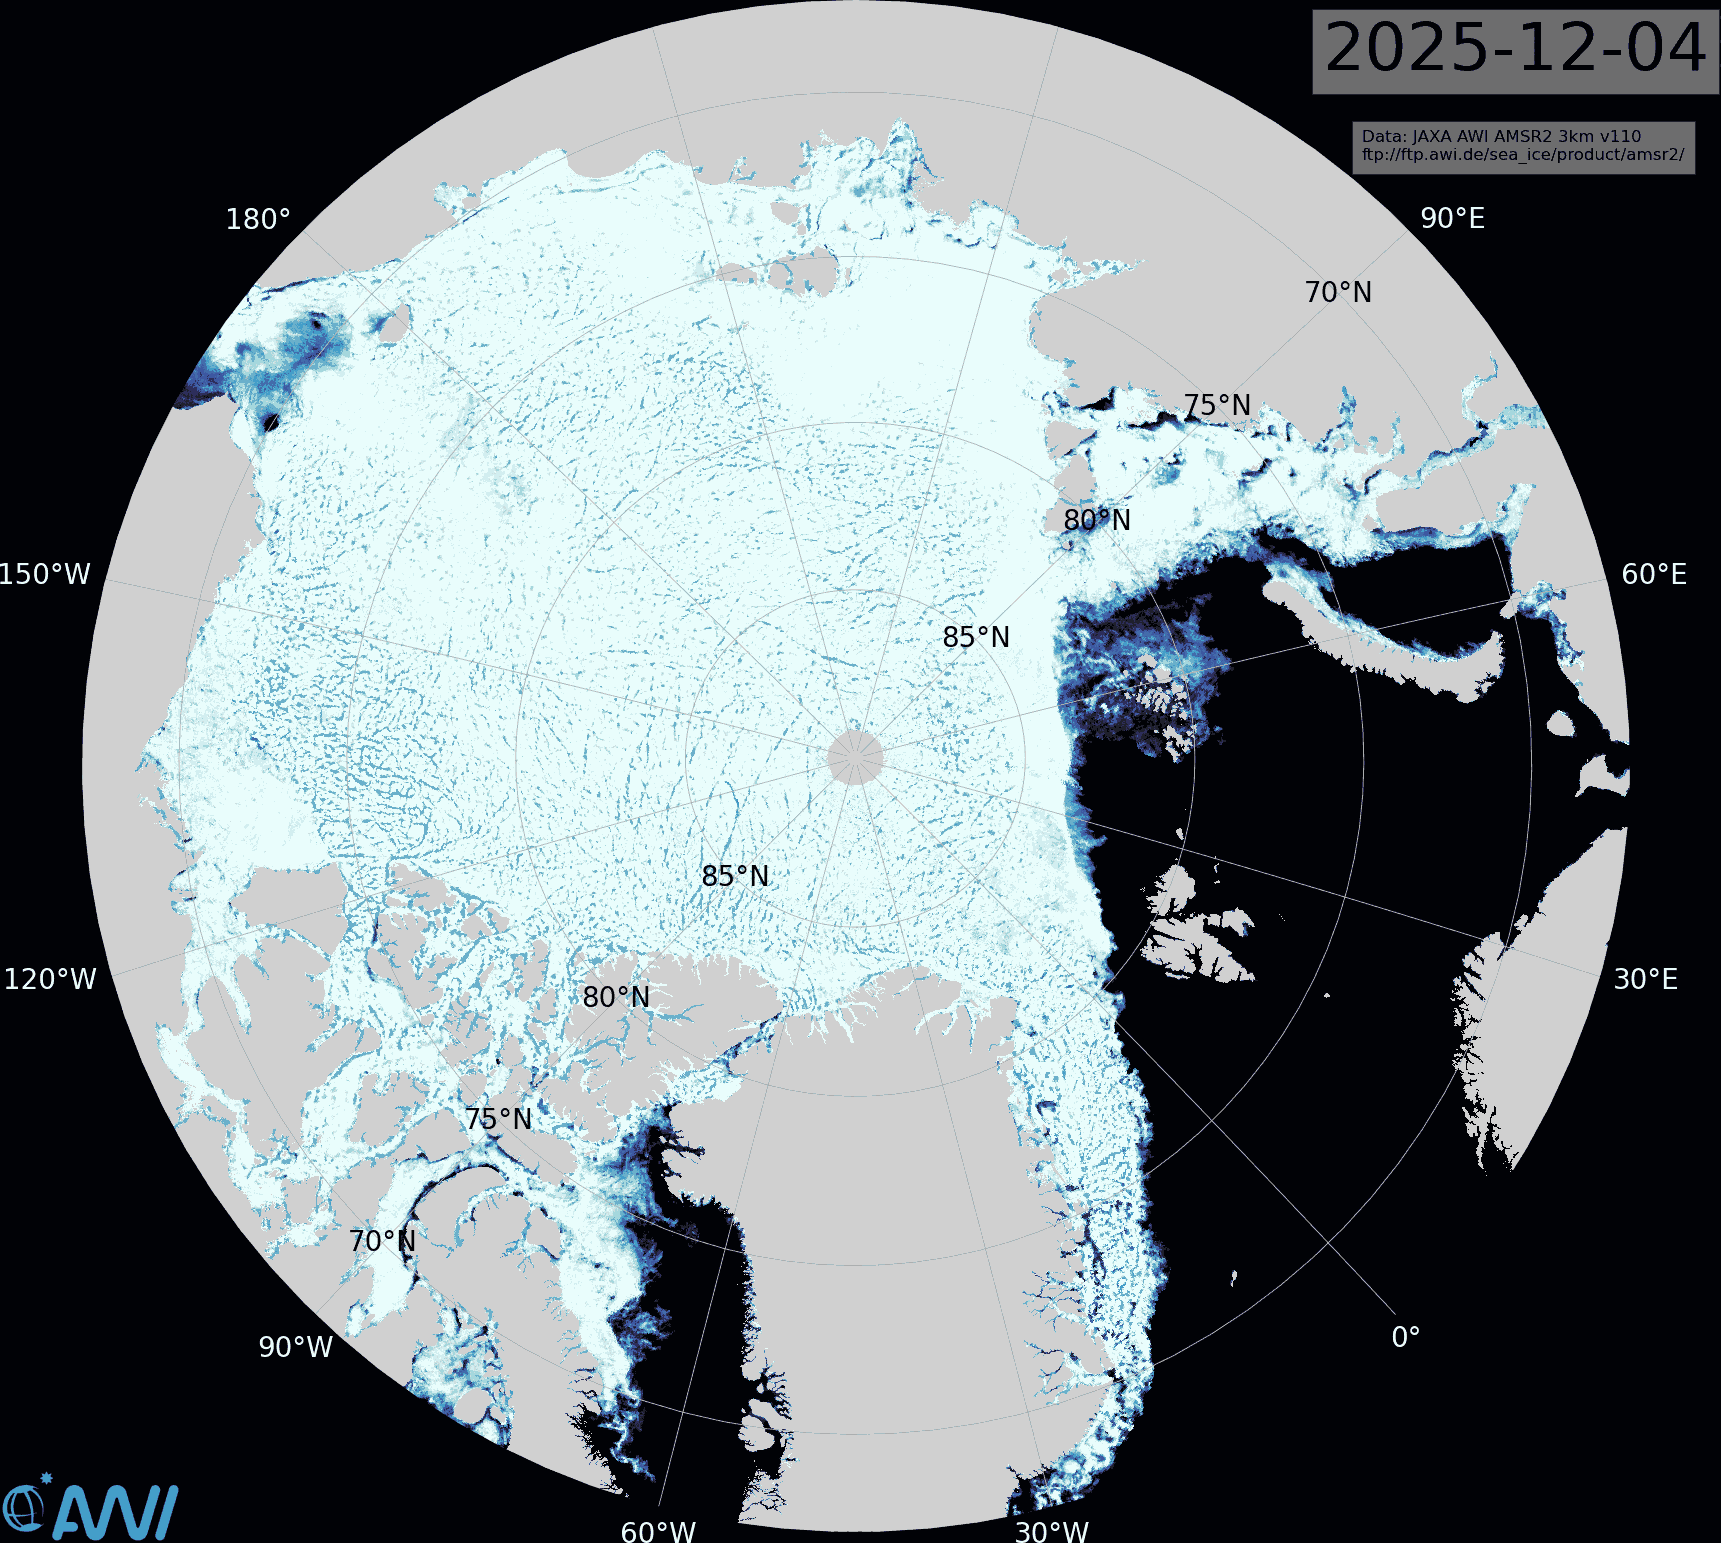
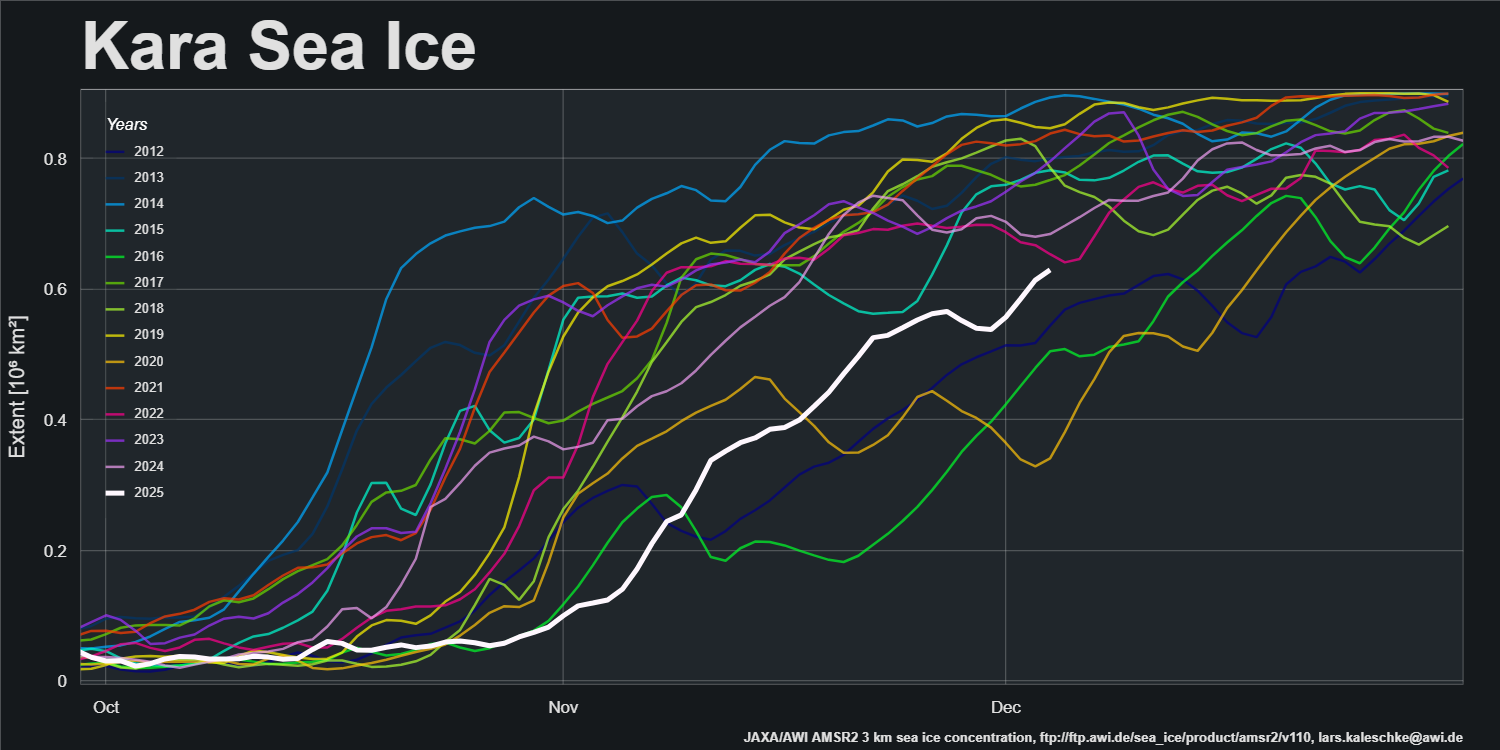
On the Atlantic side of the Arctic the Kara Sea is rapidly refreezing:
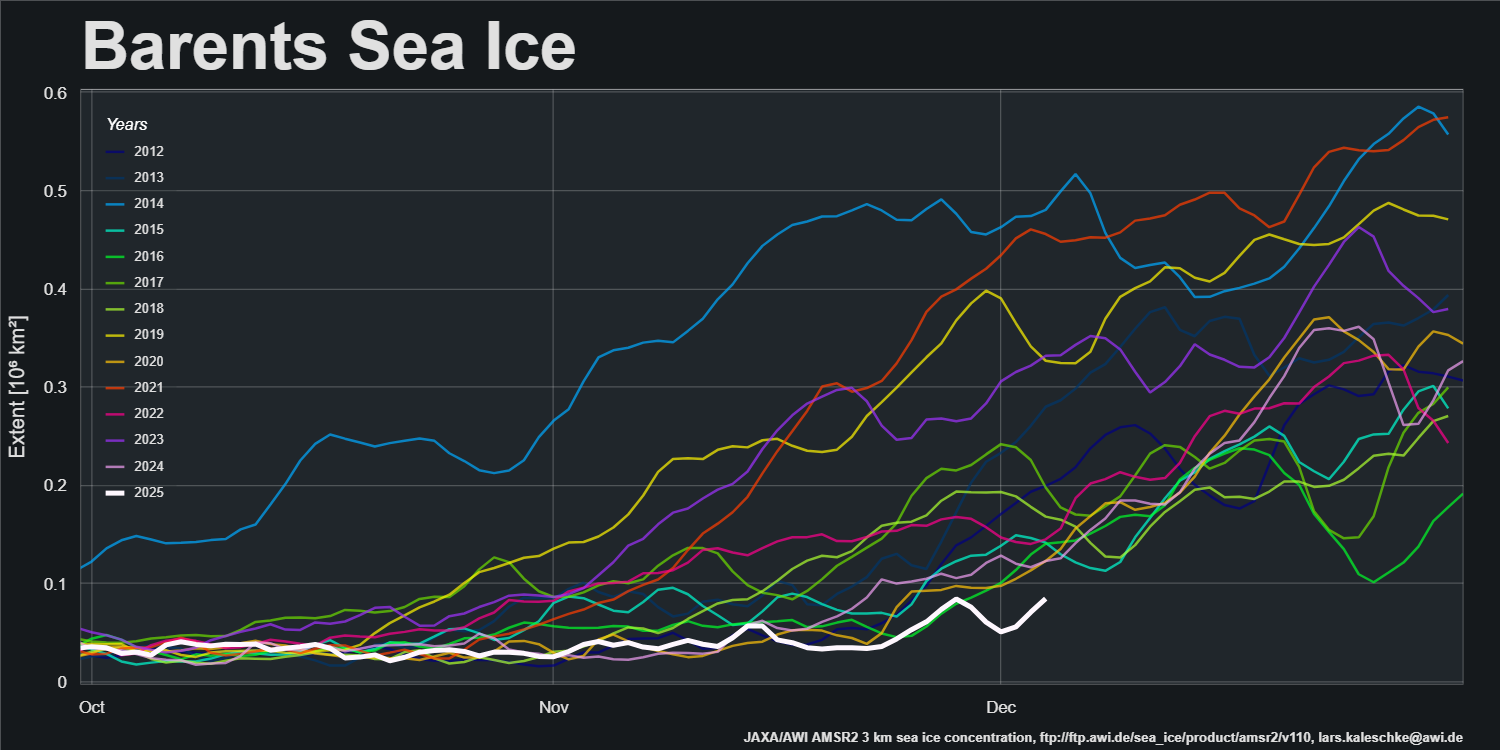
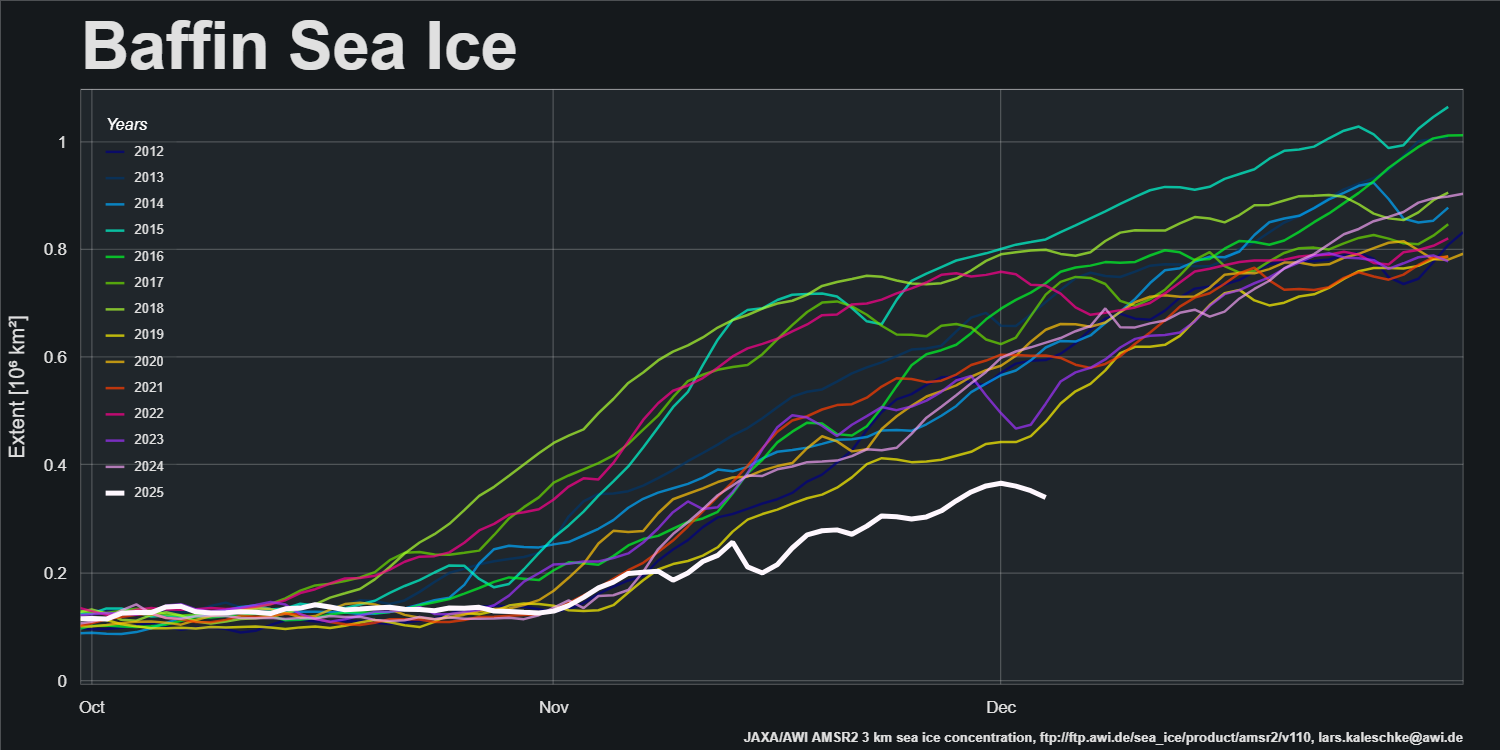
However, sea ice extent in the Barents Sea and Baffin Bay is currently lowest for the date in the AMSR2 record:
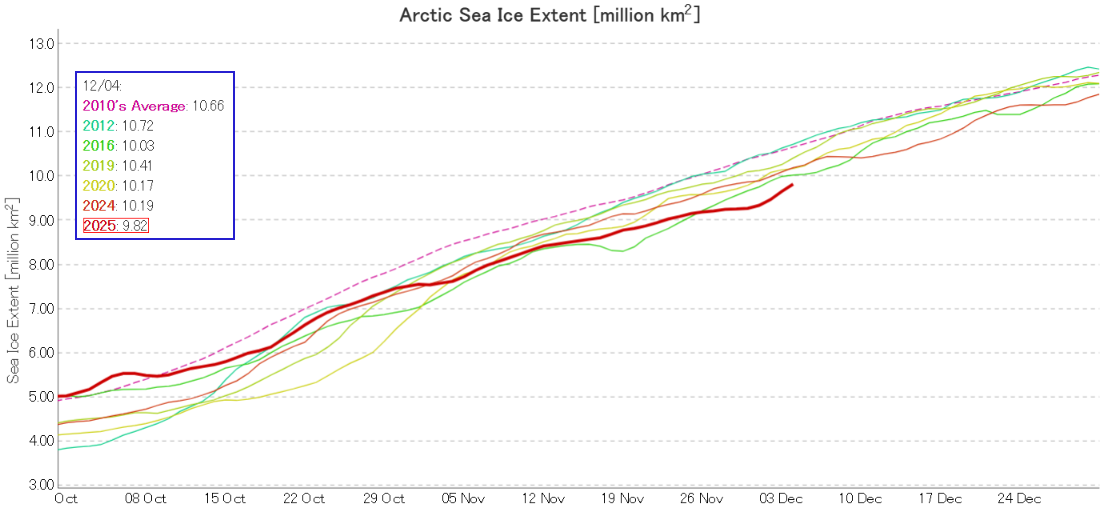
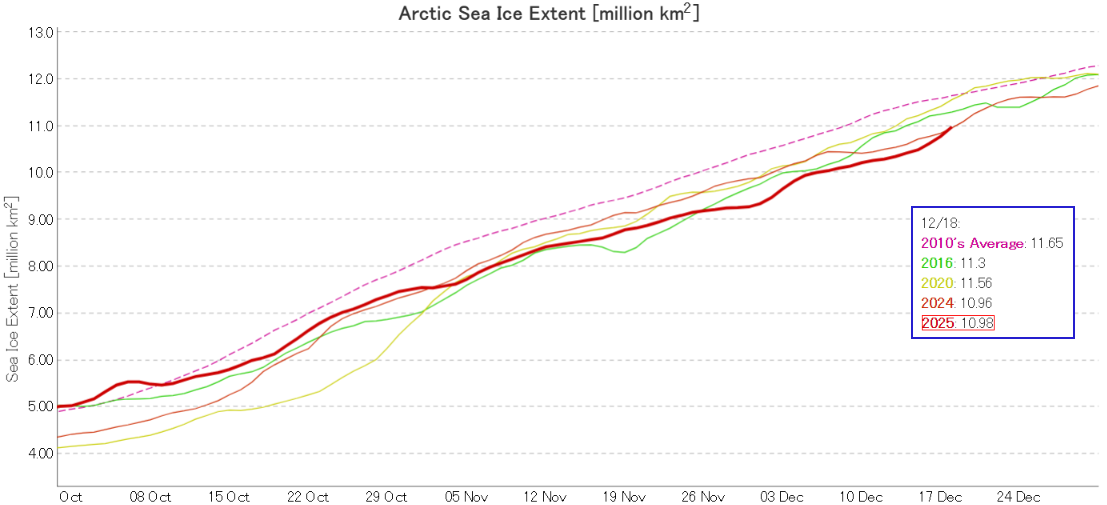
Pan Arctic JAXA/ViSHOP extent is currently lowest for the date in the satellite era:
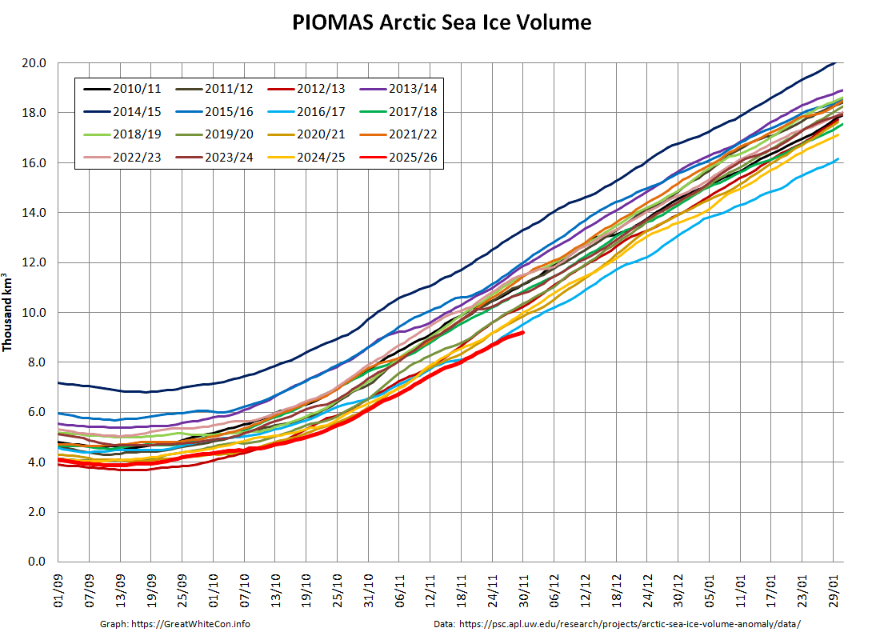
Looking at sea ice volume next, at the end of November PIOMAS volume was 9.20 thousand km³, lowest for the date (in the satellite era).
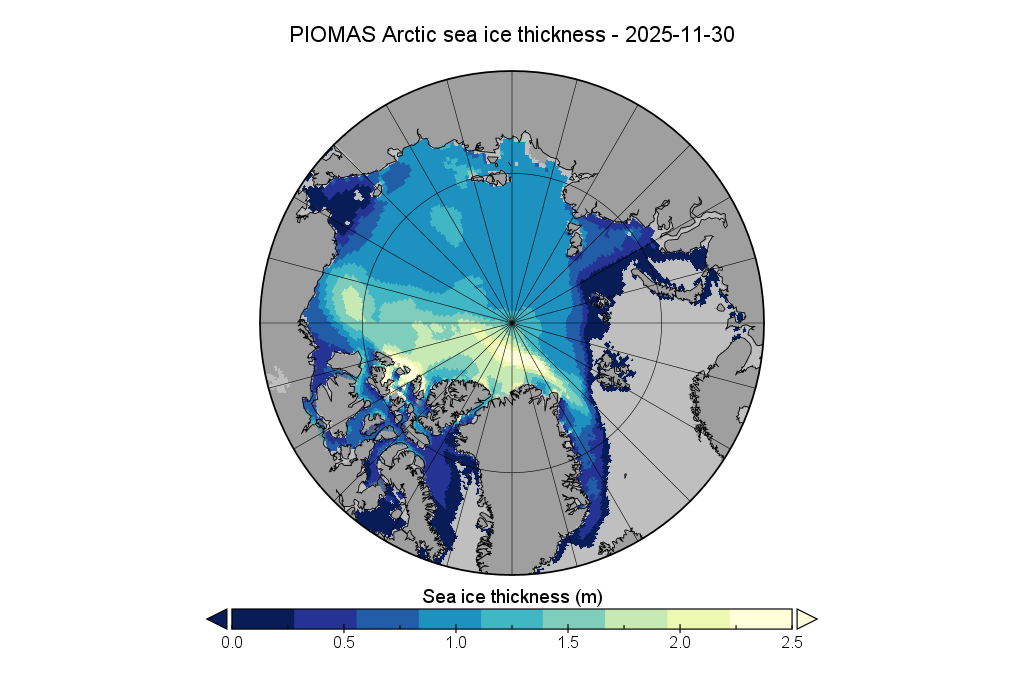
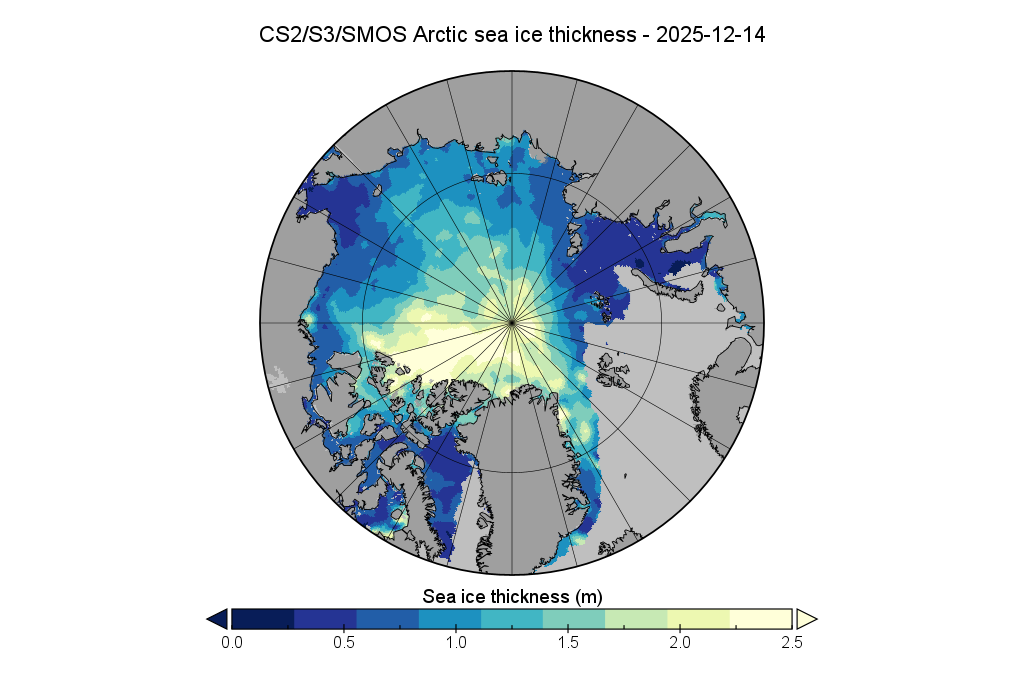
Here’s the associated sea ice thickness map:
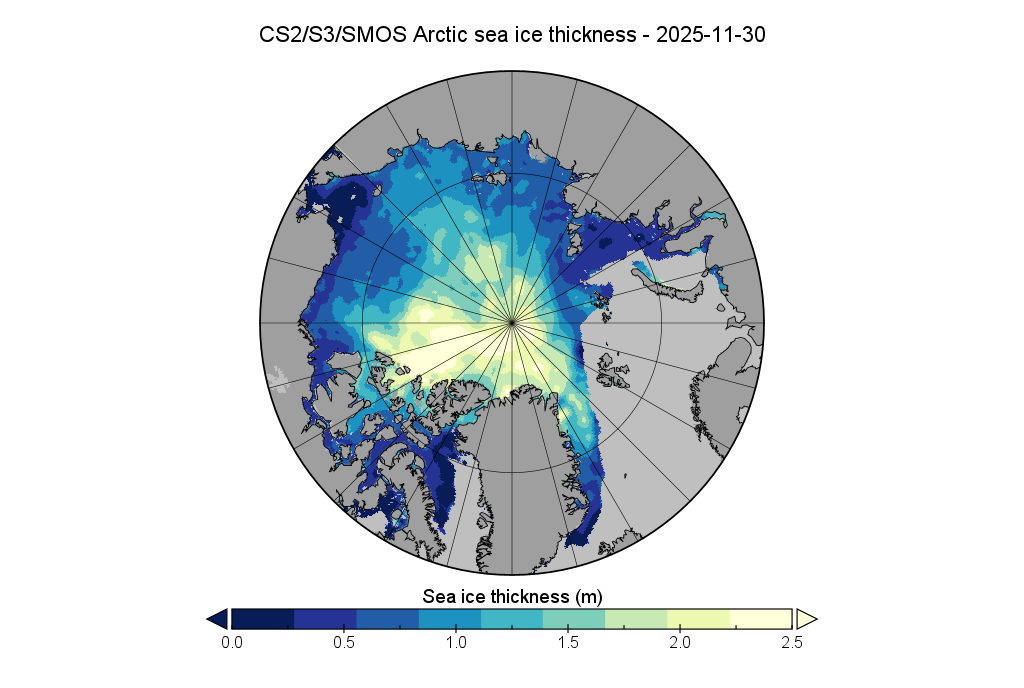
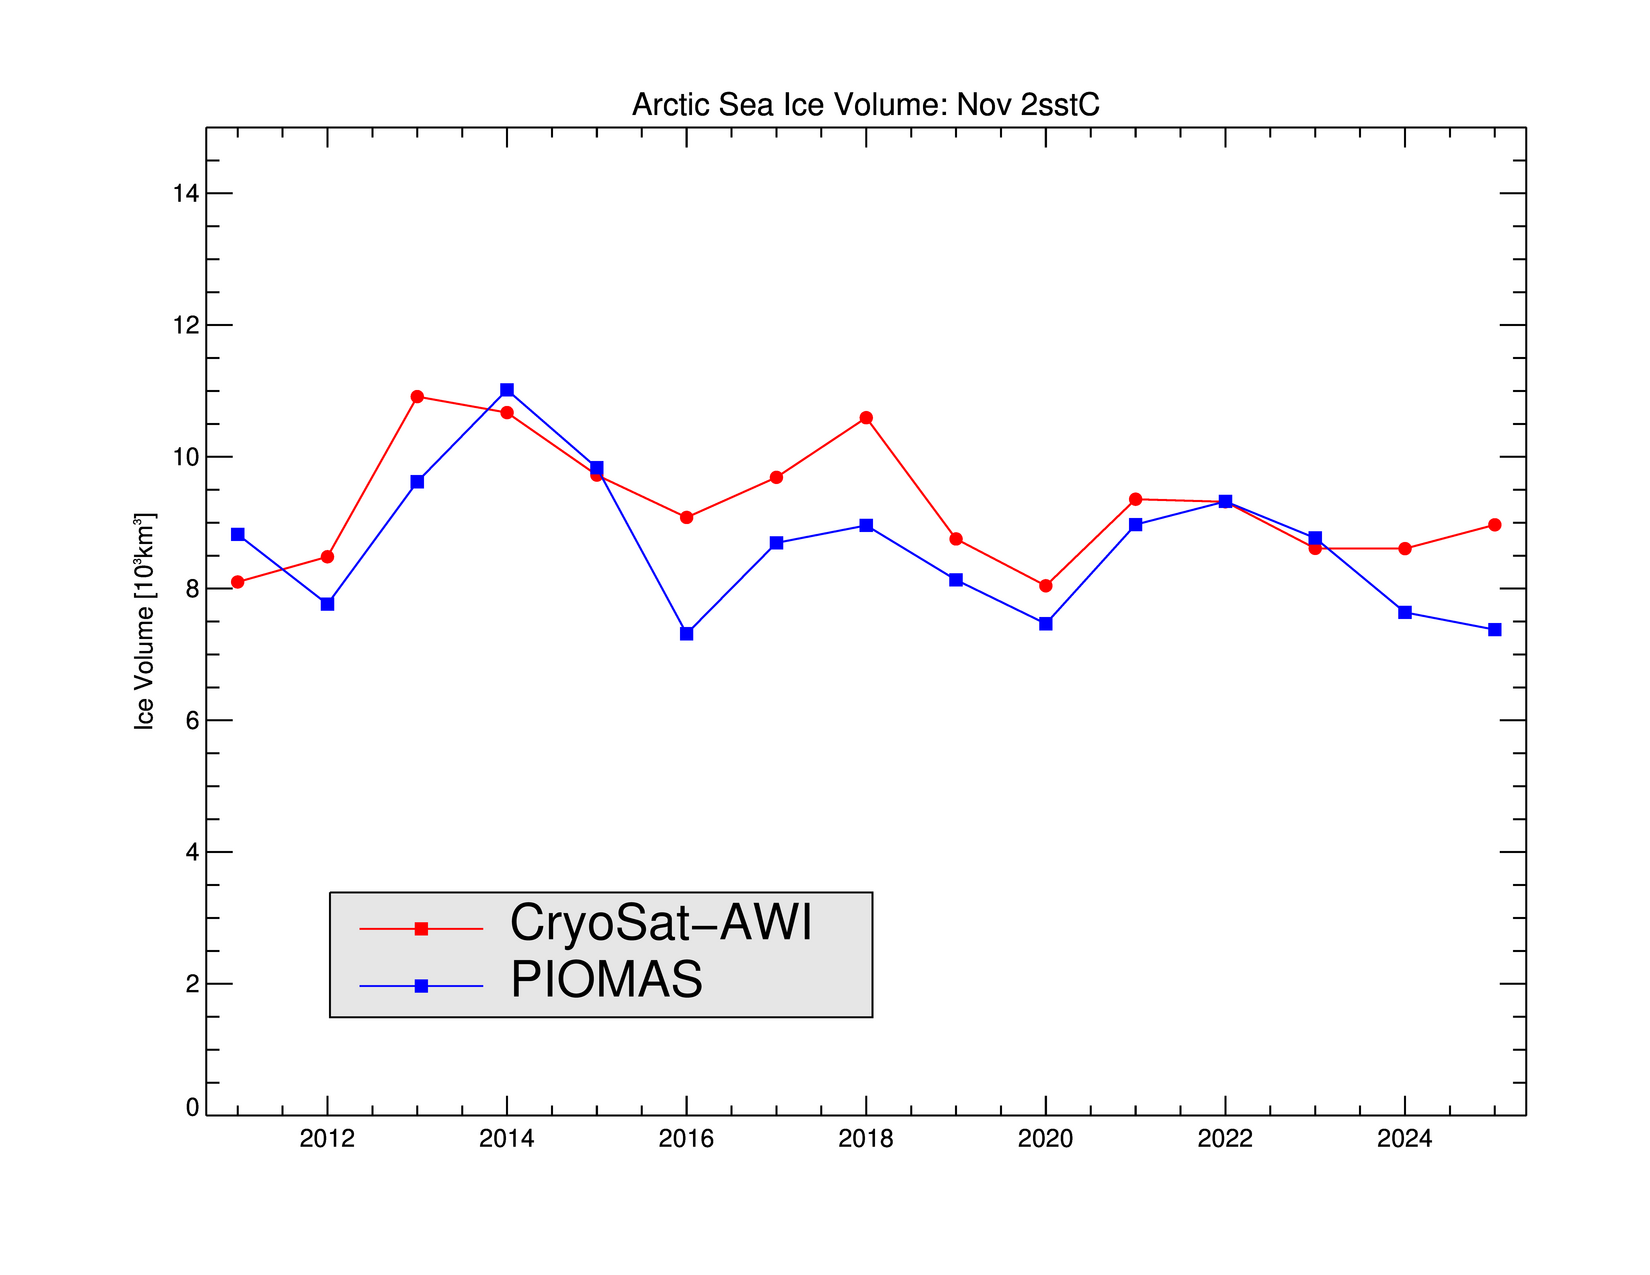
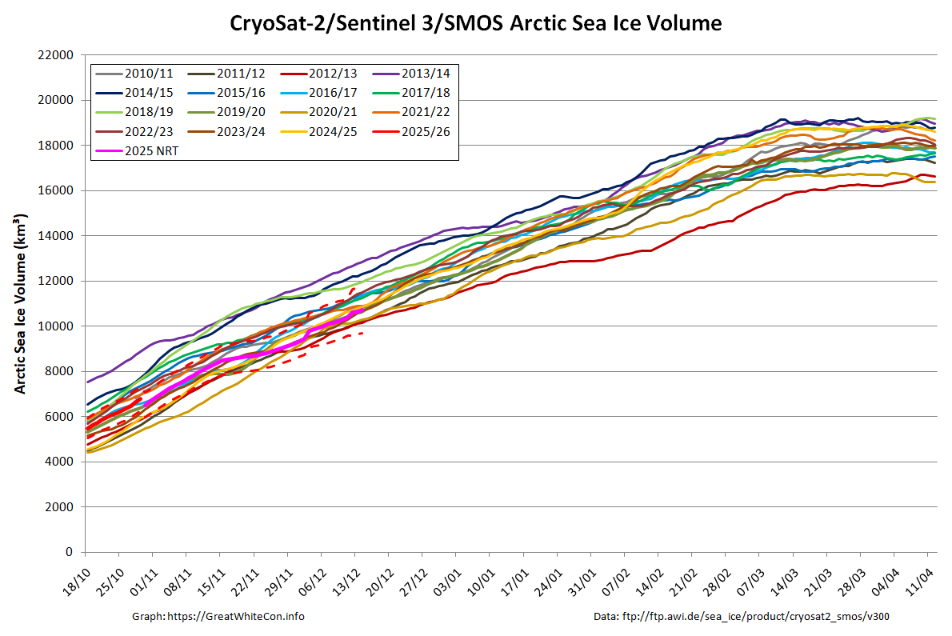
Here too is the Alfred Wegener Institute’s CryoSat-2/Sentinel 3/SMOS Arctic sea ice thickness map at the end of November:
and the associated volume graph:

As you can see, the “measured” data suggests that sea ice in the central Arctic is thicker than the PIOMAS model shows:
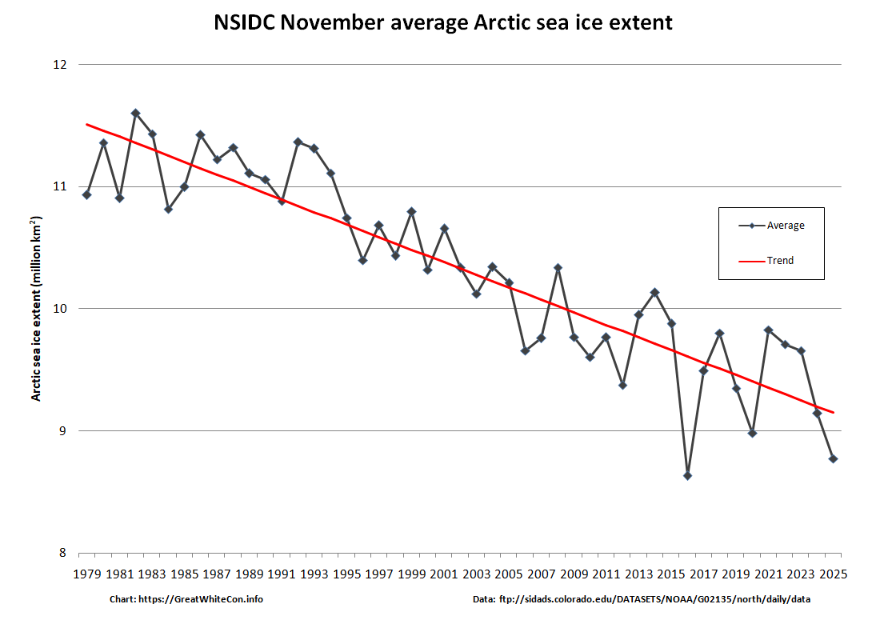
Especially for Peter, here is the trend in NSIDC November average extent:
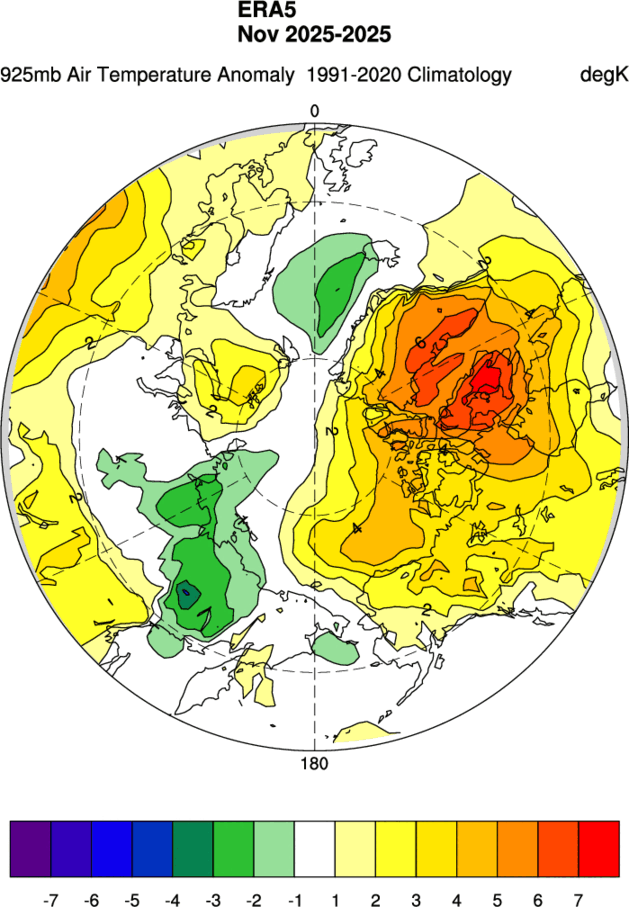
Since these maps are no longer provided by the NSIDC due to US climate science budget cuts, here too are the ERA5 MSLP and 925 hPa air temperature anomaly maps for November:
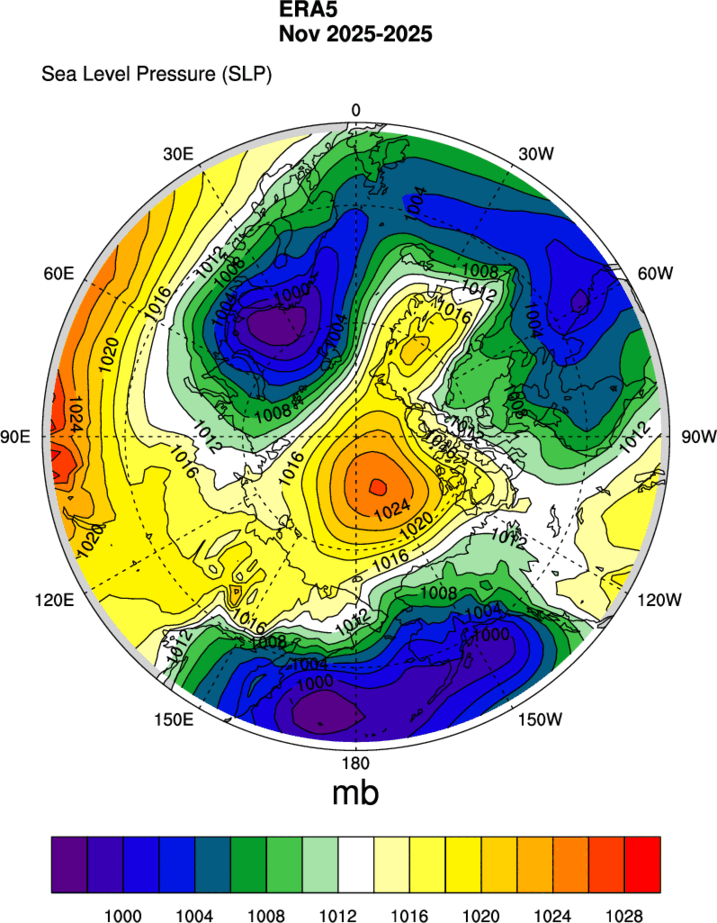
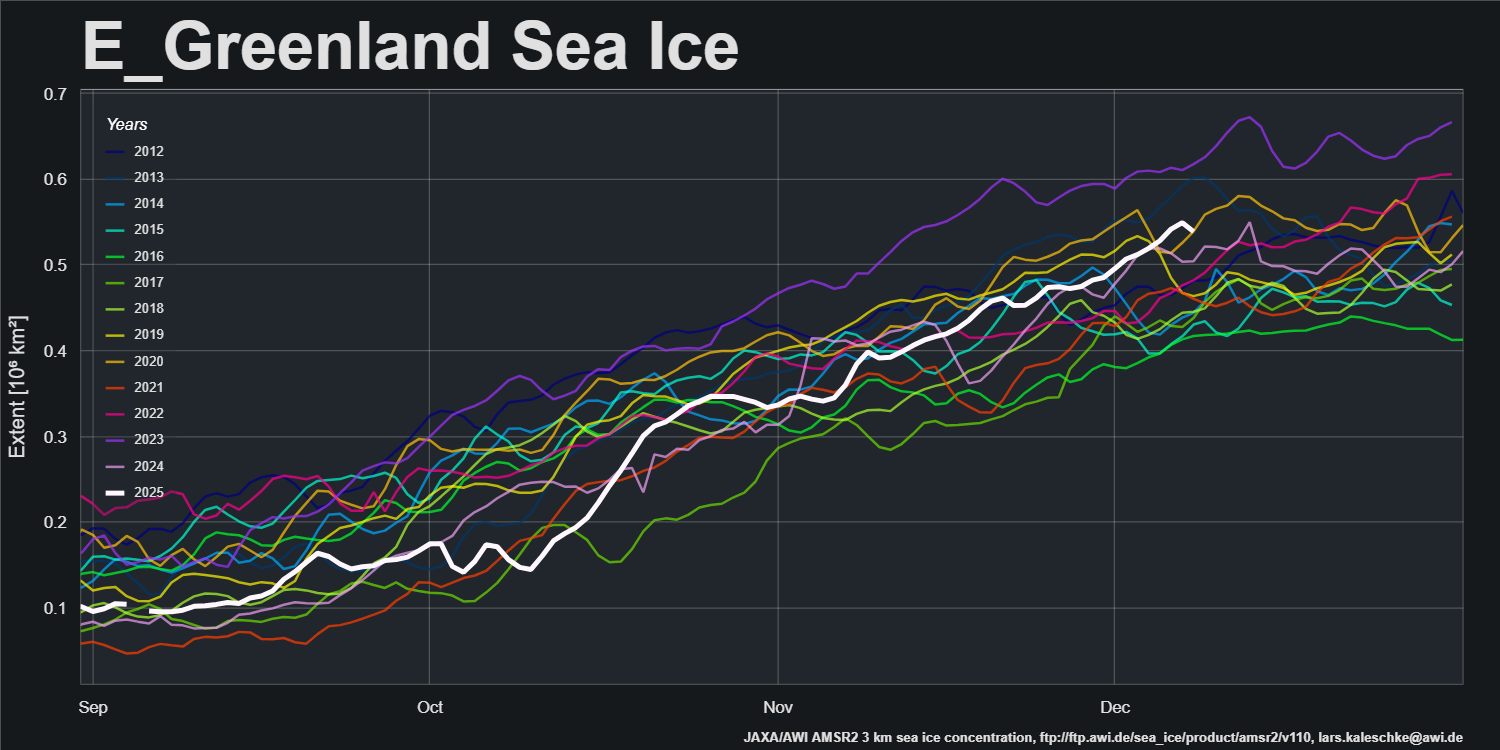
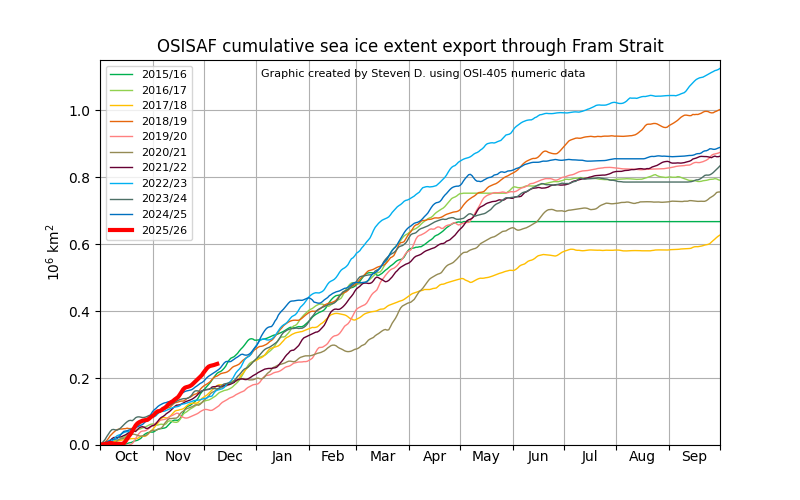
The CAB high, Barents low dipole has produced plenty of export into the East Greenland Sea via the Fram Strait:
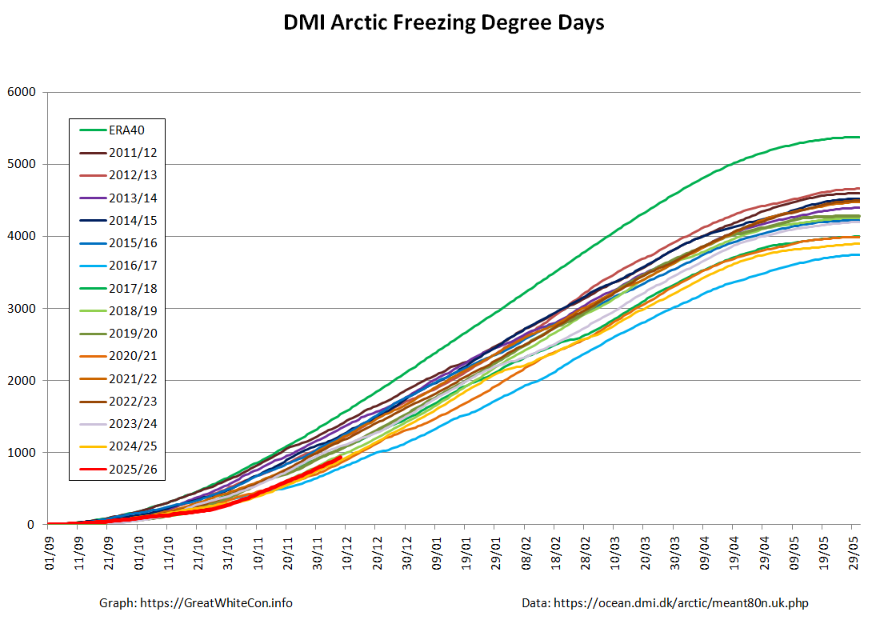
High Arctic freezing degree days based on DMI >80N data is currently 4th lowest for the date:
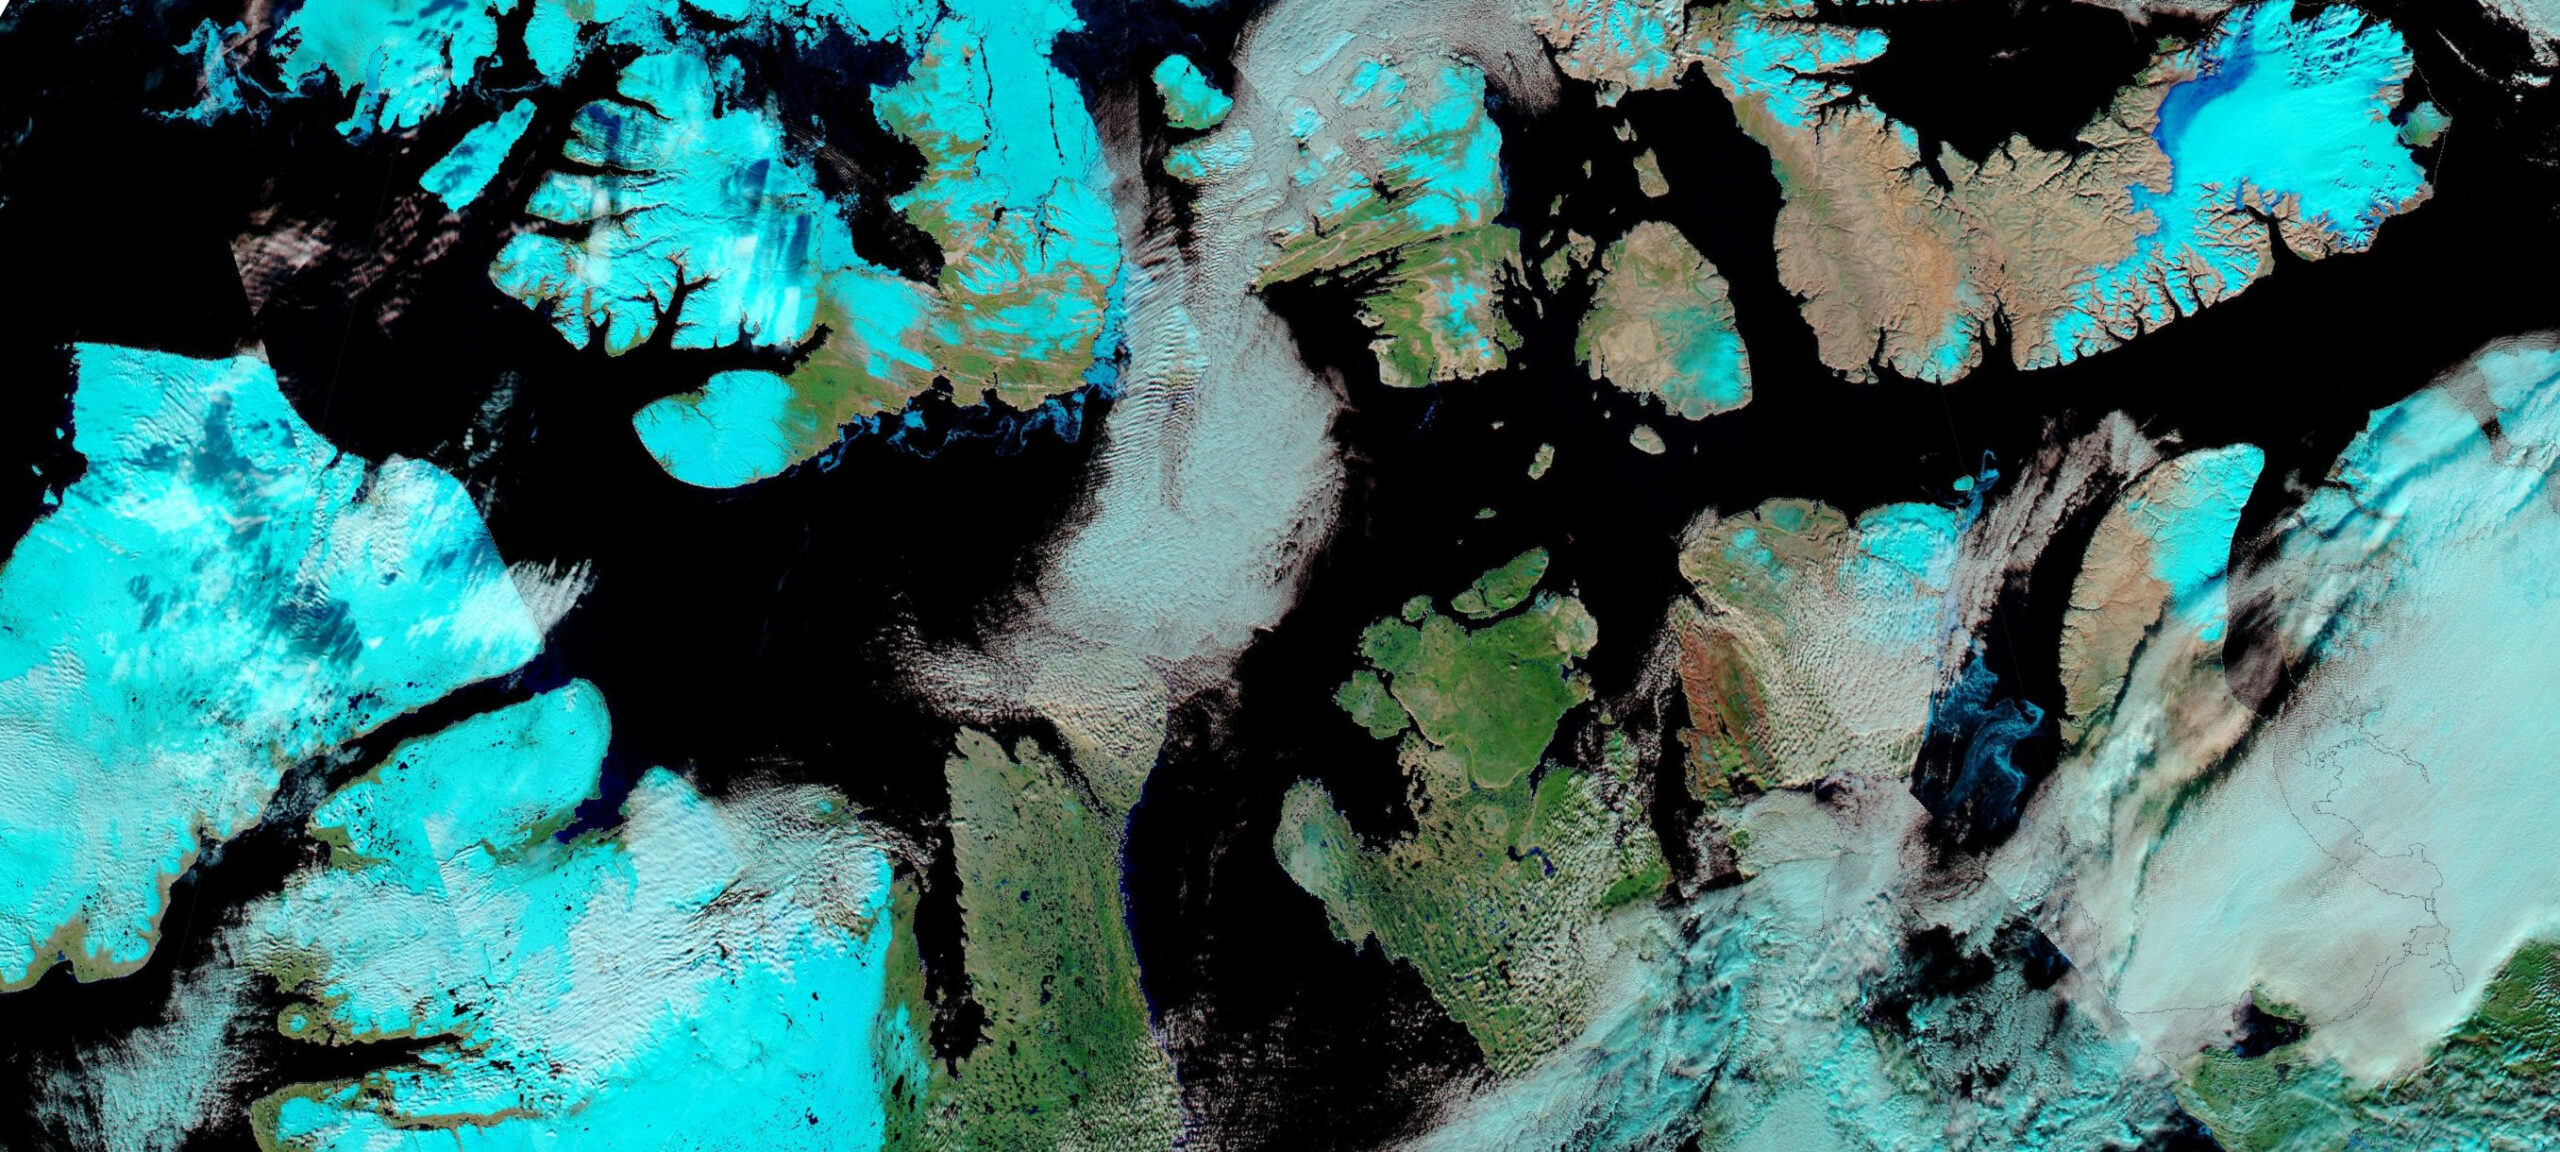
A new paper entitled “Near sea ice-free conditions in the northern route of the Northwest
Passage at the end of the 2024 melt season” has just been published in The Cryosphere. That fact will not come as a surprise to readers of our live coverage of the event:
Needless to say an academic journal article expands upon the matter at considerable length! Here’s an extract from the conclusions:
2024 had the lowest observable ice area recorded since region-wide records began in 1960. This extreme event was driven by the coupling of (i) rapid July–August melt, (ii) reduced ice import from higher latitude regions, and (iii) a 1 month extended melt season, together with (iv) a now common, lower resilience FYI dominated sea ice cover at the start of the melt season. Specifically, strong negative SLP anomalies over the western CAA and Beaufort Sea facilitated the flow of warm southerly air directly into the middle of CAA resulting in a record summer air temperature anomaly of +2.1 °C that drove rapid melt. The same prevailing southerly winds only facilitated the net import of 11 × 10³ km² of ice from higher latitude regions, 50 % less than the 2016–2024 mean. This was followed by an extended melt season where freeze-up was delayed by 1 month as a result of unprecedented +12 °C air temperature anomalies in October.
For comparison purposes, and especially for Peter, here’s a picture of the Royal Canadian Mounted Police Schooner St. Roch in the heart of the Canadian Arctic Archipelago in the summer of 1941:
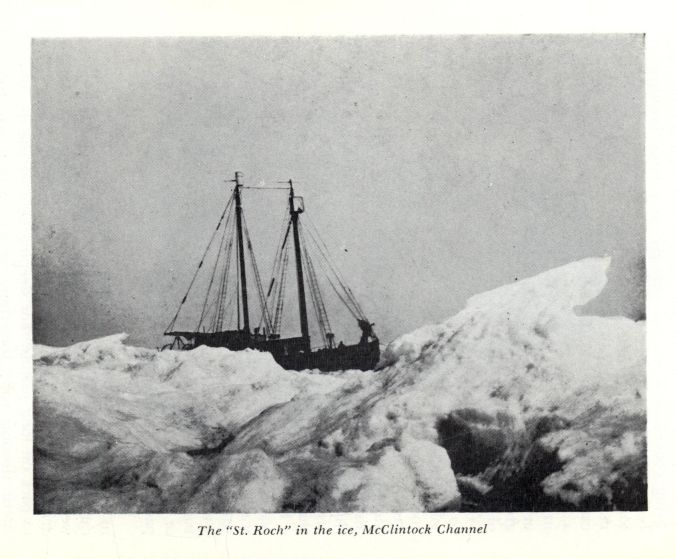
[Update – December 19th]By September 3rd we had worked up to Pasley Bay, vicinity of the Magnetic Pole, and all progress was stopped by ice. We got caught there and drifted back and forth with the ice until September 11th, when we got jammed in close to the beach, and all ice in the bay became stationary until August 4th, 1942.
At long last Hudson Bay has started to rapidly freeze over:
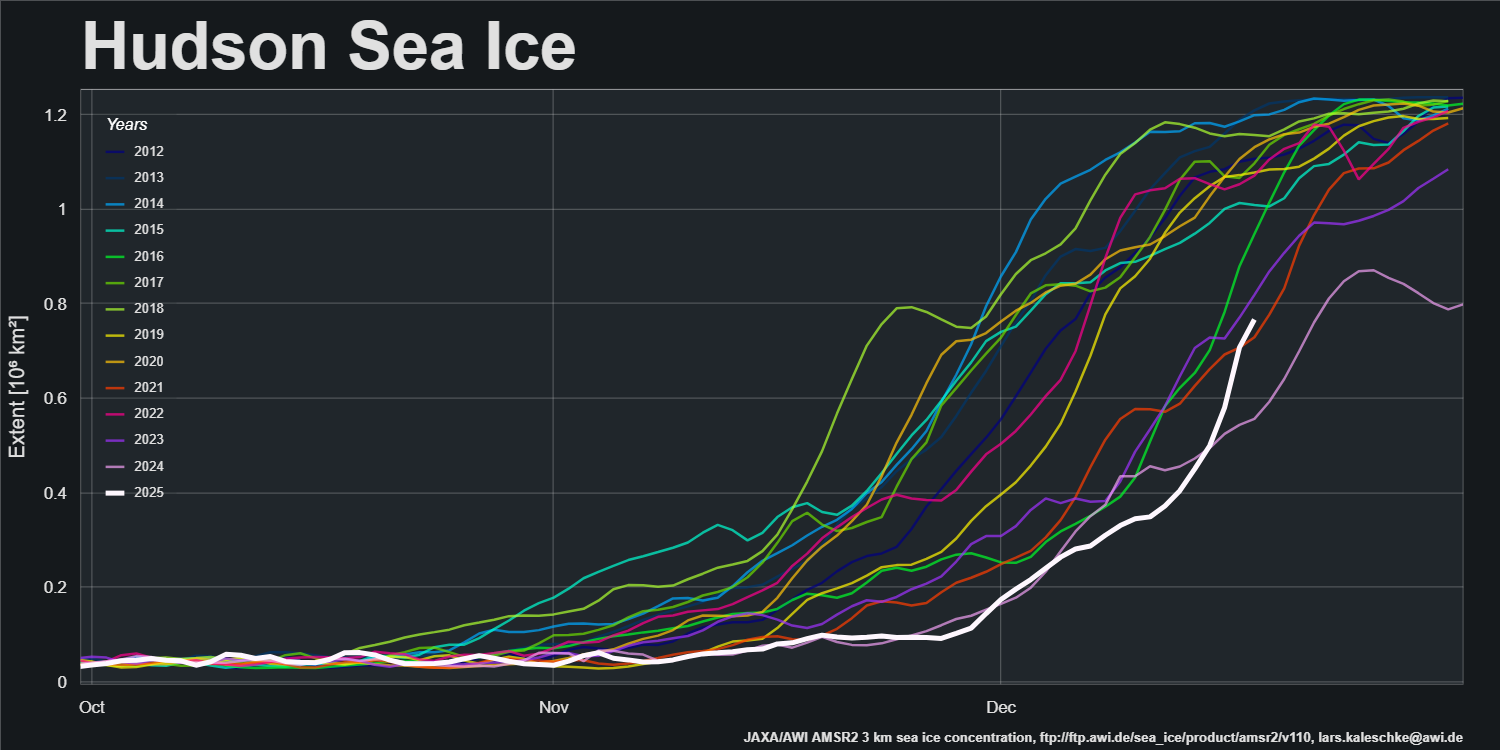
Partly as a consequence, JAXA sea ice extent has now crossed above 2024 to become second lowest for the date:
Here too is the AWI’s mid month CryoSat-2/Sentinel 3/SMOS Arctic sea ice thickness map:
together with the associated volume graph:
In other news the 2025 edition of NOAA’s Arctic Report Card has just been published:
Here are the headlines from the sea ice section:
- The lowest annual Arctic maximum extent in the 47-year satellite record occurred in March 2025, followed by the 10th lowest minimum extent in September 2025.
- In the first Arctic Report Card, 2005 was reported as the record lowest minimum extent, but that 2005 extent now ranks 20th lowest in the 47-year record.
- The last 20 years have been characterized by lower extent and a younger and thinner ice cover than in previous decades.
- Changing sea ice extent and thickness is allowing increased marine traffic and prompting reevaluations of national security concerns.
The conversation continues over on the January 2026 open thread.
Here’s Grok’s “analysis” of “Snow White’s” accompanying Xweet:
Not holding my breath waiting for wall-to-wall reporting on the first major Arctic sea ice record low in 96 months, but for many of us in the scene, present company excluded of course, this will be the first time annual Arctic sea ice was lowest since we started following ice on a daily/weekly basis!
According to my calculations the 365 day rolling average at the end of November 2025 was 12,860 km³, compared to 12,567 km³ at the end of August 2017.
A more difficult bar to beat?
Jim, you’re right about ‘absolute low points’ in 2017, but my calcs are about the calendar year total, which is graphed at the UW Piomas site:
Arctic sea ice volume prior to 2003 was just guesswork from extent, logs from ships and submarines and the like. From 2003-2010 it was better with some satellite measure of height.
It was only in 2010 that accurate full satellite measurement of volume began and since then there has been no statistically significent trend.
September Arctic sea ice extent for 2025 publishing on NASAs Arctic page was delayed because of the government shutdown but despite the resuming of government services , the 2025 value still has not appeared on the NASA graph. Could it be that the September 2025 September value was 500,000 km2 higher than the
September 2024 value.
Since 2007 there has been no statistically significant trend of Arctic ice extent, with 2025 it is microscopic.
But here we have you doomsters desperately trying to create a crisis where there is none. Why do you desperately hope that the Arctic is doomed?
Cheers
Hello again Peter,
You appear to have neglected to bother reading the October open thread, wherein you would find the data that you seek together with this graph:
You also appear to have forgotten this comment of yours from 2022?
You’d probably also prefer not to bother reading the recent comments concerning “climate and national security” of that well known “doomster” Lieutenant General (Ret’d) Richard Nugee CB CVO CBE?
https://GreatWhiteCon.info/2025/12/the-uks-national-emergency-briefing-on-the-climate-and-nature-crisis/#Security
“2025 value still has not appeared on the NASA graph. Could it be that the September 2025 September value was 500,000 km2 higher than the September 2024 value.”
Jim, do you think he is intentionally being vague about “the NASA graph” for his doubt-creation attempt to live just a few hours more? In other words, do you think they are now that desperate?
I dunno. Where’s the “NASA graph” that shows sea ice, Peter?
Hi Jim,
Hope all is well with you and your family as we approach Christmas.
You are correct that I believe ALL the data should be used, not just September, however the September Arctic minimum has been the focus of climate cult propaganda for years but now it’s moving off message and as such must be ignored.
The 2025 September average was about 500,000km2 bigger than 2024 but on the NASA website it still has not added 2025 to its graph of death Arctic September minimums.
If you plot September averages since 2007, there’s virtually no trend. Why you included a graph of Sep-Oct in your reply without 2025 is a bit puzzling.
Do you acknowledge that the university of Washington, Ploar Science Centre was right when it said in a recent paper that there was a regime change in 2007 and since then there has been no statistically significant trend. The university of Exeter went even further saying there was no trend since 2005!
I wrote “Arctic sea ice volume prior to 2003 was just guesswork from extent, logs from ships and submarines and the like. From 2003-2010 it was better with some satellite measure of height. It was only in 2010 that accurate full satellite measurement of volume began and since then there has been no statistically significant trend.” but you never commented on this fact.
There used to be a graph of multi year ice on the NASA website but that has now been removed. It showed that multiyear ice has remained about the same since 2010. Luckily I took a screenshot of it and here it is.
There is an abundance of evidence that Arctic ice extent was extremely low in the 1930’s as the warmed from 1910 to 1940 and then the planet cooled until about 1975.
So if satellites had existed in 1930 then the long term record would show 2025 extent about the same as extent in the 1930’s.
The Smithsonian institute archaeological dig in Greenland showed that Vikings farmed areas of Greenland 1000 years ago that are permafrost today. Greenland ice cores confirm also confirm it was extremely hot back then and by extension Arctic ice extent must have been significantly less for 200 years or more. So with all database series, start dates can dramatically change things.
Jim, these are not my opinions, they are facts. all the best.
Cheers,
Peter
Here are some of your “opinions” Peter:
“If satellites had existed in 1930 then the long term record would show 2025 extent about the same as extent in the 1930’s.”
“Greenland ice cores confirm also confirm it was extremely hot back then and by extension Arctic ice extent must have been significantly less for 200 years or more.”
Where is the evidence for those assertions hiding?
Regarding “regime change” I refer you yet again to:
https://GreatWhiteCon.info/2023/09/facts-about-the-arctic-in-september-2023/#comment-703068
Regarding sea ice age I refer you to:
https://GreatWhiteCon.info/tag/age/
and in particular to:
https://nsidc.org/sea-ice-today/analyses/arctic-sea-ice-walking-sunshine
Hey Peter!
You claimed: “You are correct that I believe ALL the data should be used, not just September, however the September Arctic minimum has been the focus of climate cult propaganda for years but now it’s moving off message and as such must be ignored.”
In my latest piece I concede: “PIOMAS or UW edu themselves also track the lowest years in Climate Change, and will likely update their graph over the first 12 months of 2026. In fact, yours truly himself may actually have been instrumental in making them start publishing that graph, back when we hit an All-Time Low in 2017, or 8 years ago. I found it more significant to track the full-year average ice, in the same way that everything else is tracked in climate, from glacier loss to global air and sea temperatures.
Over the decades my scientific argument won popularity. Prior to that, Mid-September ice levels were more or less the only ones being reported. Now even Zachary Labe has started tracking the annual, see the top illustration.”
Source: https://extinctionati.substack.com/p/arctic-ice-new-record-low-in-2025
More likely it was “Snow White” herself, channelling Tamino in these hallowed halls back in 2016?
https://GreatWhiteCon.info/2016/09/the-2016-arctic-sea-ice-metric-minima/
Jim,
well, the more the merrier, really. And who knows, maybe the combined effect by the pair of us was what finally made the penny drop? In any case I’d suffered heavy and near-fatal bombardment for a couple years before the quoted support from your friend Snow White for my ‘theory’ that ALL the data ought to be applied.
We’ve had computers for almost a century, so it’s not like it’s hard work compiling an annual average, my argument went, so why settle for one day in September. Relatively speaking, we’re shedding more ice during winter in the Arctic, so zooming in on September would lose a significant signal of severe ice loss.
Ah the acolyte who wants to go south!
Here is the data and the current NASA September extent which you will see has yet to update the 2015 September value.
The 2025 value is about 400,000 km2 higher than the 2024 value but that is off message and so NASA simply ignores it.
Are you by any chance familiar with the Trumpian cuts to the US science budget?
NASA – https://www.jpl.nasa.gov/news/jpl-workforce–update/
NSIDC – https://nsidc.org/data/user-resources/data-announcements/user-notice-sea-ice-today-services-reduced
Here is the NASA
https://science.nasa.gov/earth/explore/earth-indicators/arctic-sea-ice-minimum-extent/
Thanks for the link, Peter!
Btw, that’s not “the NASA graph” but the NSIDC extent graph.
Same as, if Rolling Stone decides to put the NSIDC graph in an article on sea ice collapse, it doesn’t magically become “the Rolling Stone graph”.
Or Playboy, for that matter.
You wrote “You’d probably also prefer not to bother reading the recent comments concerning “climate and national security” of that well known “doomster” Lieutenant General (Ret’d) Richard Nugee CB CVO CBE?”
Gee, Lieutenant General CB CVO CBE, this man is a force to be reckoned with. He said “The Arctic is becoming a new flash point due to the climate crisis directly. You’ve heard how sea ice is receding…”. Wow! A flash point!
Only trouble is he is either totally ignorant or lying. Arctic extent has not changed significantly since 2007 and volume from 2010. These are undisputable facts.
The longest running polar ice extent time series is produced by the University of Bremen starting from 1972. It clearly shows there is no crisis.
[Some gratuitous abuse redacted – Mod]
More “opinions” Peter, and you’ve still offered no evidence for the previously identified ones.
“I believe ALL the data should be used”.
Why don’t you show annually averaged Bremen data then?
I asked Co-Pilot a question and took a screenshot. see attached file.
It says that Sea ice extent increased from the 1940’s to the 1970’s so when satellite scanning began in 1979, Arctic ice extent was the highest it had been since the 1940’s.
There never was an Arctic sea ice extent crisis, it is just an artifact of the start date.
Cheers chaps
Hi Peter,
Your redacted replies still just regurgitate long debunked “skeptical” talking points. Try providing some scientific evidence for your confidently asserted “opinions” or remain in Snow White’s spam bucket.
For the dangers of relying on artificial “intelligence” please see this recent article:
https://GreatWhiteCon.info/2025/11/grok-confirms-michael-shellenberger-talks-abject-nonsense/
For your information I just asked ChatGPT:
Here is an extract from his/her/its reply
Jim,
you may want to admit Peter for a CCDS* checkup over the holidays.
*) Climate Change Derangement Syndrome
[Repetition redacted – Mod]
There is no Arctic ice crisis. Arctic ice follows the AMO in recent times and there is no doubt it is due to switch to its cool phase within the next few years and the ice will start increasing again.
That’s what climate does, it cycles. lol!
[Repetition redacted – Mod]
“LOL” is the only evidence you have for yet another confident assertion?
It may interest you to learn that Prof. Michael E. Mann claimed to have coined the term “Atlantic Multidecadal Oscillation”, but now claims that no such thing actually exists:
LOL?
Arctic sea ice extent has been at a satellite era record low for 97 days so far this year according to Gerontocrat in the Arctic Sea Ice Forum.
Any sign of a recovery?
Not yet!
Not in the Arctic, there isn’t. Also note that volume is currently confirming the #1 lowest position for sea ice.
On the other hand, or pole, we now see a fanning out of thin sea ice, ahead of its January/February minimum. I’m still learning, but what often happens when sea ice extent leaves the Top 5 lowest position, is that volume does *not* confirm this, and the ice actually melts out faster, due to getting a larger surface (by fanning out) that winds, waves, ocean heat & sun rays can work on.
Thus, we’re now at #11 lowest (per Jaxa), but as I said, that may be a good sign wrt to a potential meltout or a new record low minimum.
[Repetition redacted – Mod]
4. Reconstructions of Arctic ice from 1900 by
Connolly et al, Brennan et al, Alekseev et al, Semenov et al all show that…
1900-1940 – Ice extent reduced by 1 million km2
1940-1970’s – Ice extent increased to about 2.5 million km2
1979-2007 – Ice extent reduced by about 3.5 million km2
2007-2025 – No significant trend.
[Repetition redacted – Mod]
Have you seen the reconstruction by Walsh et al. (2016)?
Here’s a helpful comparison from Brennan et al. (2020):
You also appear not have seen the picture of St. Roch in the Northwest Passage in 1941 yet? Take a look above. What do you make of it?
1. Your reconstruction ends in 2012, the year of lowest Arctic ice extent.
2. The black line is pretty much the same as Alekseev, Connelly, Brennan and semenov!
3. The Outlier is Walsh which claims there was virtually no 1940-1970s Arctic ice extent reduction and of course it is the one favoured by the IPCC and climate doomsters.
4. The planet cooled by from 1940 until the 1970s and at the time it was measured as about 0.5C. Unfortunately this was off message and the climategate emails showed that this needed to be reduced and over the next 50 years it was reduced to about 0.2C by successive revisions of temperature databases.
But it was 0.5C and Arctic ice extent increased significently right up to the 1970s. Most Glaciers also advanced during this period as well.
But Mr Walsh and co ignored all this and , just like Mann and his hockey stick, gave the IPCC what they wanted.
In true science, the theory must conform to the data and consensus is is irrelevent.In climate science the data must conform to the theory and consensus is demanded.
There is no climate crisis, our planet is just bouncing out of the coldest period in the last 8000 years, the little ice age. But climate cultists regard the LIA as a “pre-industrial” norm that must be returned to.
Einstein once said that only two things are infinite, the universe and human stupidity.
Cheers!
Here’s a reconstruction from Brennan and Hakim (2022):
Do you notice anything?
Have you noticed the St. Roch yet?
When Arctic is high, a lot of thicker ice tends to accumulate in the Beaufort, East Siberian Sea, the Pacific side in general is more protected from the inflow of Atlantic water and from export through the Fram straight. A lot of thick ice in the North West passage would seem to imply mose ice in the Western arctic.
I wonder are there many records of the state of the ice in Alaska in the 1940s?
Amongst other things there is this:
Seems nothing as low as in recent years, as best as we can tell.
[Repetition redacted – Mod]
[Repetition redacted – Mod]
(Using CryoSat daily volume deltas to estimate current month Piomas)
[Repetition redacted – Mod]
Just FYI: Zach Labe who is the only person on planet sharing sea ice volume info from Antarctica, just dropped 3 months of data: September, October & November.
Back to the Arctic!
Hey, look what sea ice volume is doing in the Central Arctic Basin aka CAB according to CryoSat, here per Polar Python’s excellent ice service:
Thanks to the retreating Atlantic front CAB extent is reducing, and is currently lowest for the date in the AMSR2 record:
Barents Sea extent is also lowest for the date:
East Greenland Sea extent is not far off:
Here’s the 2025 edition of Andy Lee Robinson’s animation of Arctic sea ice volume loss:
Merry Christmas from Greenland!
Merry Christmas to one and all from Santa at the North Pole:
and “Snow White” in what was once the Litzmannstadt Ghetto:
(Using CryoSat daily volume deltas to estimate current month Piomas. Note that the annual average now rounds to 12.7k. Previous record year rounds to 12.9)
https://twitter.com/icegoingsouth/status/2005258076576960626