I’ve been away on a “road trip” during the first part of June, so this month’s initial update is a trifle tardy.
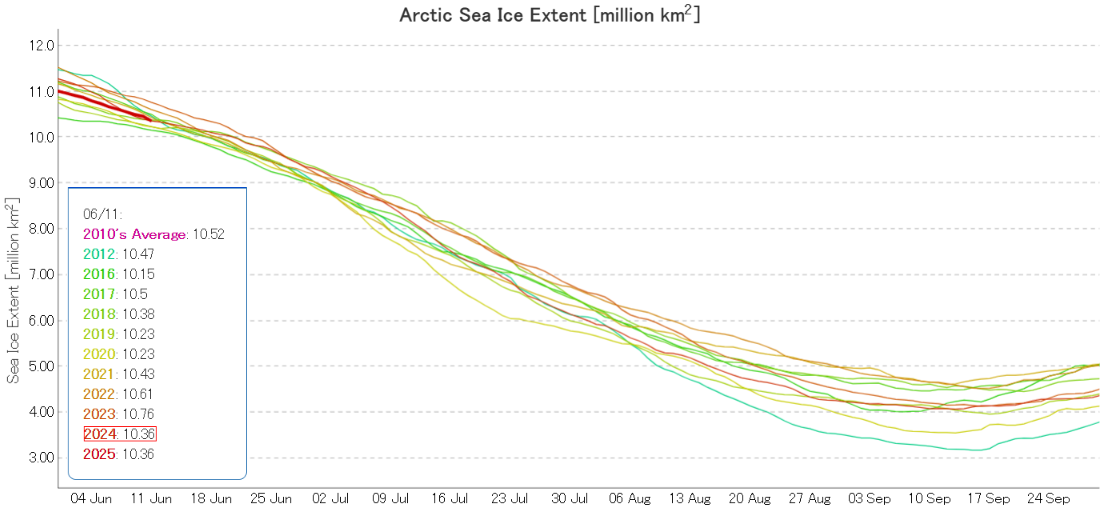
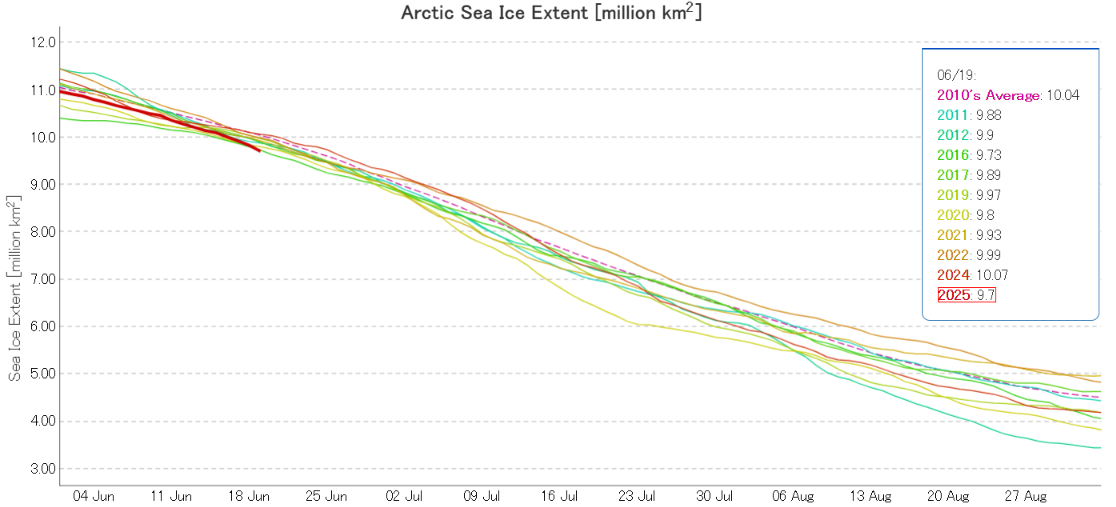
After a 100k “break” yesterday JAXA/ViSHOP extent is currently in a tie with 2024 for 4th lowest for the date, and still slightly below 2012.
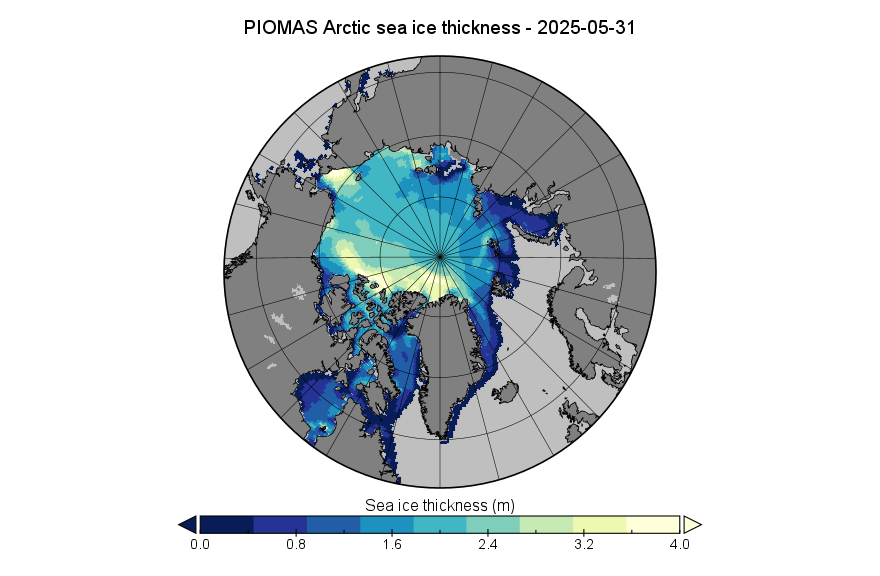
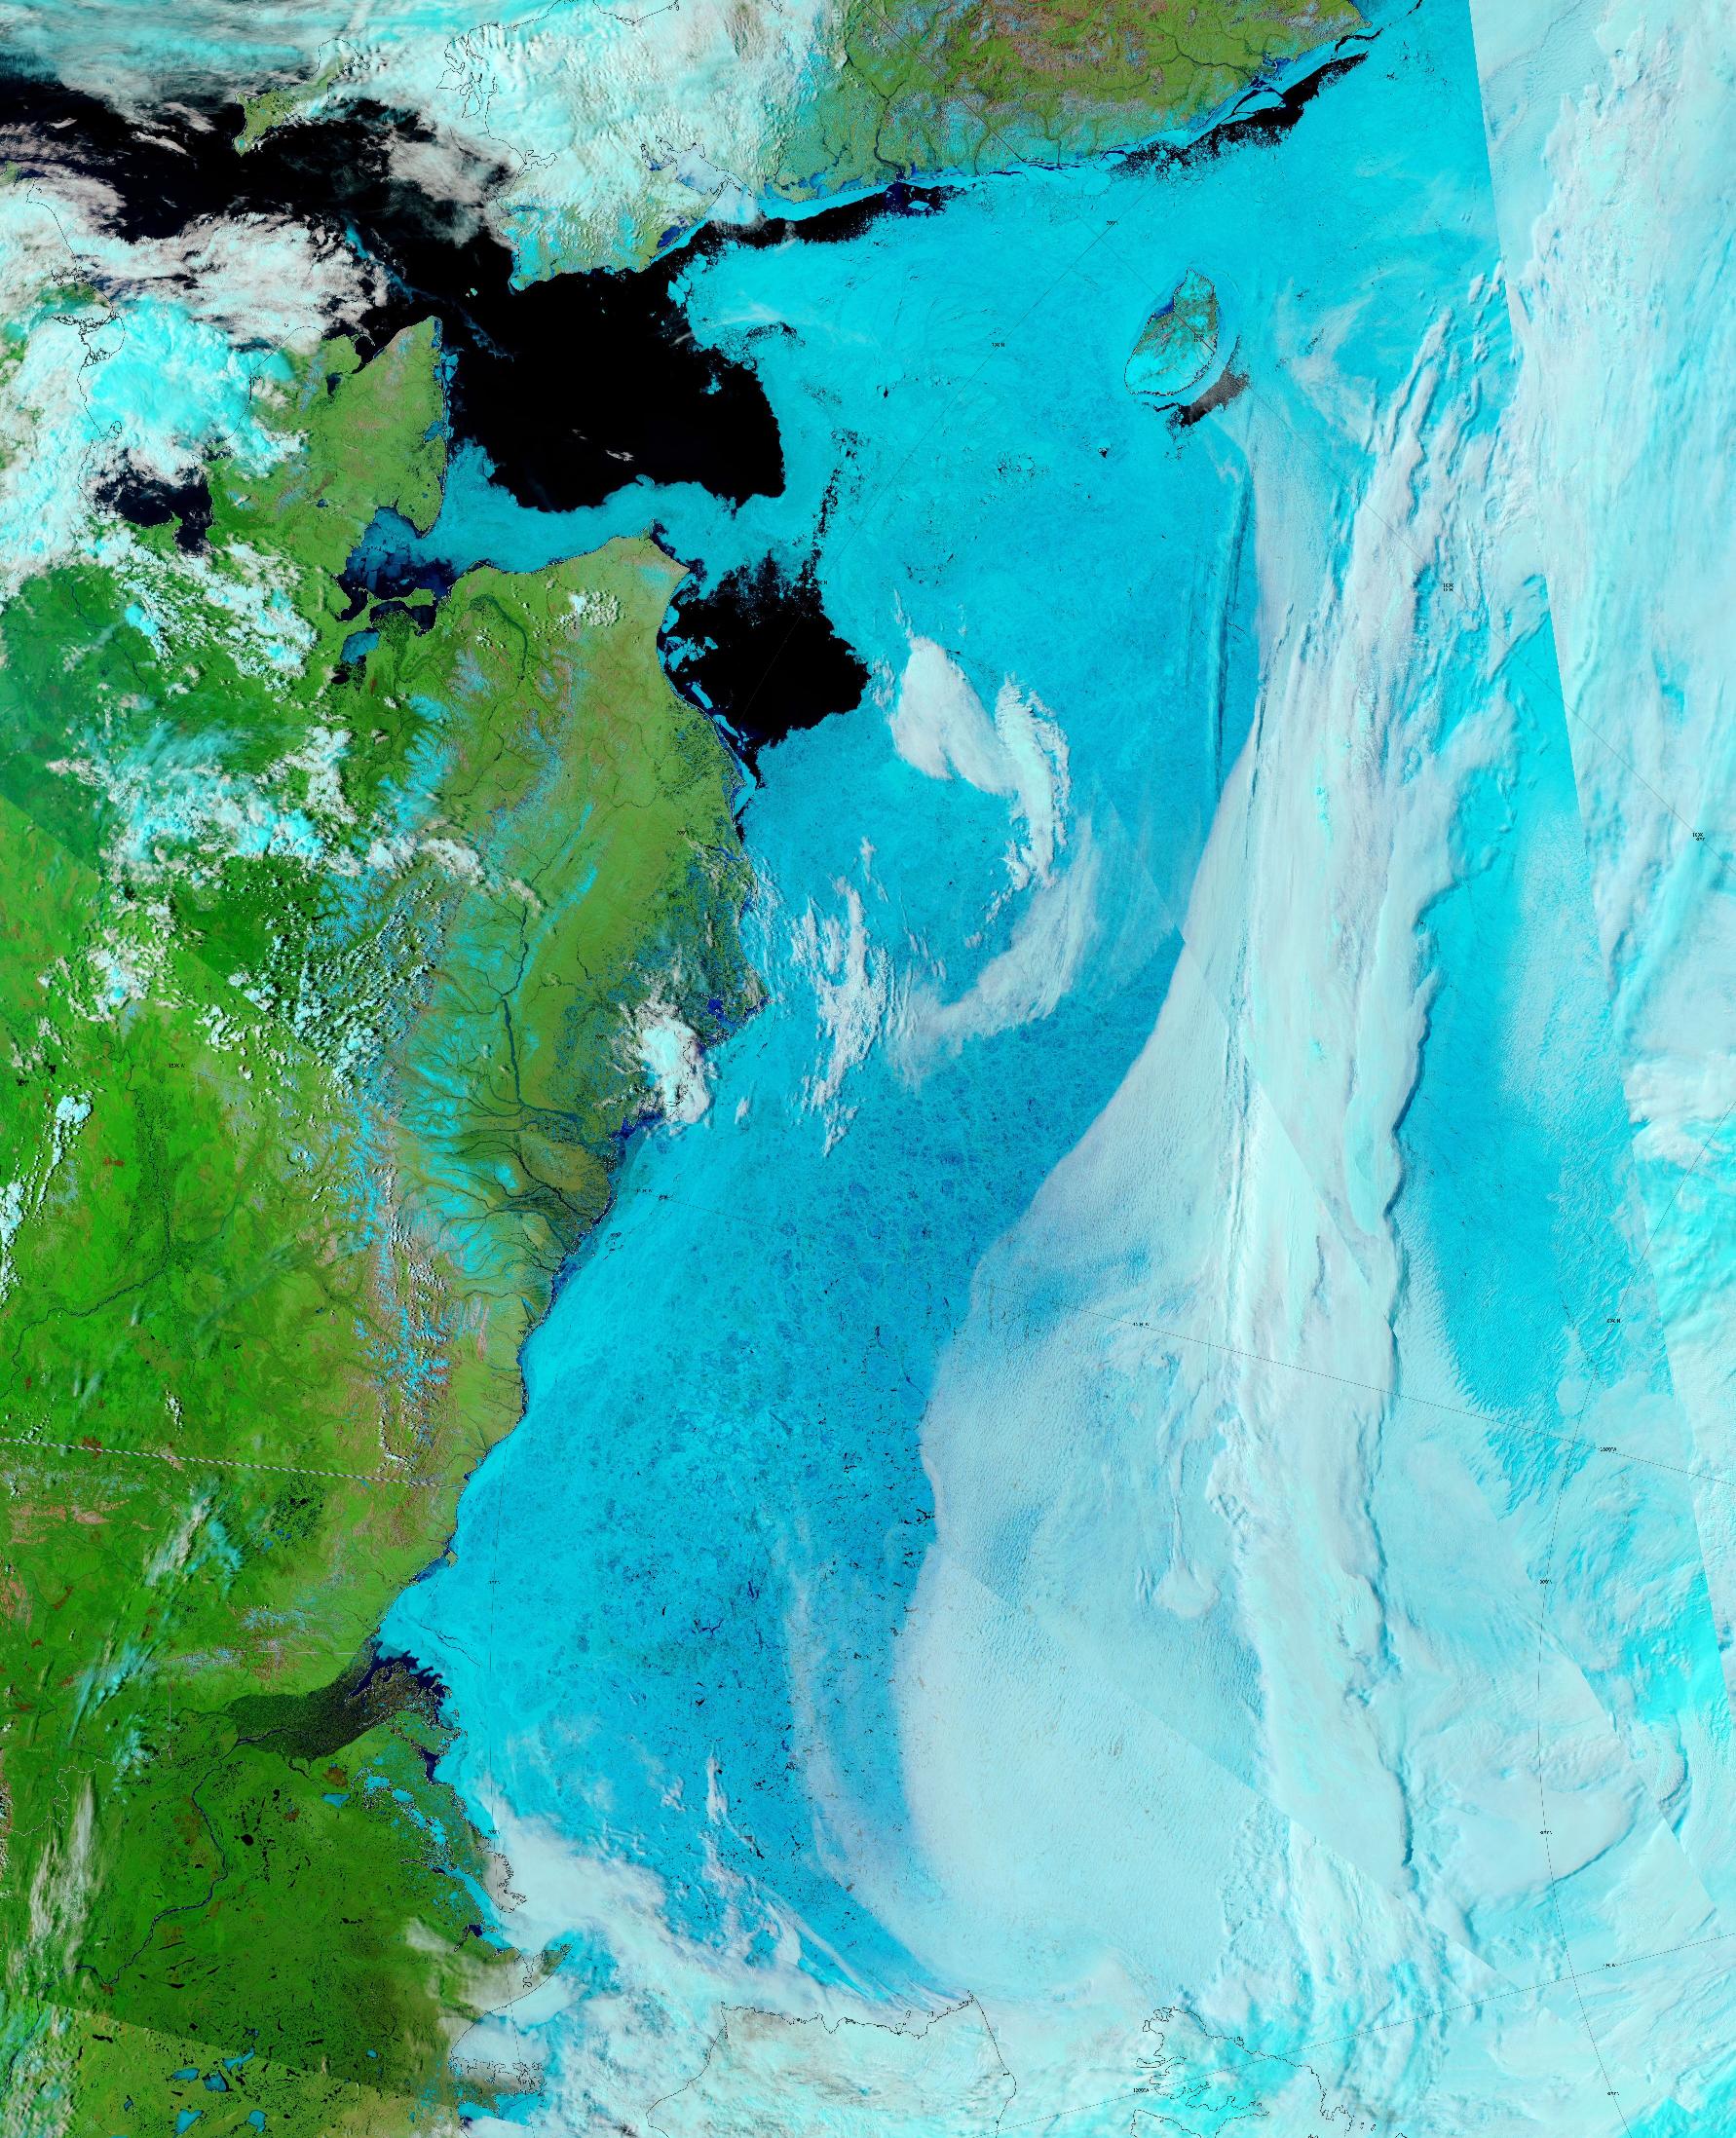
The PIOMAS sea ice thickness map for May 31st continues to show plenty of thick ice in the Beaufort and Chukchi Seas:
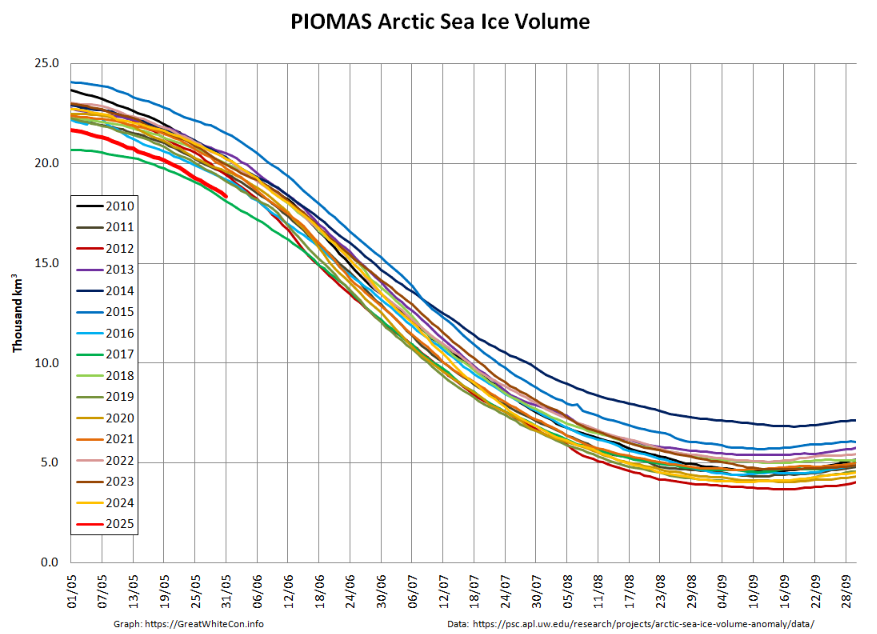
However, the associated volume graph shows the 2025 curve only slightly above the previous low for the date in 2017:
I have recently received a disturbing email from the NSIDC, which reads as follows:
Recent delivery from the US Navy of the SSMIS passive microwave data that the CDR sea ice product uses has become more sporadic. The Defense Department has informed NSIDC that they will reduce the priority of processing SSMIS data, resulting in likely daily data gaps.
Due to aging SSMIS sensors, NSIDC has already begun exploring alternative sensors, which led to incorporating the JAXA Advanced Microwave Scanning Radiometer 2 (AMSR2) prototype sea ice concentration in our latest version. Users may wish to begin utilizing those AMSR2 data as the SSMIS portion continues to degrade. As documented in NSIDC Special Report #27, the SSMIS-using CDR and its AMSR2 corollary are not yet fully intercalibrated. Users will see differences between the products, as AMSR2’s higher resolution provides better ice edge detection than SSMIS. We are developing a new version that will intercalibrate these sensors, though this will take time. We apologize for any inconvenience and appreciate your patience during this transition.
I clicked the link to read the special report, only to discover that the entire NSIDC web site is out of action this evening. Hopefully it will be back in action soon.
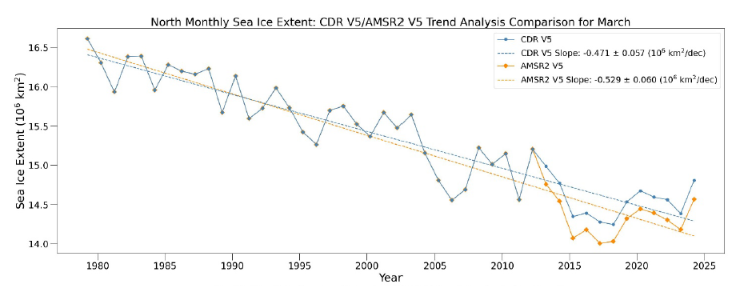
[Update – June 13th]I tried clicking the NSIDC’s link to Special Report 27 again today, and thankfully it is now working! It contains much more information than this, but here are the NSIDC’s comparisons between SSMIS and AMSR2 data for the months of March and September:

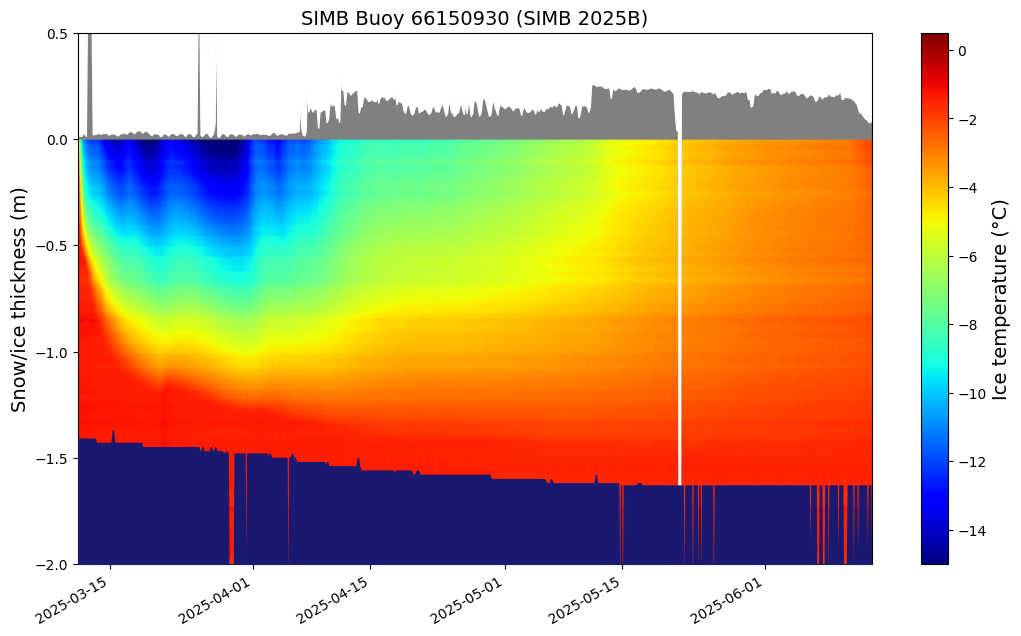
In other news, snow melt is well underway around SIMB3 buoy 2025B, currently located at 165.2 W, 74.0 N in the Chukchi Sea:
Much more surprising news is that bottom melt appears to have started on the ice floe supporting SIMB3 buoy 2024V
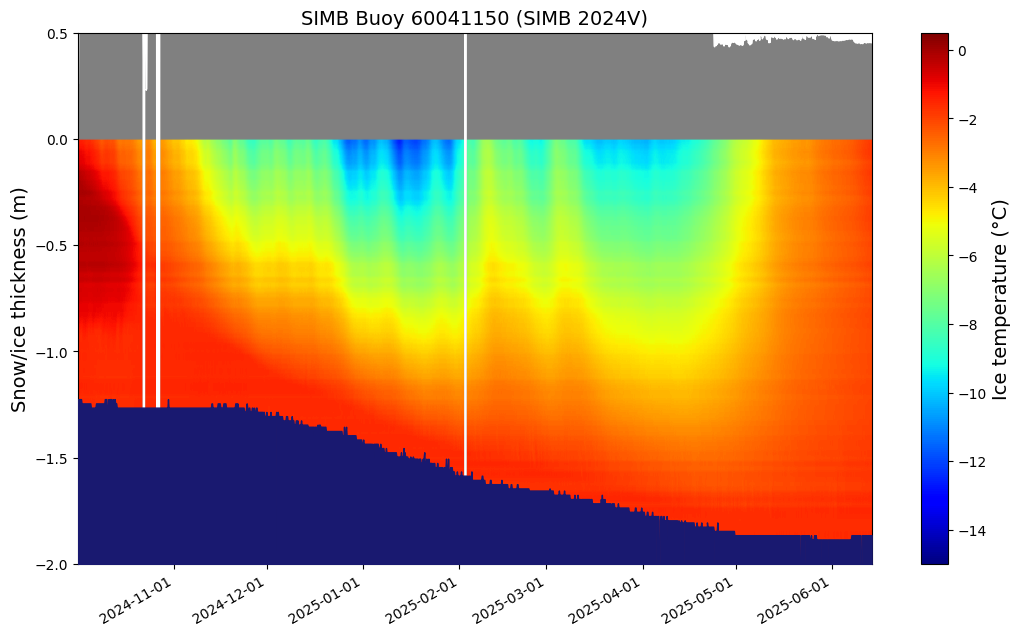
This buoy is located in the Central Arctic at 113.5 W, 85.4 N!
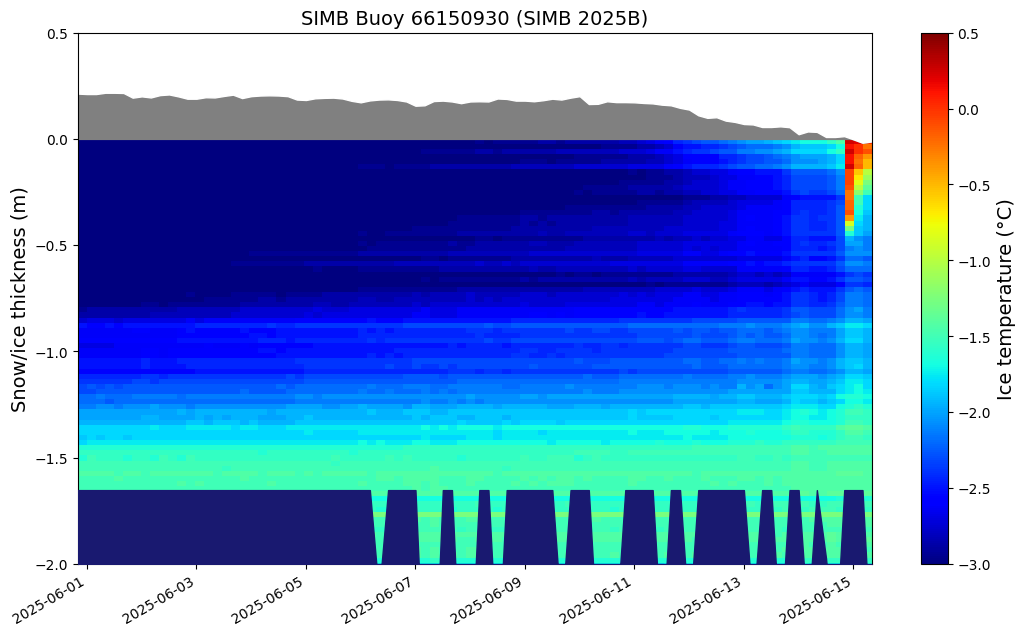
[Update – June 15th]Surface melt has started at 165.0 W, 74.1 N. It looks as though sun warmed water has been trickling down the borehole housing buoy 2025B:
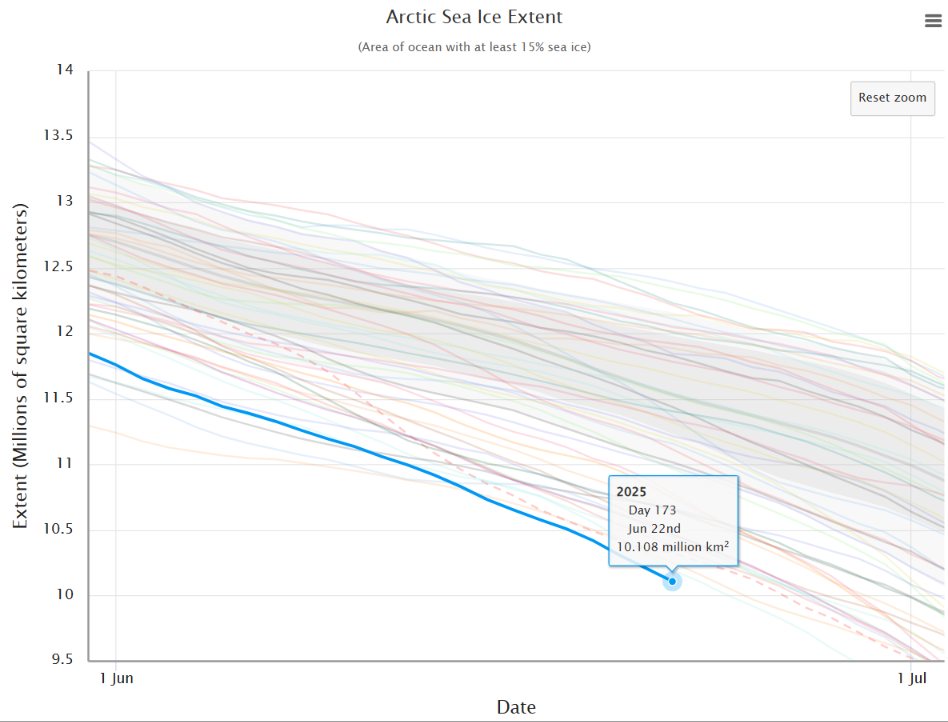
JAXA/ViSHOP Arctic sea ice extent is now “lowest for the date” in their record going back to 1979:
In news from the Northern Sea Route, the Russian nuclear powered icebreaker Yamal is now cutting a path through the Vilkitsky Strait towards the Laptev Sea:
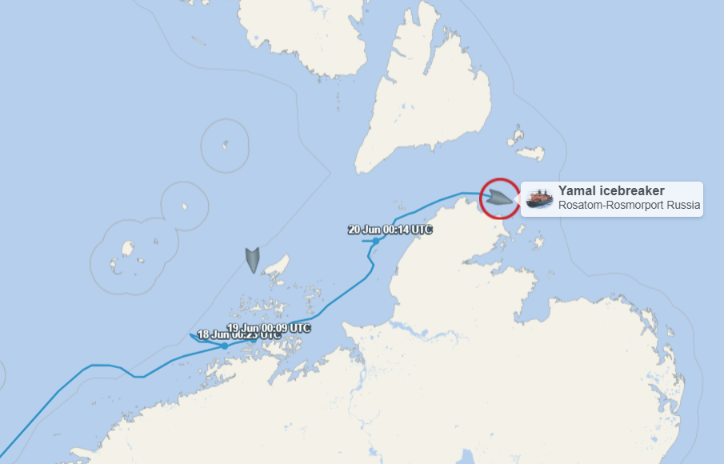
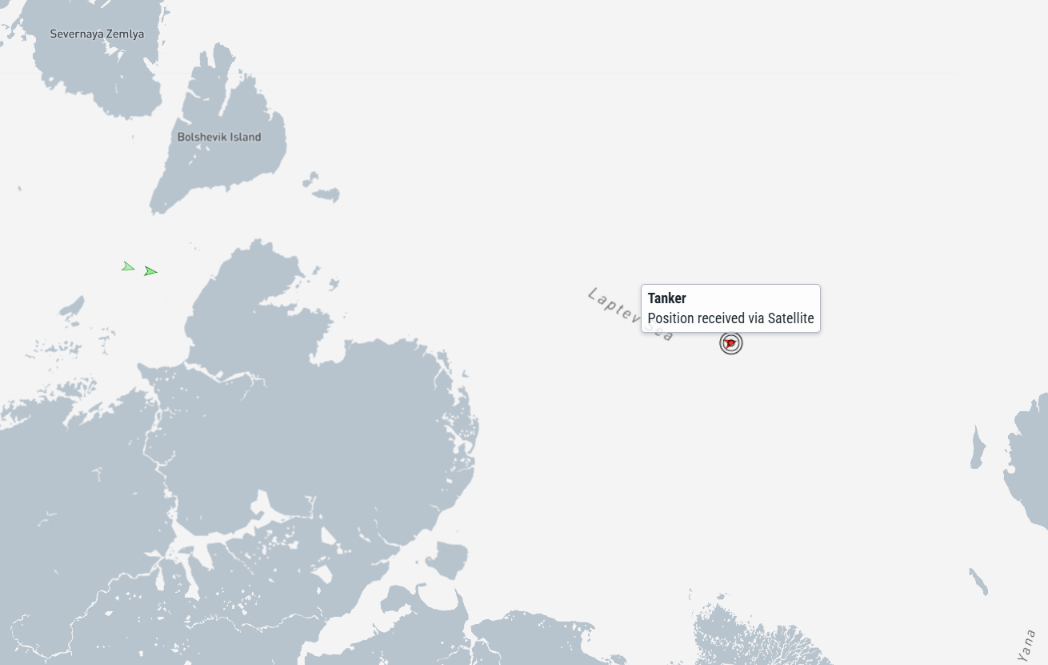
Yamal is leading the Arctic class 7 liquified natural gas tanker Georgiy Ushakov towards the Far East via Cape Dezhnev:
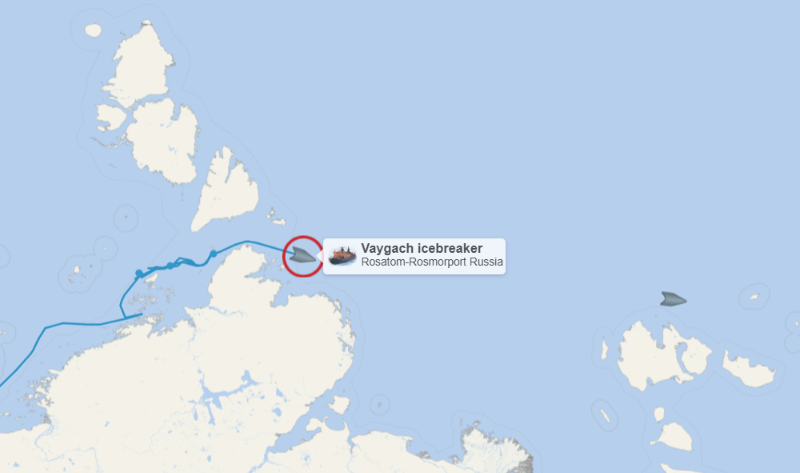
Meanwhile another nuclear powered icebreaker, Vaygach, is leading two cargo ships through the Vilkitsky Strait, en route to Pevek:
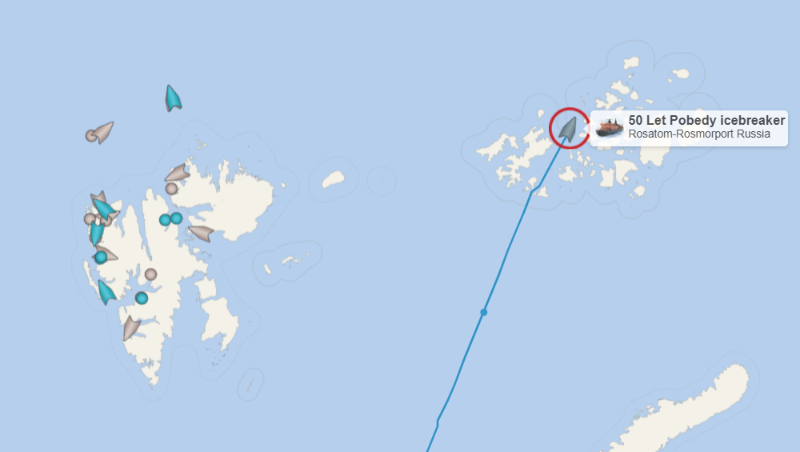
Yet another Russian nuclear icebreaker, 50 Let Pobedy, is heading for the North Pole, while several cruise ships are exploring the icy waters north of Svalbard:
Especially for the reader(s) of the “Watts Up With That” web site, the NSIDC’s Charctic Arctic sea ice extent metric is also currently lowest for the date (since 1979!):
The sadly inevitable has come to pass:
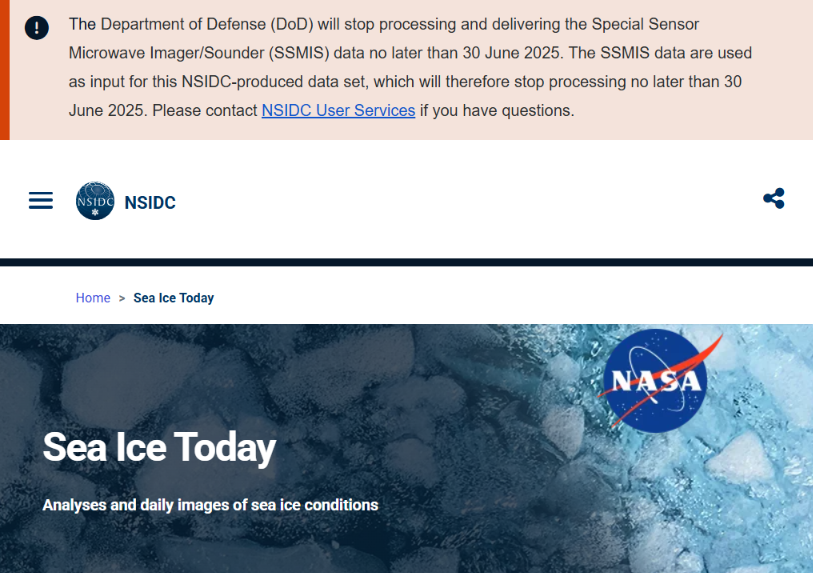
The Department of Defense (DoD) will stop processing and delivering the Special Sensor Microwave Imager/Sounder (SSMIS) data no later than 30 June 2025. The SSMIS data are used as input for this NSIDC-produced data set, which will therefore stop processing no later than 30 June 2025.
It’s not yet clear whether some of the traditional NSIDC services will be continuing using AMSR2 data instead of SSMIS.
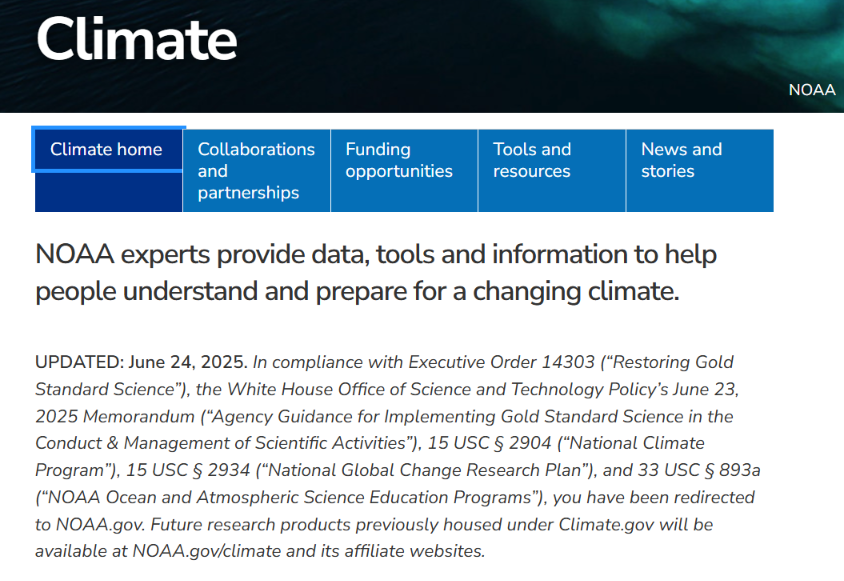
Whilst the NSIDC web site remains, Climate.gov is no more:
The conversation continues over on the July open thread.
Piomas low for the time of year, and now we’re getting warmer weather on the “side” of the Arctic where the ice is actually thicker than normal.
Where will we be come September!
“Where will we be come September?”
As always, it depends on the weather over the next few months!
Before I forget to mention it, here’s a new academic paper, hot off the virtual presses at Geophysical Research Letters:
“A Rapid Deterioration of the Transmissive Atmospheric Radiative Regime in the Western Arctic”
It’s more relevant to winter weather rather than summer, but the abstract reads as follows:
One cannot help but wonder about the overall effects of changing cloud cover during the brief Arctic summer?
Thank you for your Blue Colour link, my bookmarks were always a terrible mess!
I wonder if you’ve been following the PIOMAS mid-month updates, and is there a system to their unreliability? E.g. do they usually issue them in key, exciting summer months, or is it absolute random and dependent on the mood of the researchers?
The PIOMAS mid month updates haven’t been issued for quite some time.
I’m guessing Dr. Jhang is busy on other things, after doing the extra updates as a favour for the ASIF over a considerable period of time.
I wonder if we’ll get a Piomas update in early July. With the warm weather over the thicker ice on the Pacific side and low extent, things were just starting to get interesting!
You saw the notes from OSI SAF and NSIDC re the sudden cessation of SSMIS data?
I fear there may be no PIOMAS updates for quite a while, but the end of June one will hopefully still arrive at the usual sort of time?
“The Pan-Arctic Ice Ocean Modeling and Assimilation System (PIOMAS) derives its sea ice concentration data primarily from the National Snow and Ice Data Center (NSIDC) near-real-time product, specifically the Special Sensor Microwave/Imager (SSM/I) and Special Sensor Microwave Imager/Sounder (SSMIS) data. These satellite-based datasets provide daily global ice concentration and are assimilated into the PIOMAS model to improve estimates of sea ice thickness and volume.” (Grok)
You’d think Piomas could easily get daily sea ice concentration from a number of other (German/Japanese/ESA) providers? I only use AMSR2 anyway, for ice conc.
The NSIDC’s SSMIS data feed has been a last minute reprieve, but only for one more month: