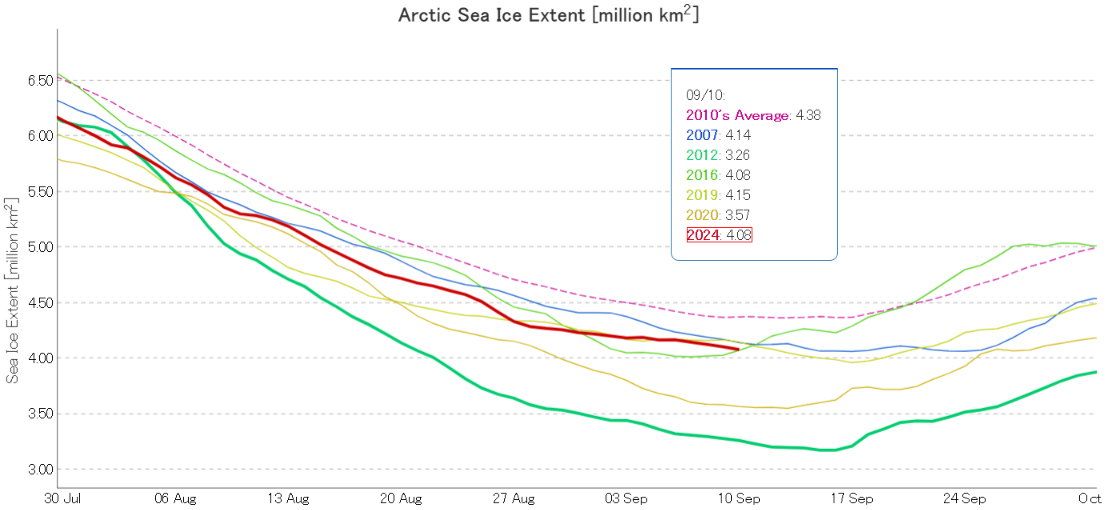
At the beginning of September JAXA/ViSHOP extent was 4th lowest for the date in the satellite era:
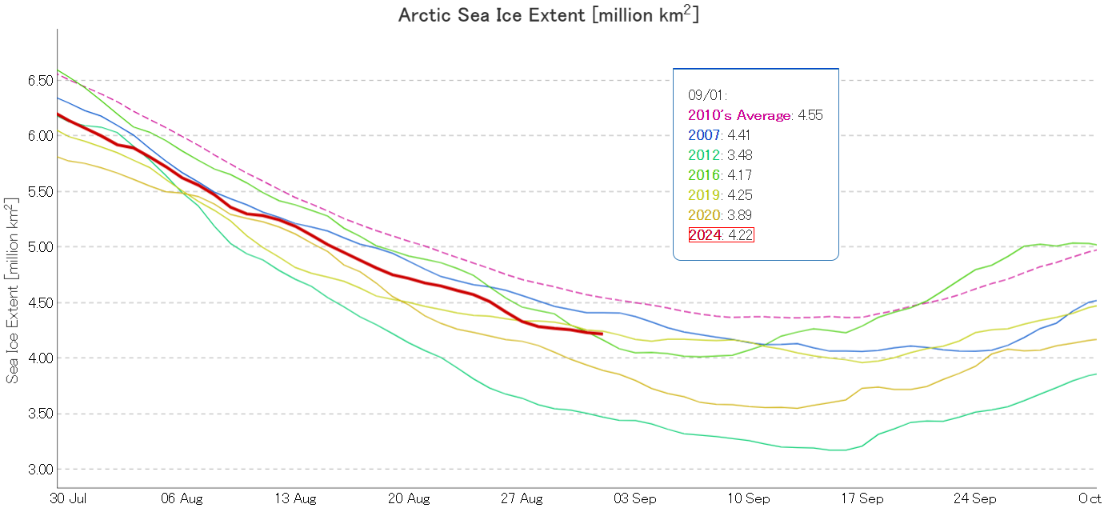
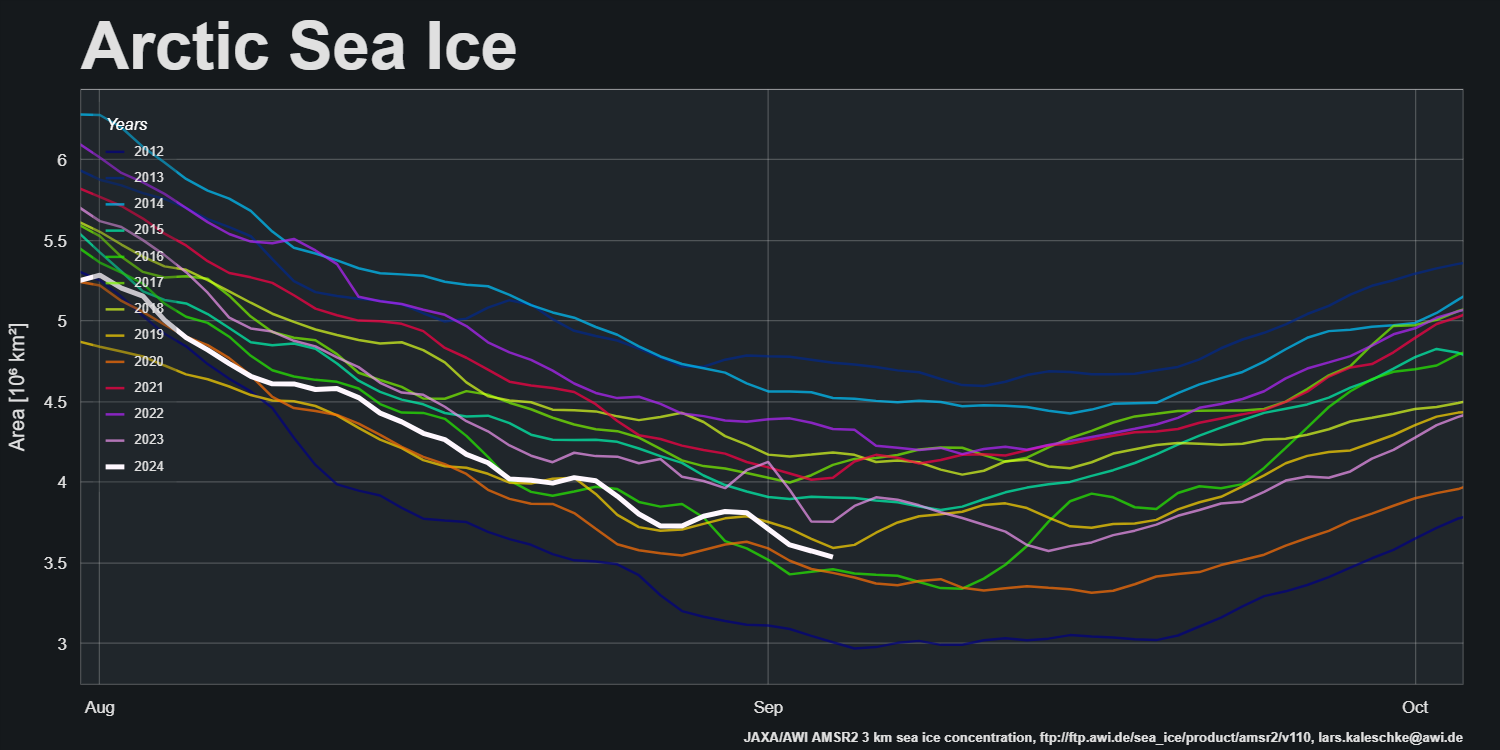
For much more detail on sea ice extent for the next few weeks please see the dedicated 2024 minimum thread. However, note that as extent has been flatlining sea ice area is still declining:
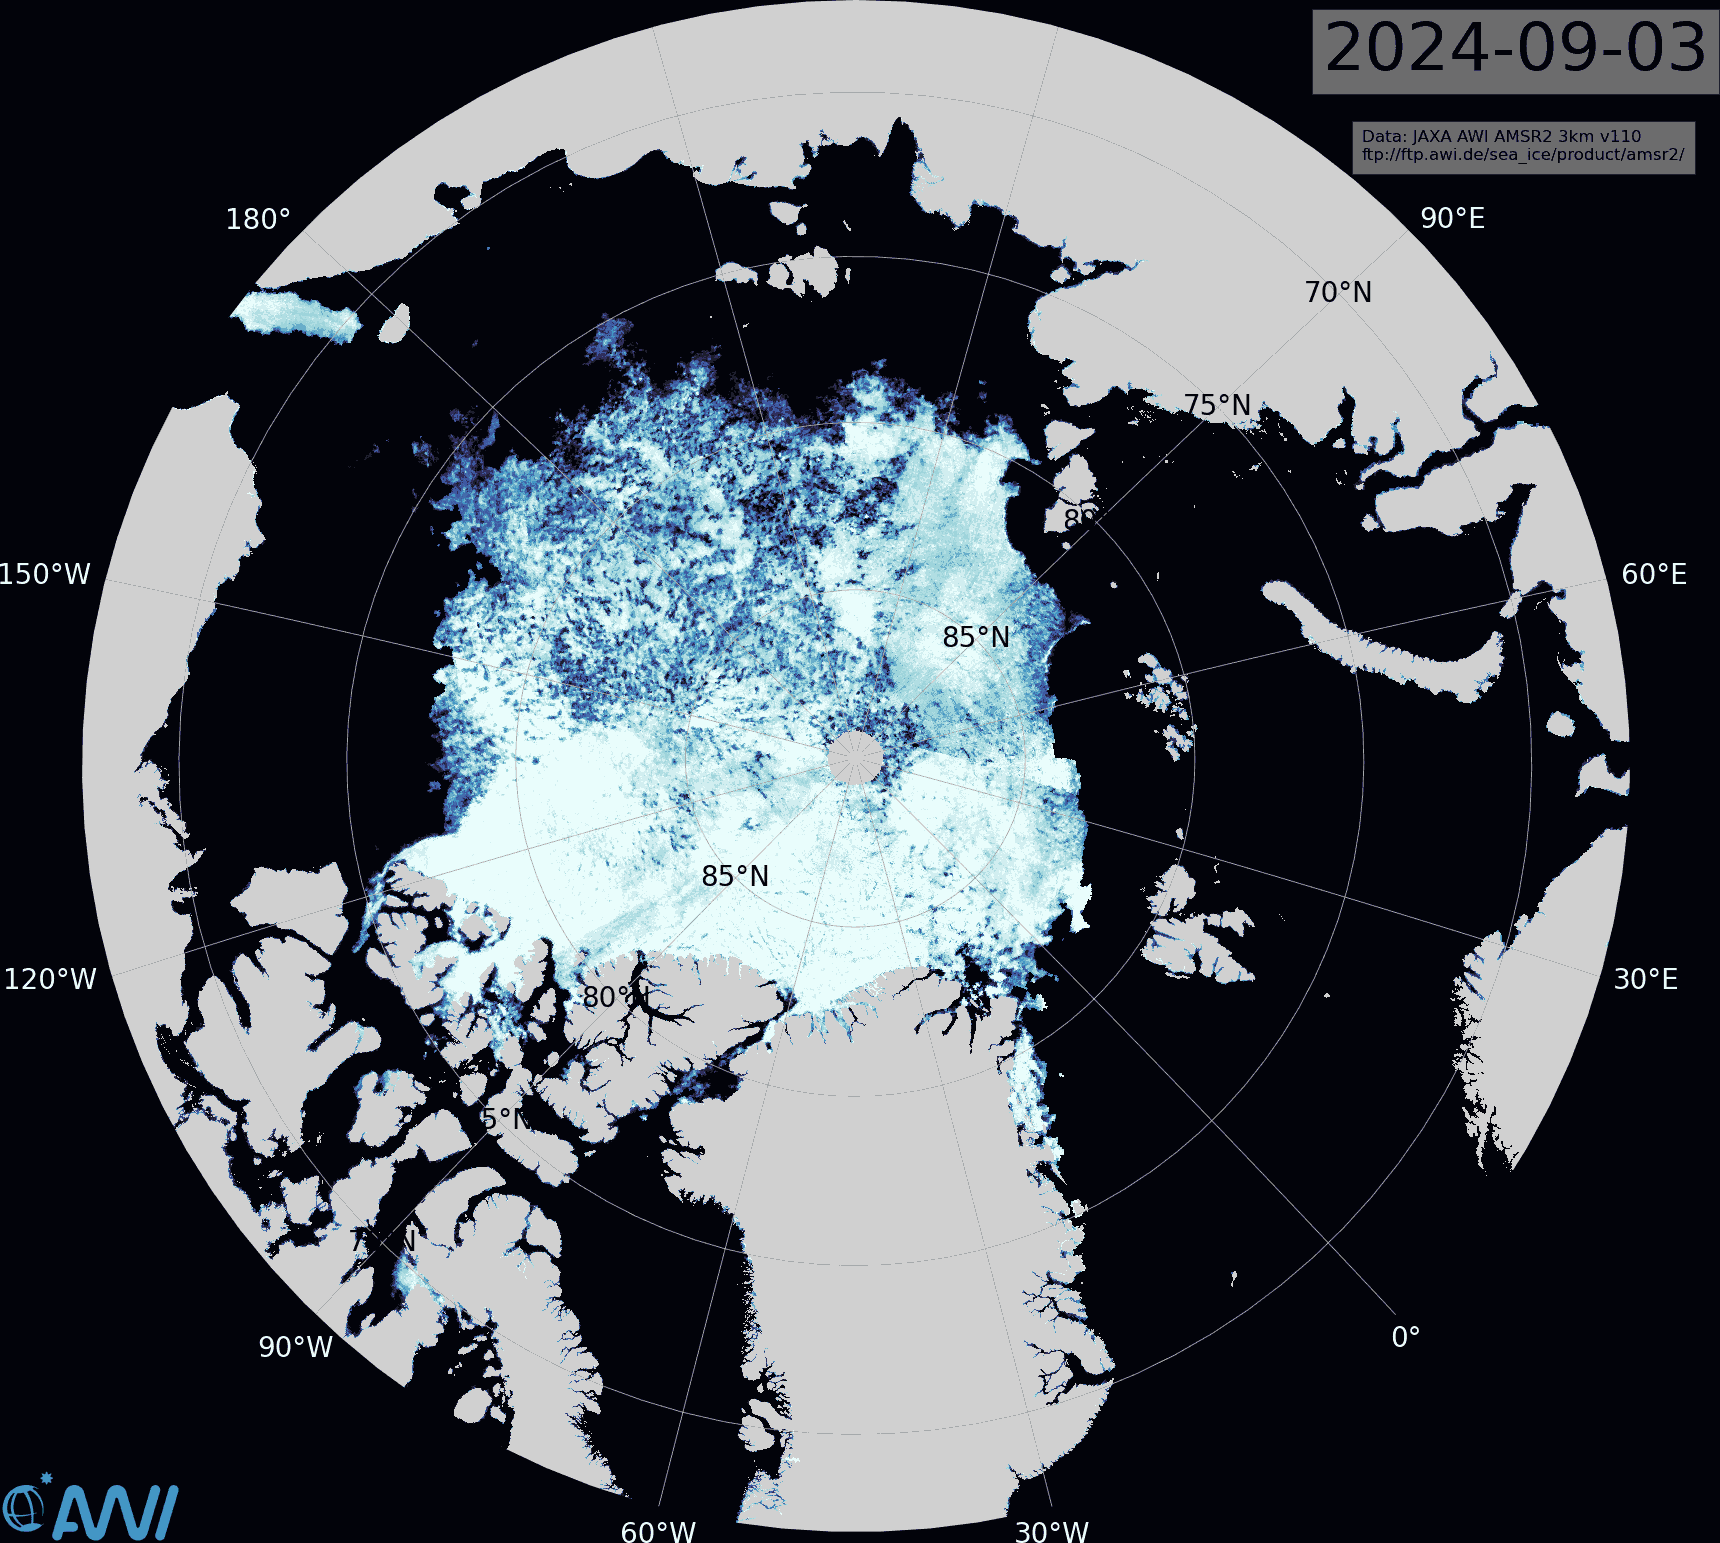
The latest AMSR2 sea ice concentration map from the Alfred Wegener Institute reveals that the area of thick ice in the Chukchi Sea has still not melted:
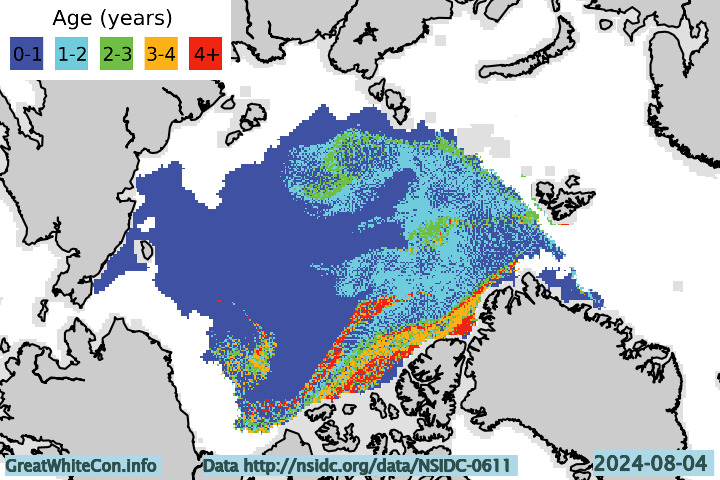
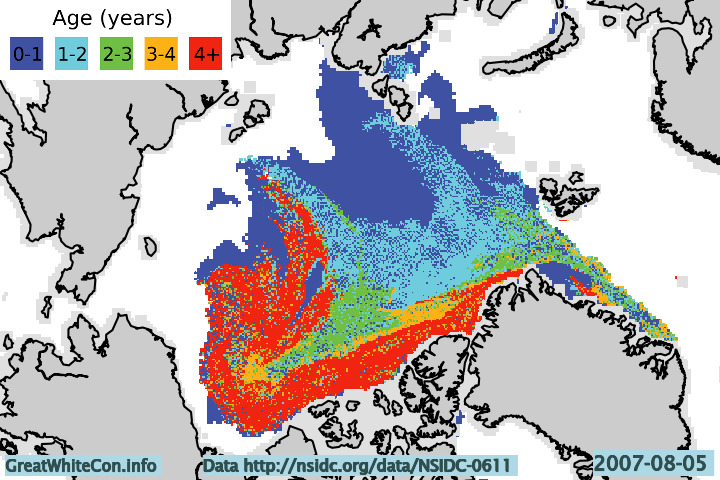
The most recent sea ice age map currently available dates from the beginning of August. Comparison with the concentration map shows that most of the remaining first year ice is highly fragmented, even close to the North Pole:
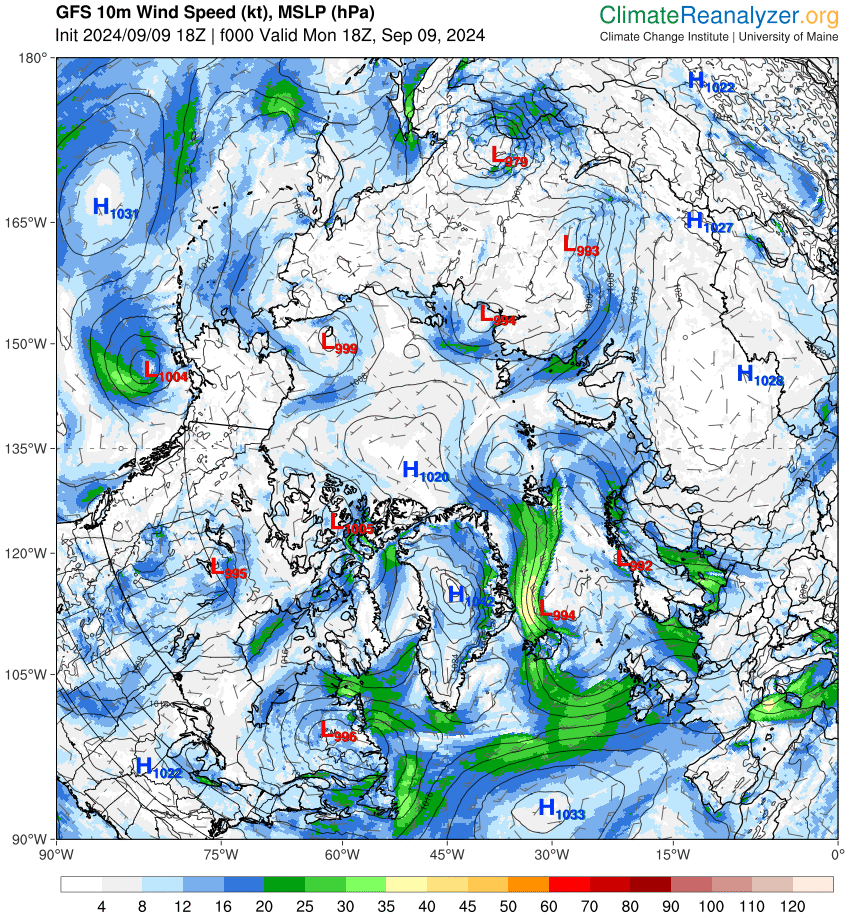
The central Arctic is currently still dominated by low pressure, but the GFS forecast suggests that high pressure will build over the next few days:
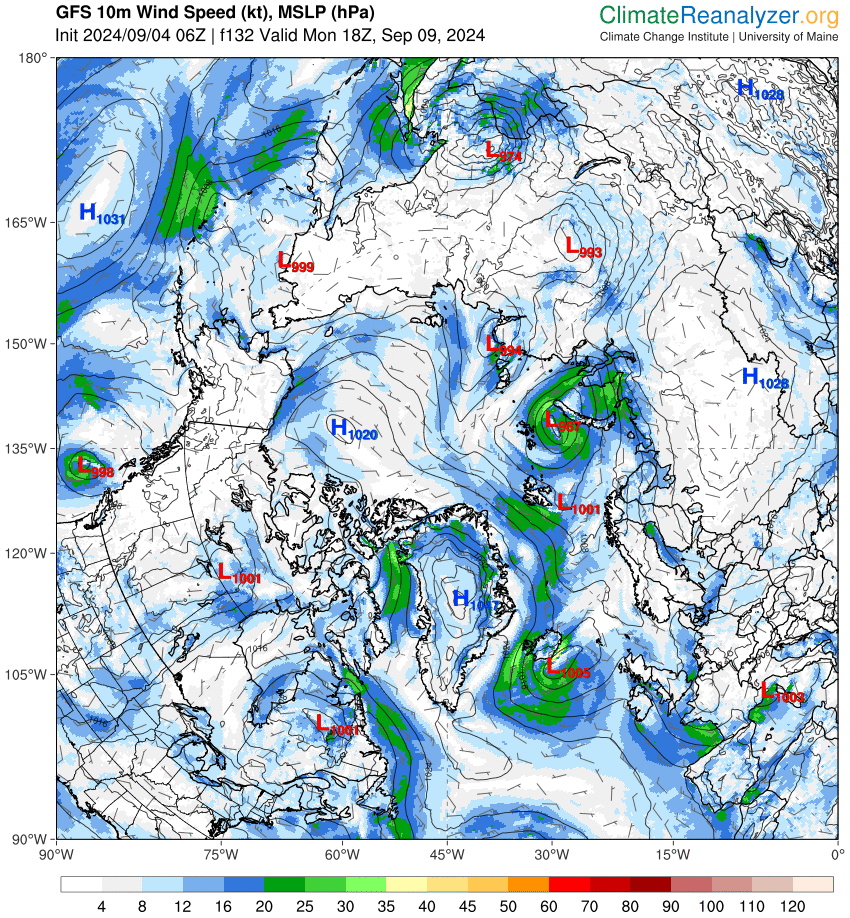
As the 2024 minimum extent approaches there will be a race between refreezing in the centre versus continued melting at the periphery. The advent of high pressure may also result in compaction of remaining low concentration areas. Which of these processes will emerge victorious?
[Update – September 5th]The PIOMAS gridded thickness data for August 2024 has just been released:
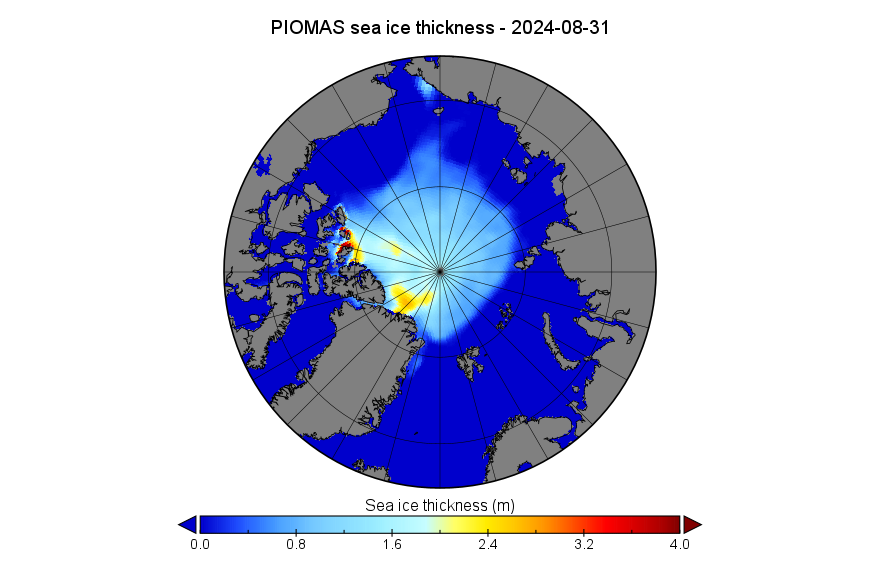
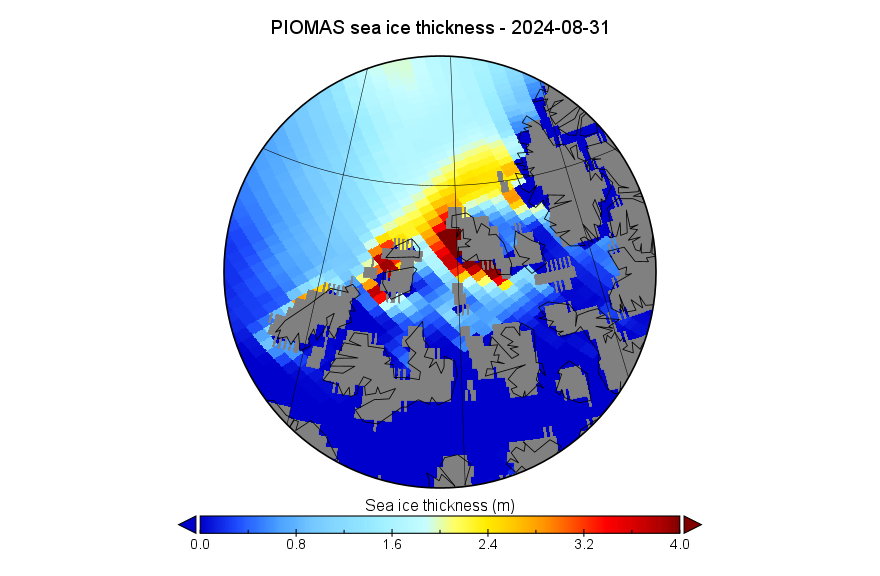
It shows that the thickest remaining sea ice is now to be found in the Canadian Arctic Archipelago rather than in the Arctic Ocean itself:
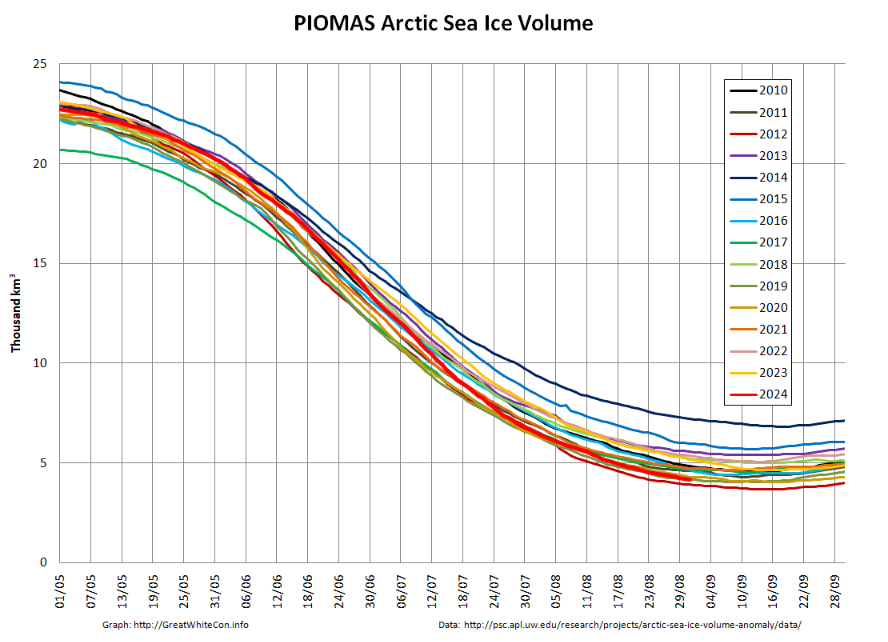
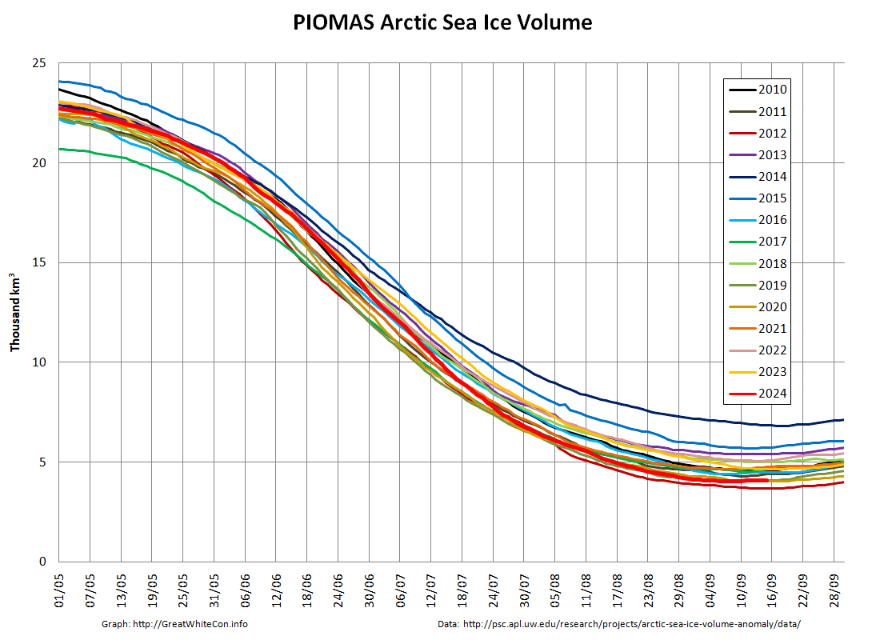
Modelled volume was 4.17 thousand km³ on August 31st, 3rd lowest for the date in the PIOMAS record:
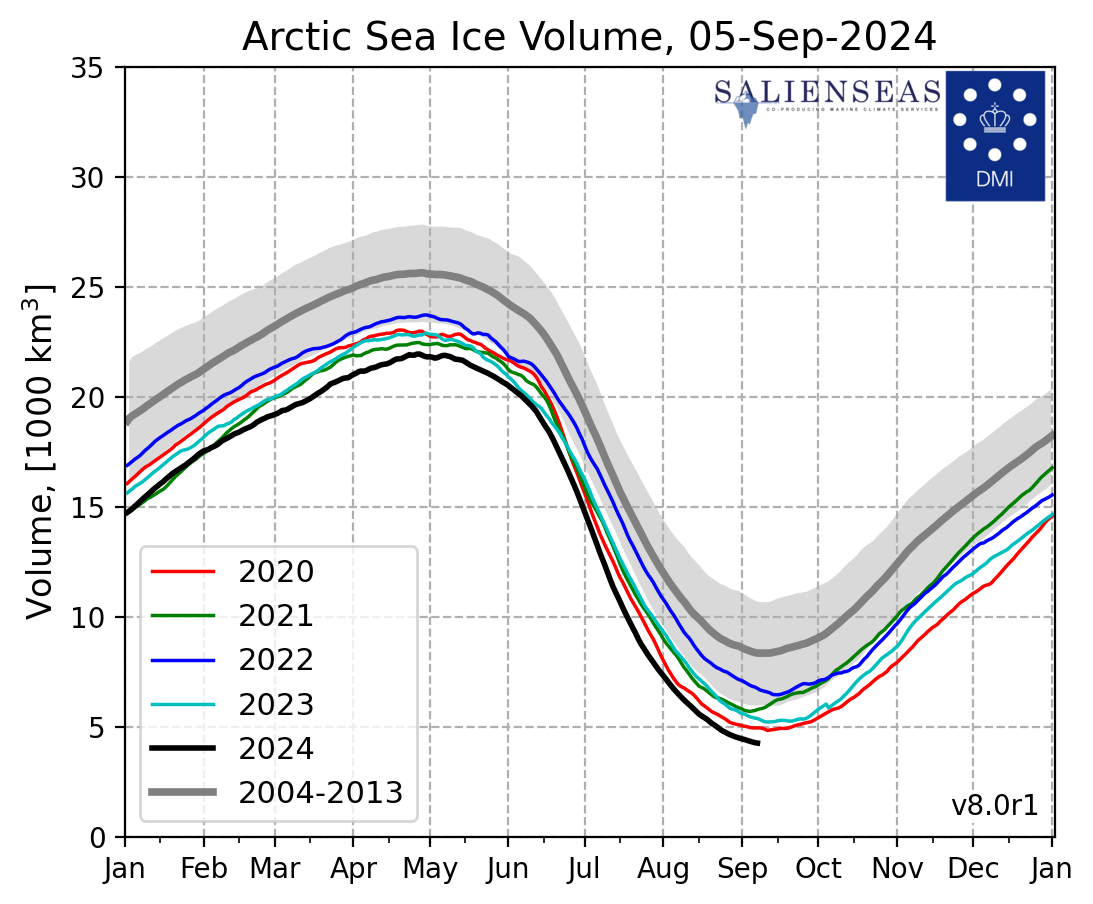
DMI volume remains lowest for the date in their record:
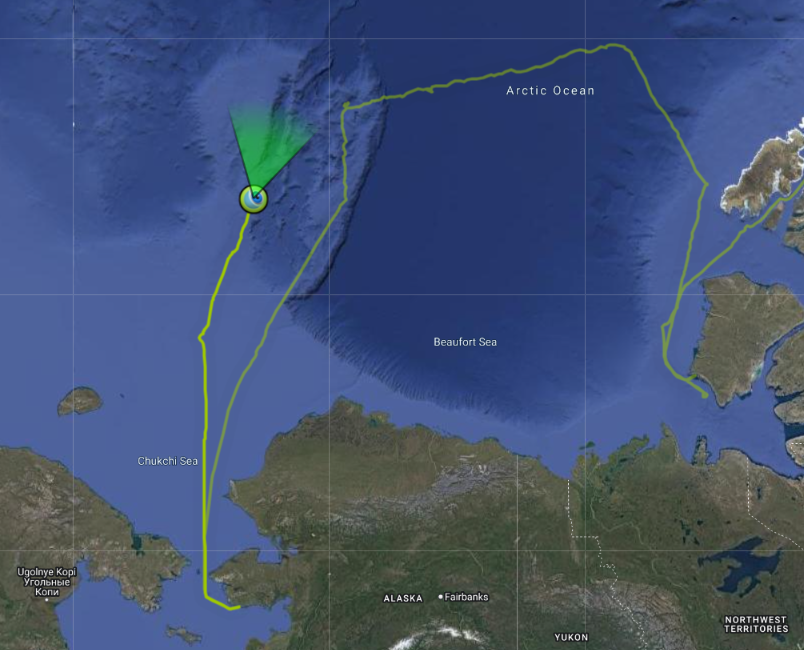
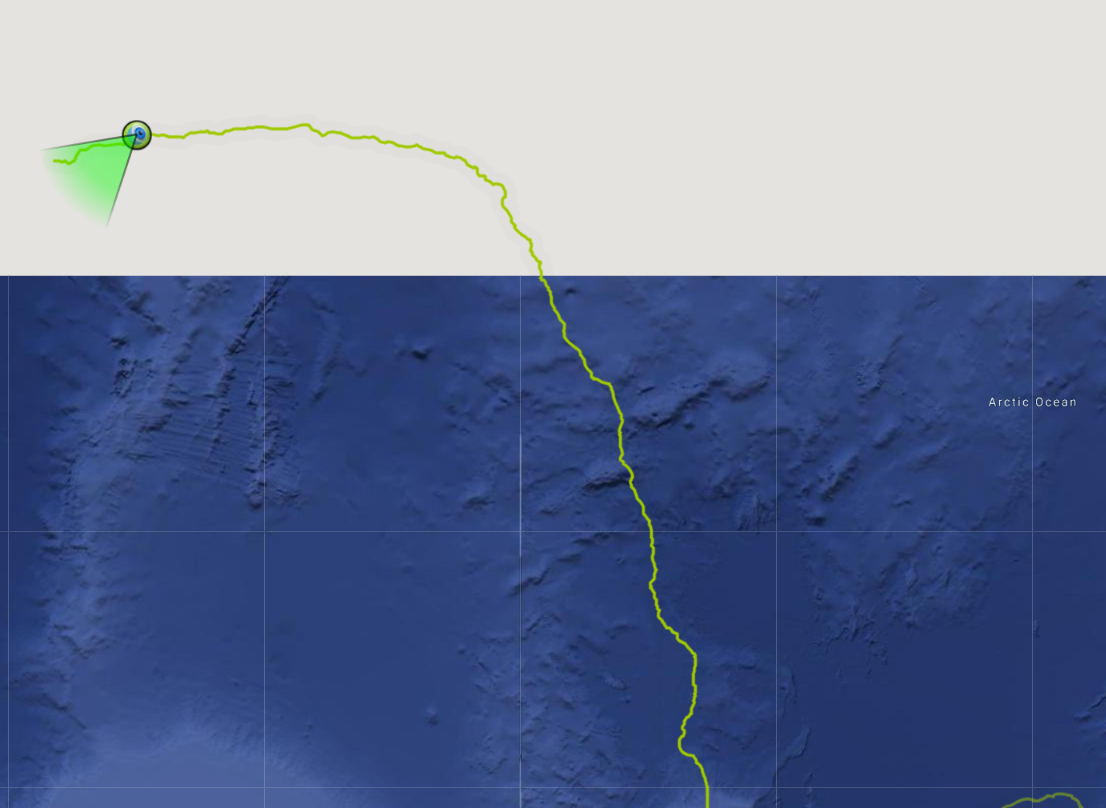
Following a decidedly non standard trip through the Northwest Passage, the polar class 2 cruise ship Le Commandant Charcot is now undertaking an even more unusual voyage. From Nome, Alaska to Svalbard via the North Pole:
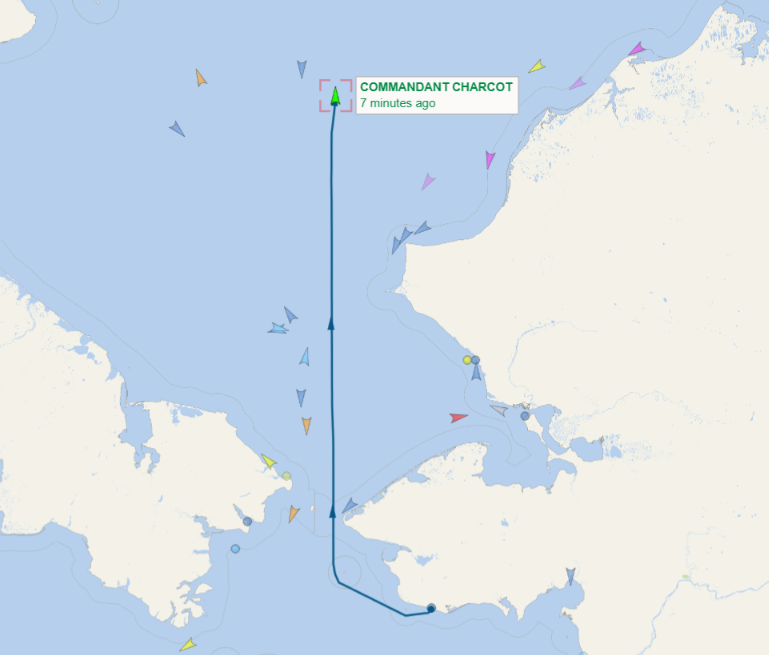
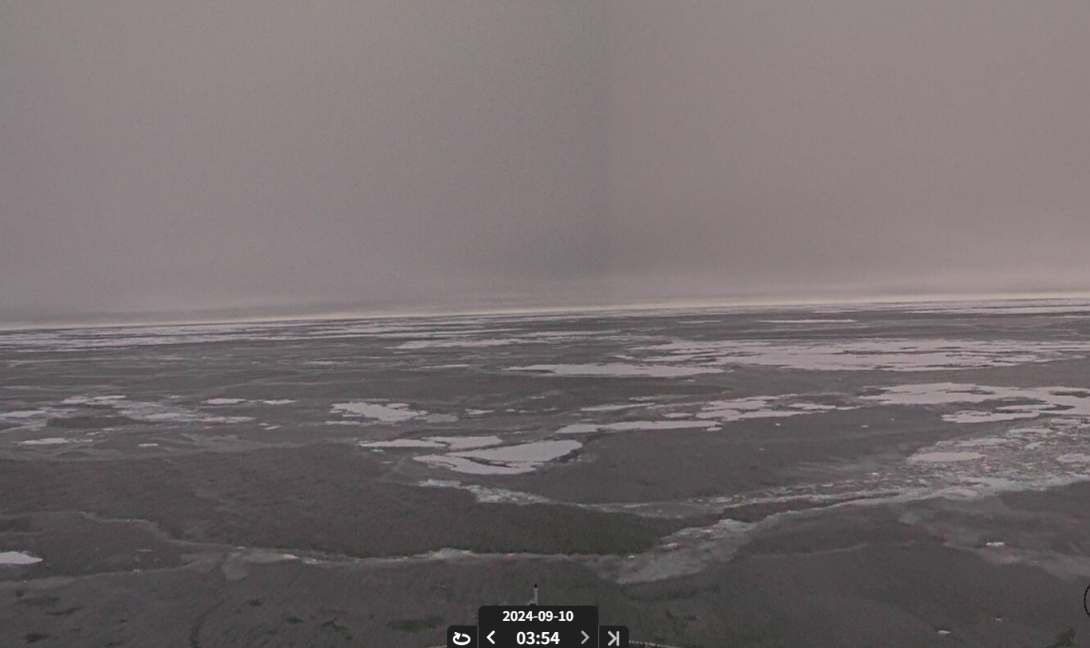
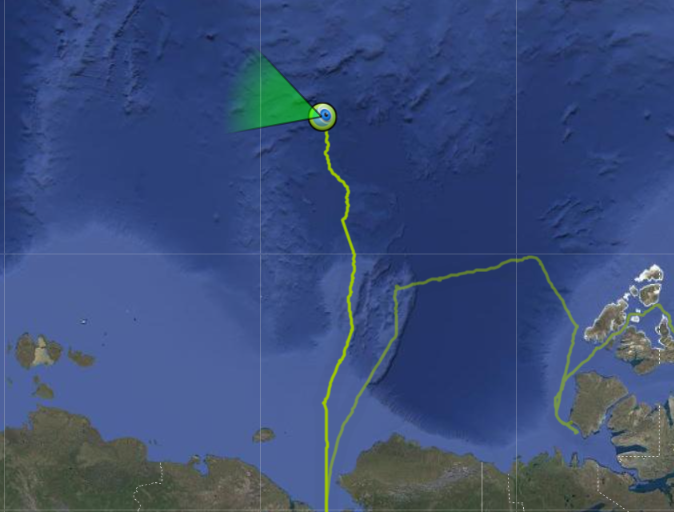
Le Commandant Charcot has reached the marginal ice zone north of Alaska:
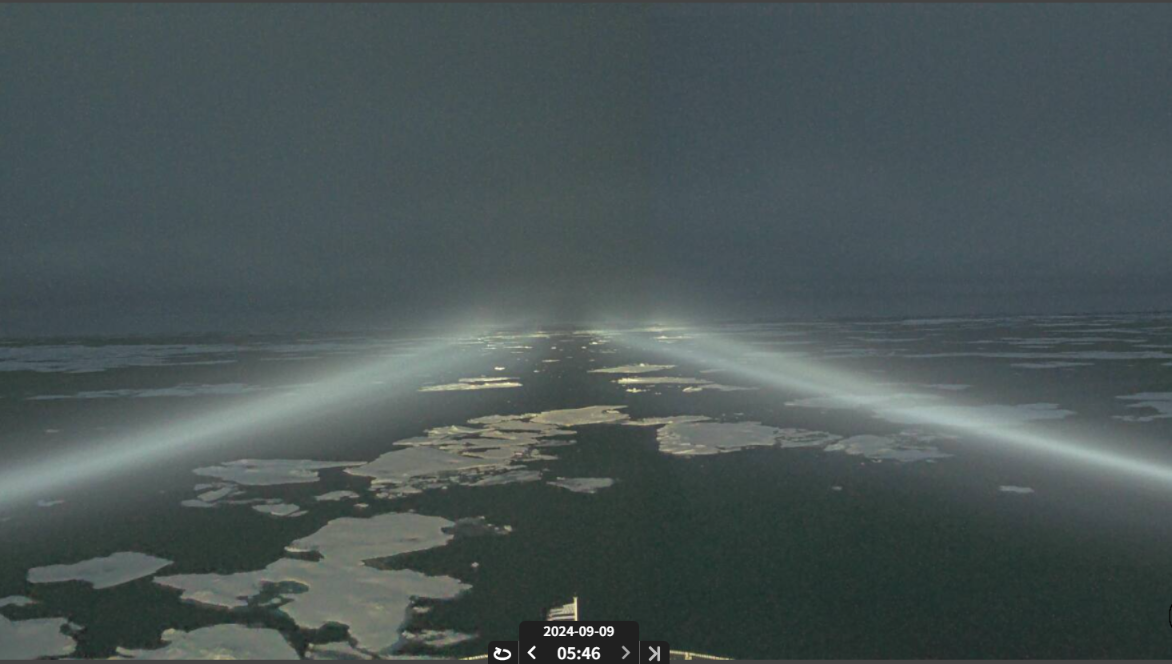
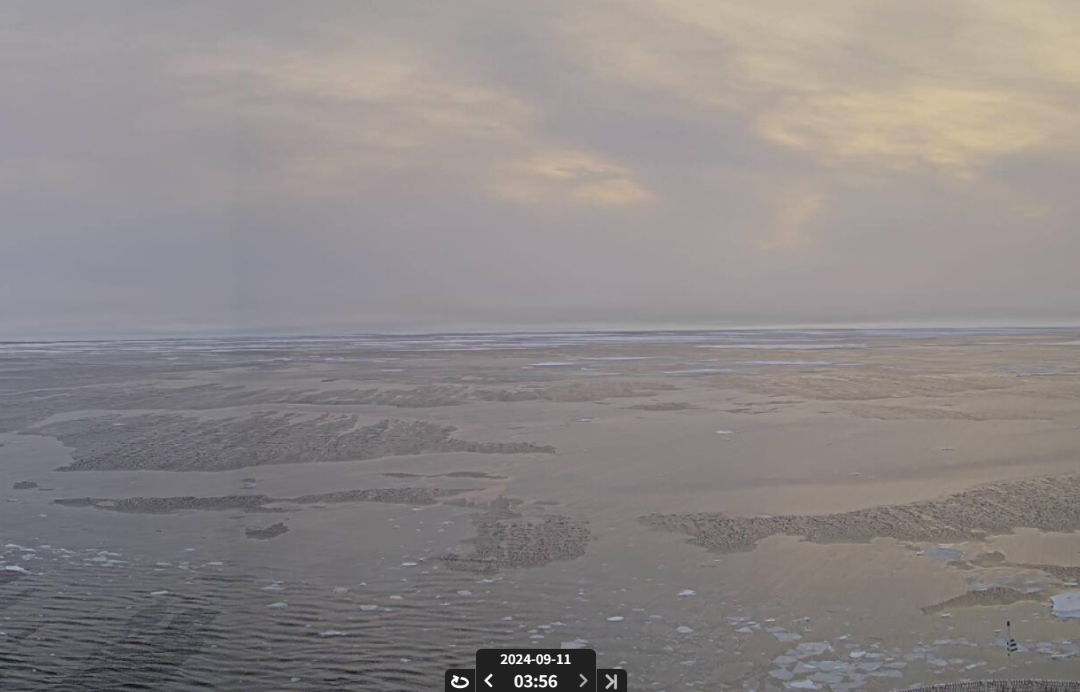
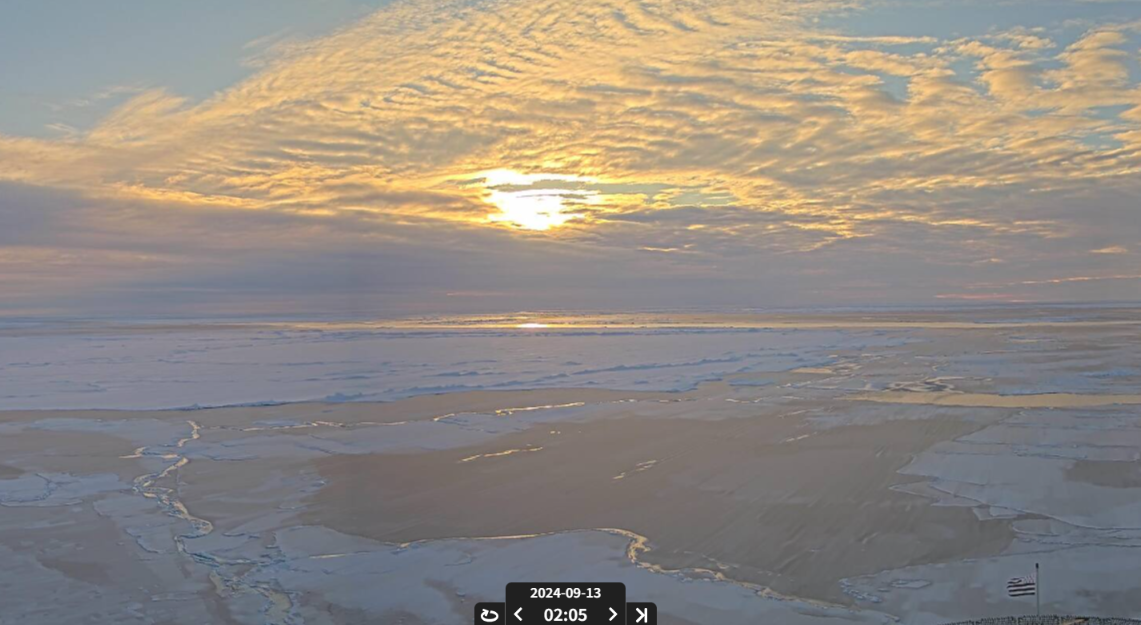
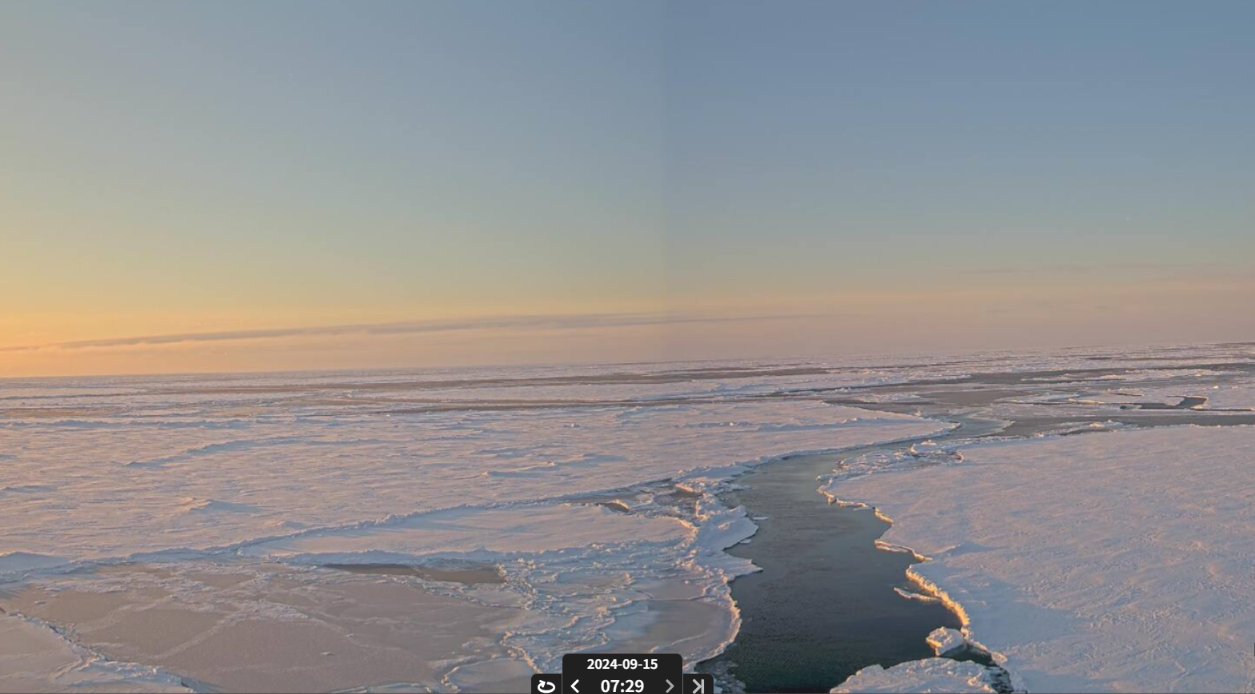
Here’s the current view from the ship’s webcam:
The central Arctic high didn’t quite work out as forecast, and is now sliding off towards the Fram Strait, with a modest low over the Chukchi Sea:
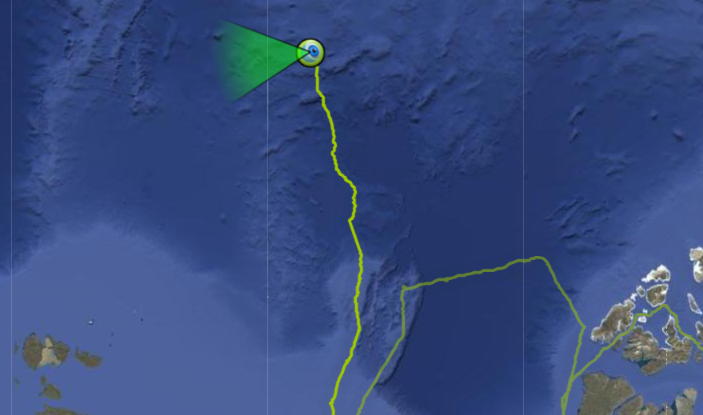
Plus Le Commandant Charcot’s view of the sea ice at just over 80N:

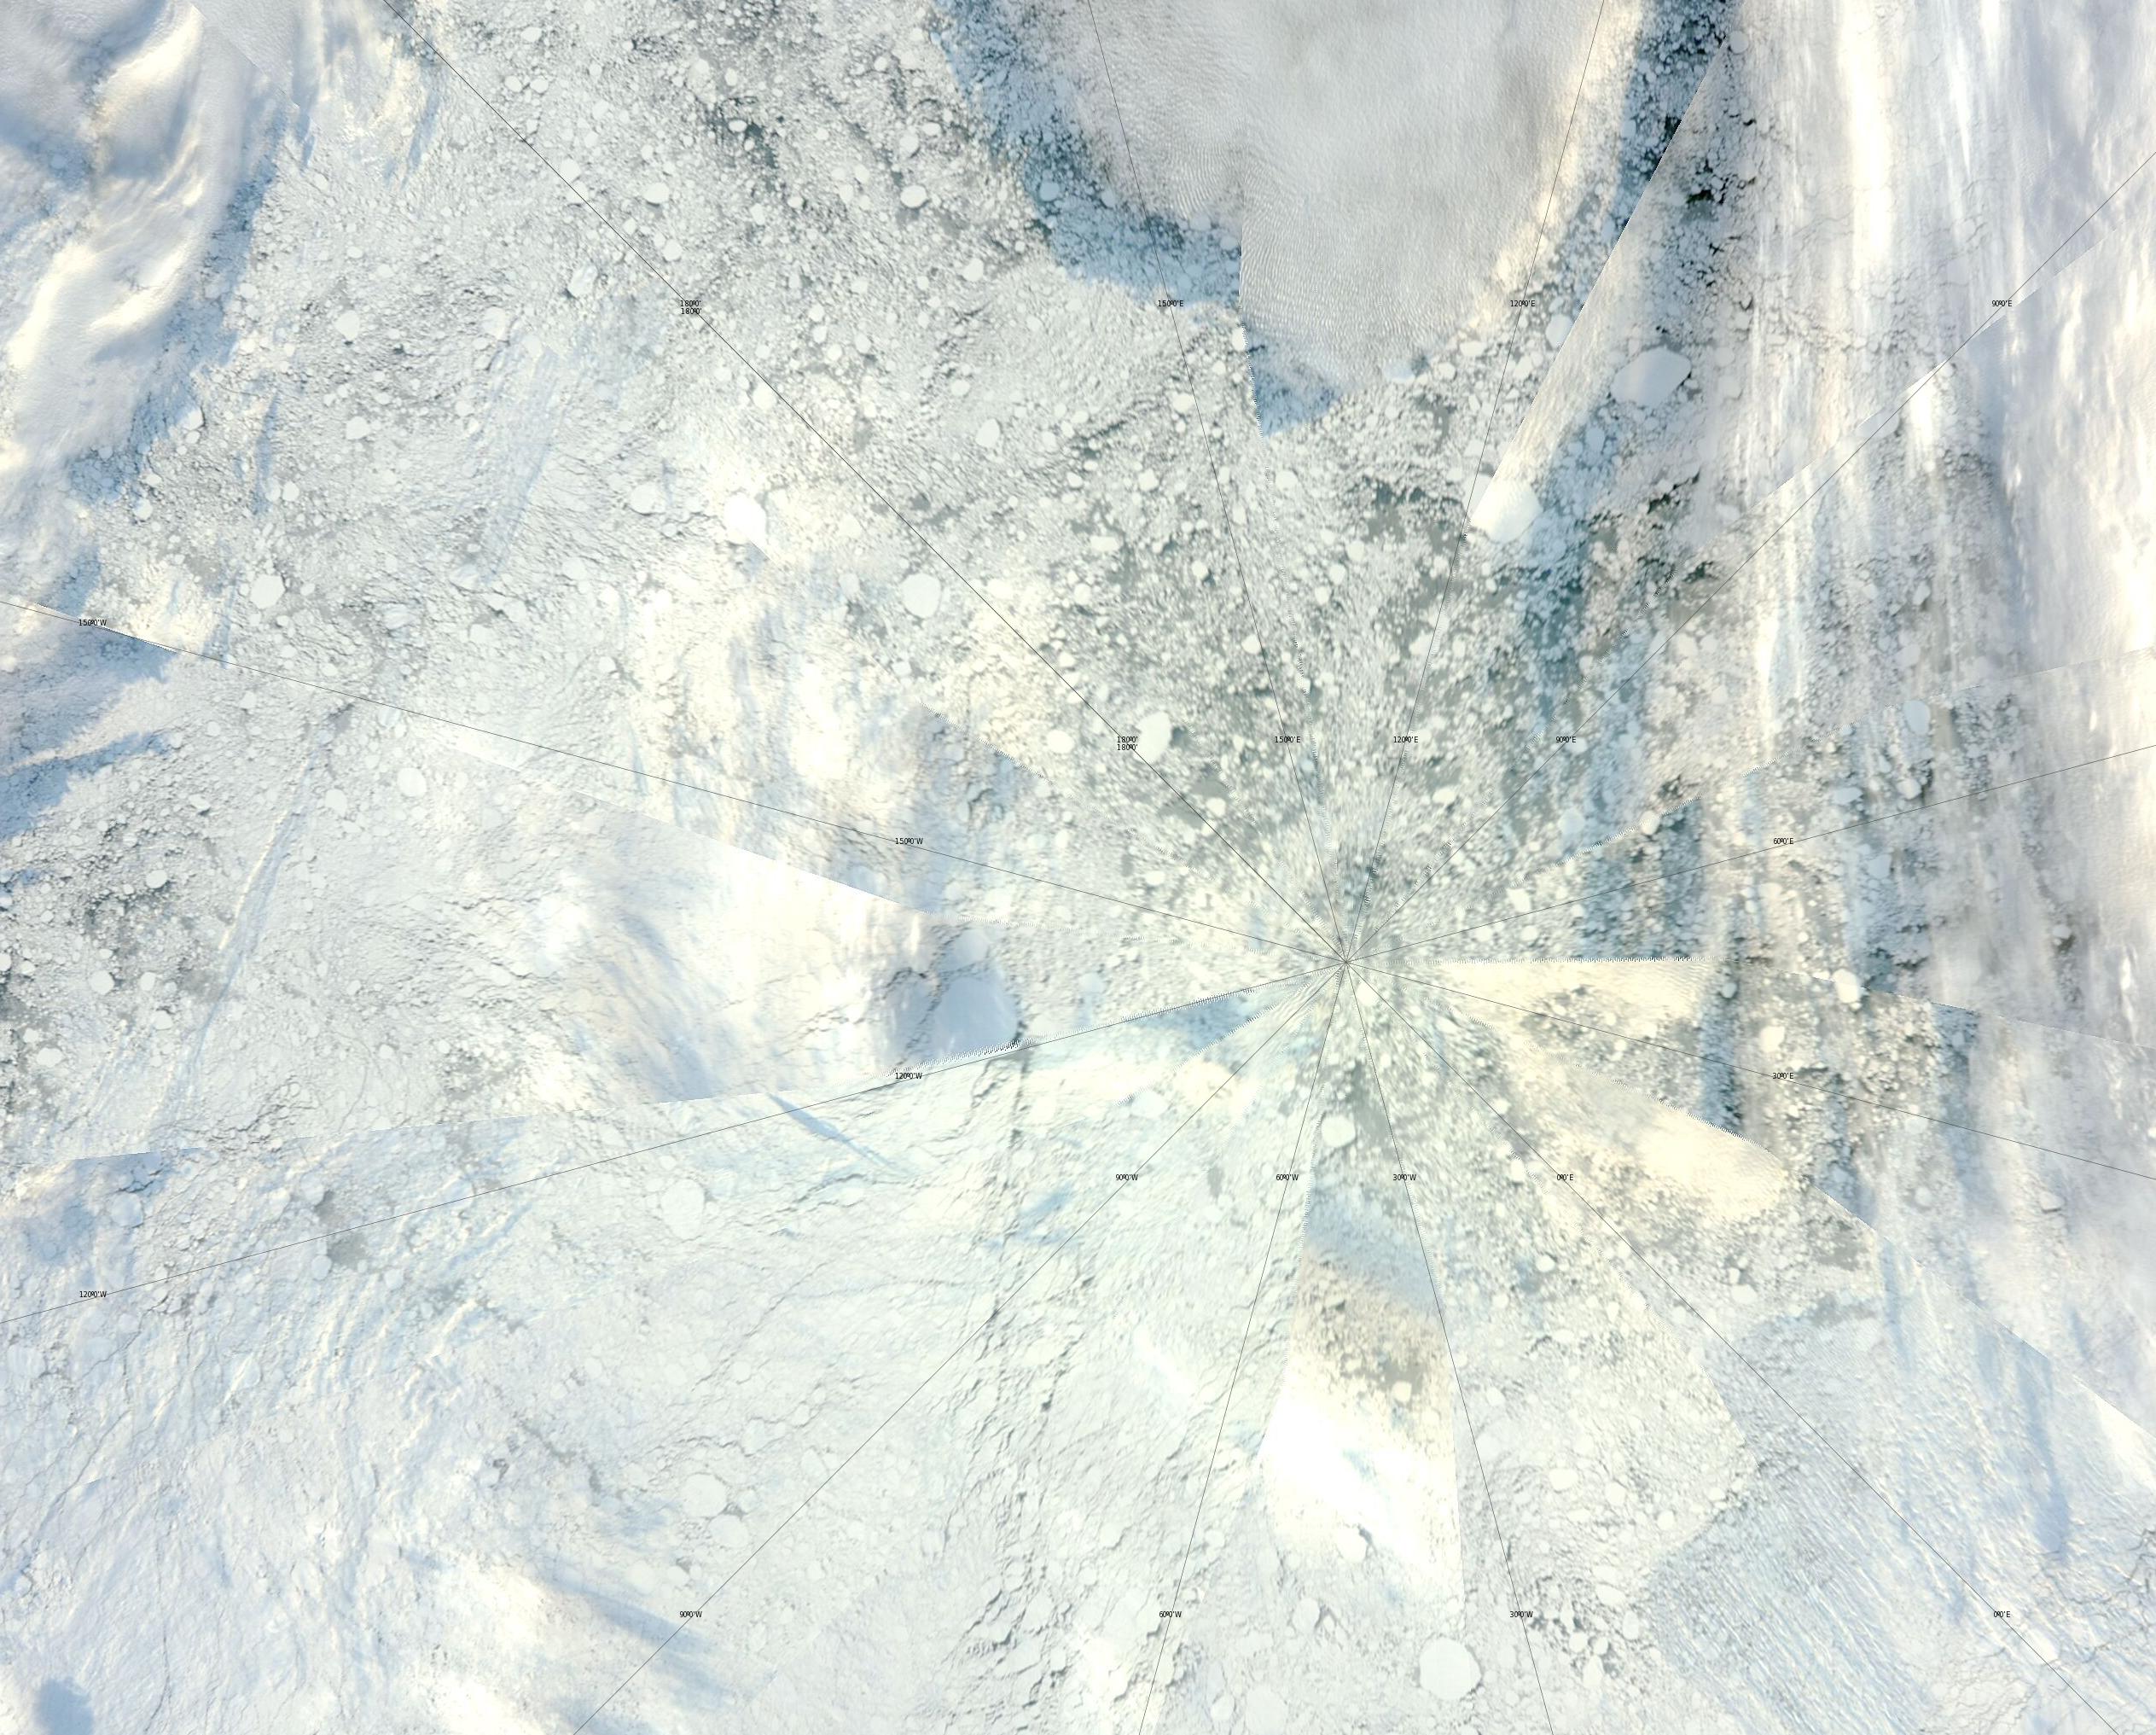
Thanks to the high pressure in the vicinity, here’s a reasonably clear satellite image of the start of the refreeze at the North Pole:
However JAXA extent is still declining, and is now equal 3rd lowest for the date:
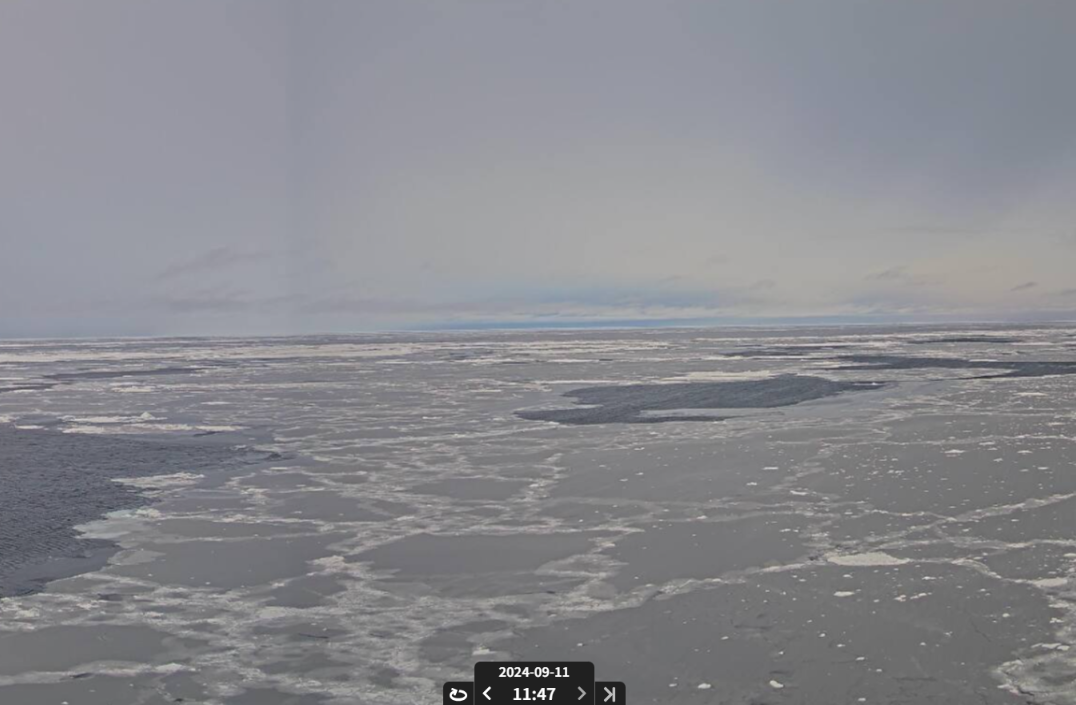
Plus Le Commandant Charcot’s view of the sea ice at around 83N:
P.S. Here’s this evening’s (UTC) update from Le Commandant Charcot at around 84N:
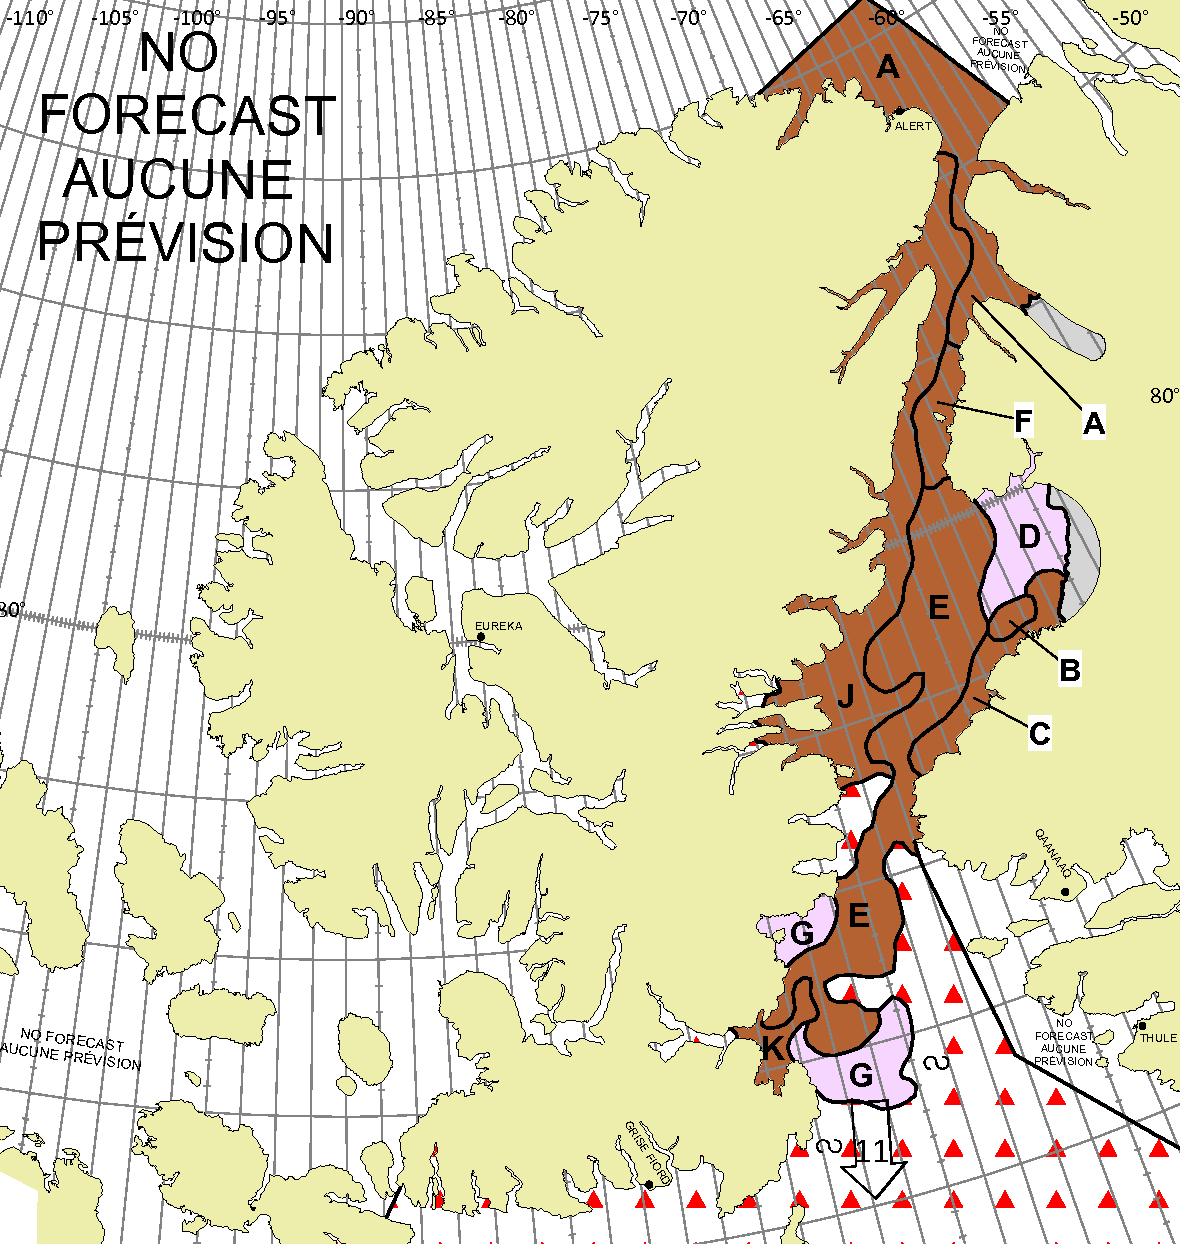
P.P.S. New ice (coloured in pink) now features on the Canadian Ice Service’s chart of the Nares Strait:
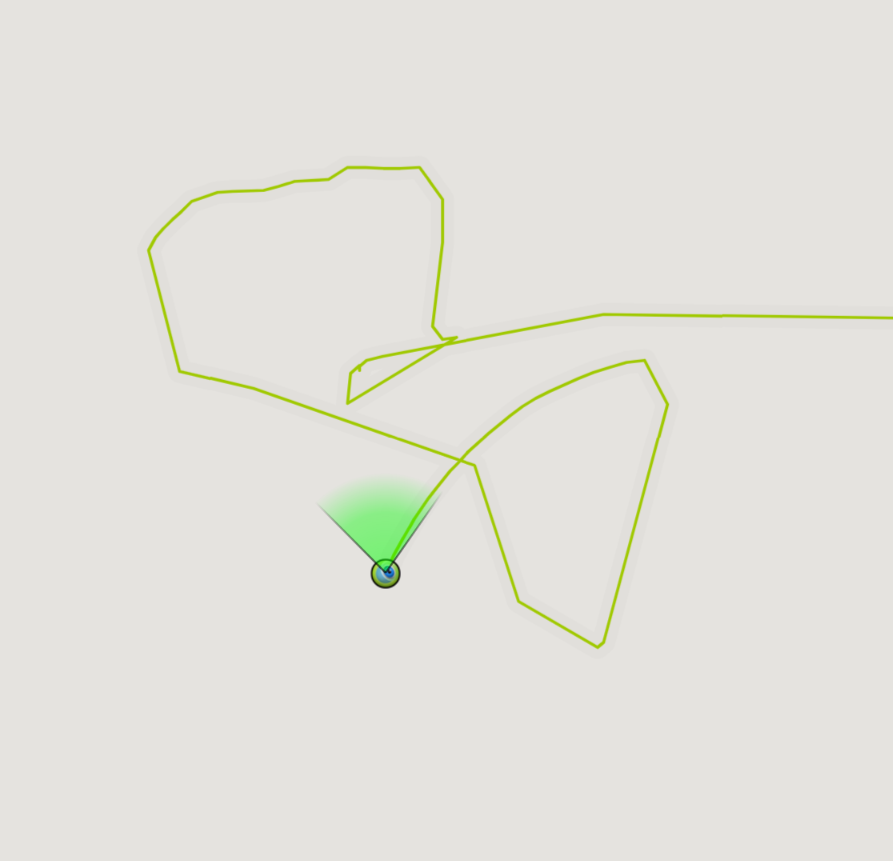
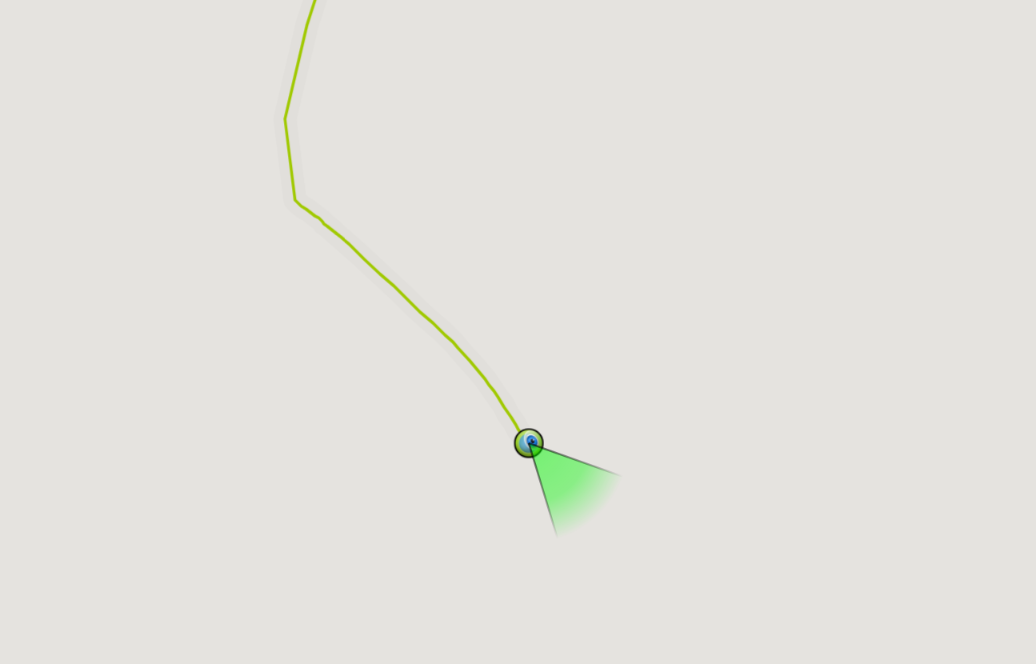
Evidently the sun hasn’t set in the high Arctic just yet. However it’s now a bit tricky to determine the exact location of Le Commandant Charcot from the Ponant tracking map:
Do you suppose that this curious tracking map means that the Captain of Le Commandant Charcot is having some trouble locating a nice firm floe at the North Pole?
Le Commandant Charcot has finally found some solid looking sea ice, not far from the North Pole:
The tracking map is still useless for working out the ship’s position, but thanks to Niall over on the Arctic Sea Ice Forum for reminding me that it has a weather station on board. That reveals Charcot’s recent position, and this OgiMet map also reveals a lot more information about the progression of the nascent Arctic refreeze:
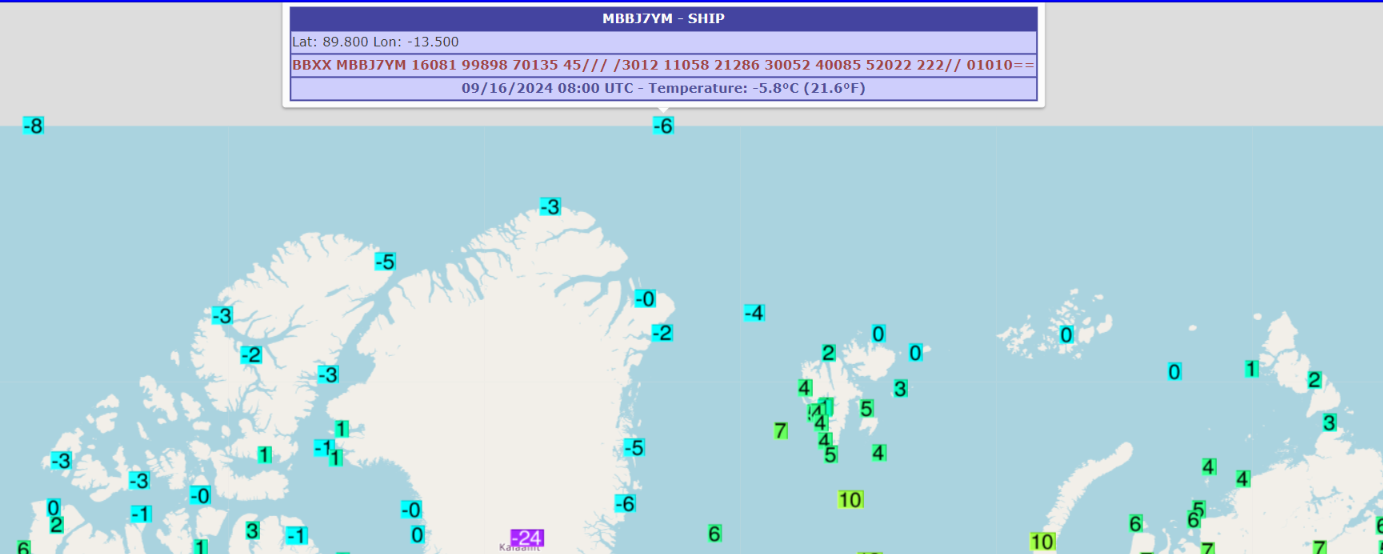
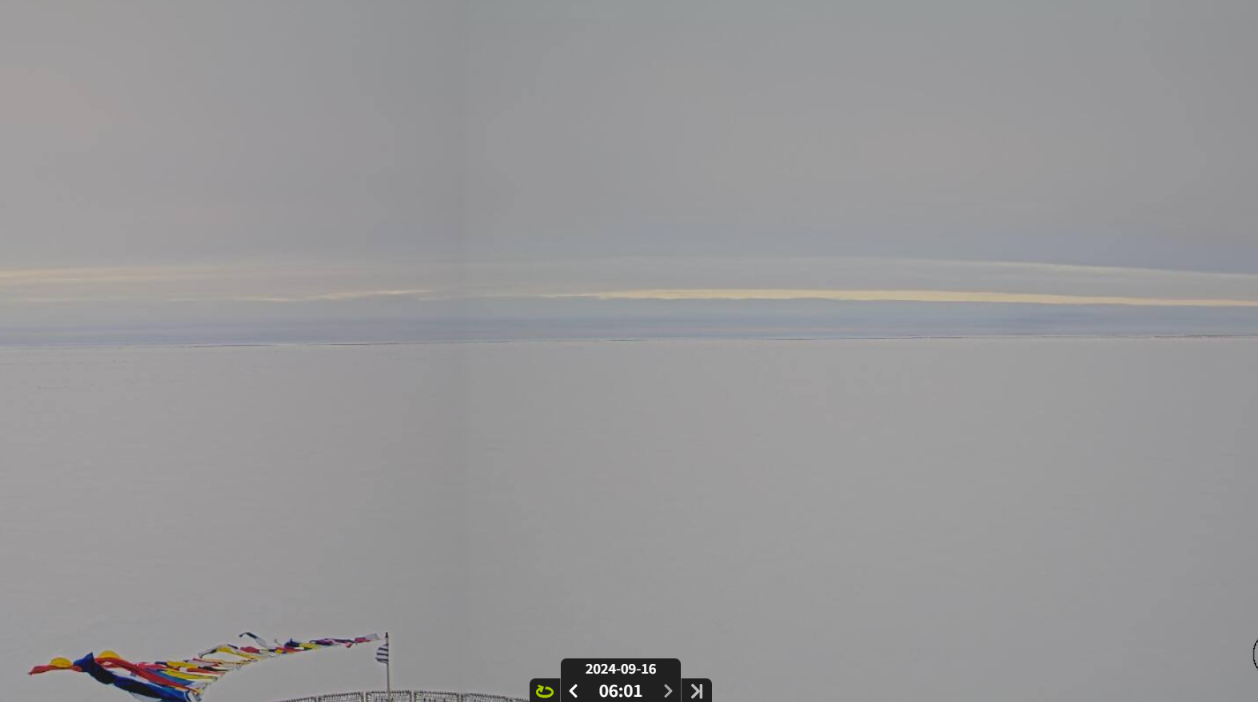
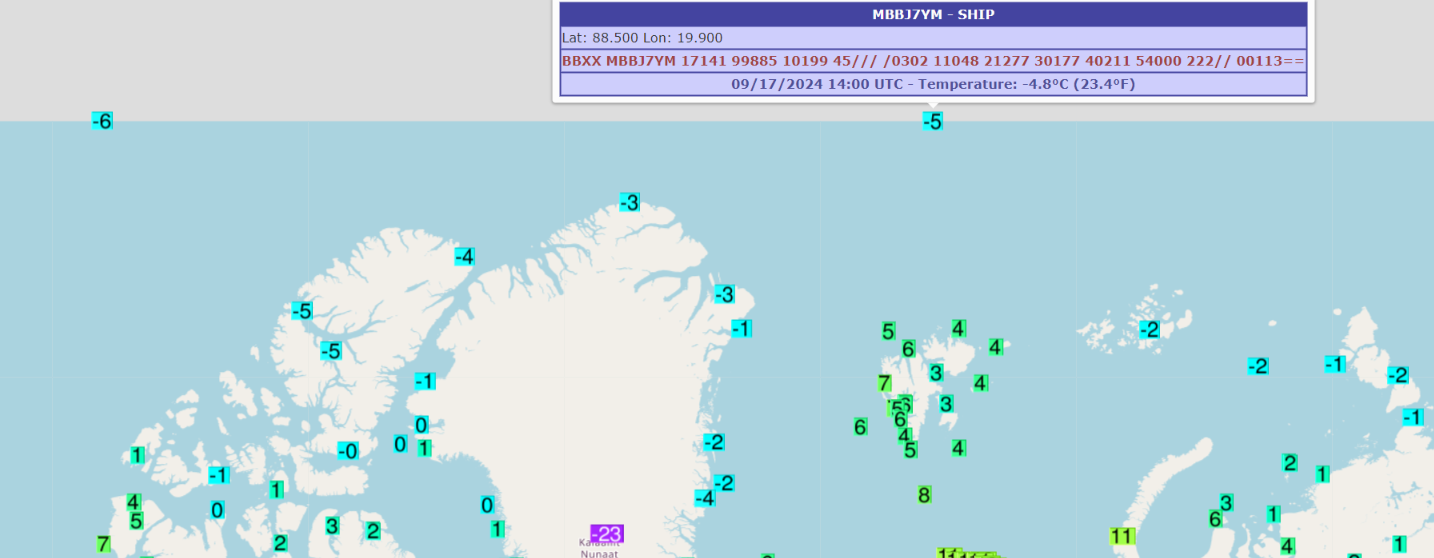
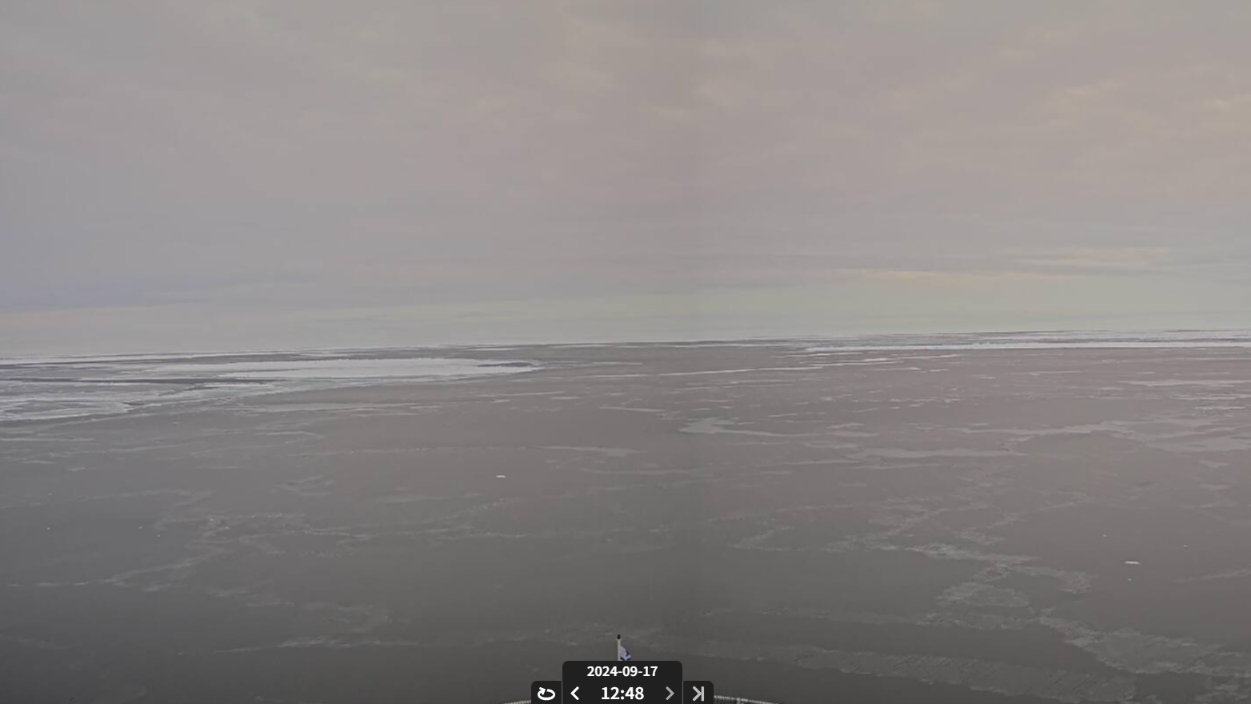
Here’s todays update from Le Commandant Charcot’s webcam. Ponant’s own tracking map is still useless, so here once again is a map of recent temperature measurements on the Atlantic side of the high Arctic. I presume that the image was recorded somewhere near 88.5 N, 19.9 E:
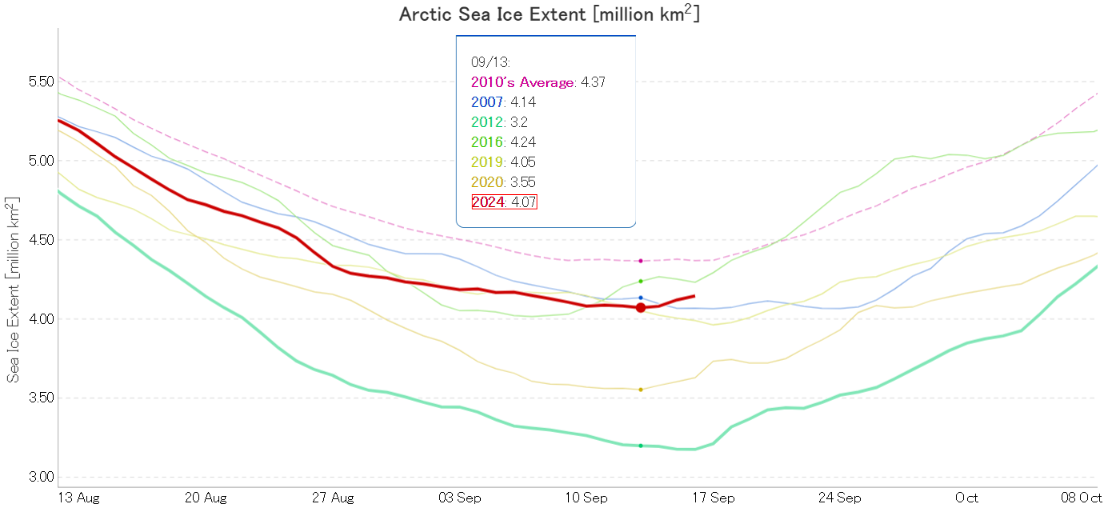
There’s much more information available over on the dedicated 2024 minimum thread, but It now looks highly likely that the 2024 Arctic sea ice minimum extent has been reached, using JAXA data at least:
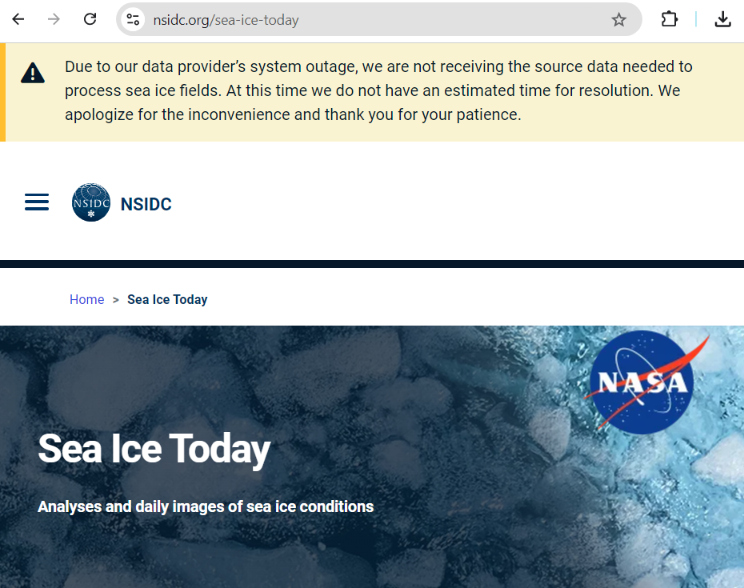
A problem with SSMIS data emanating from NOAA means that several other extent metrics are still stuck on September 11th:
The mid-month PIOMAS gridded thickness data reveals that the 2024 minimum sea ice volume of 4.04 thousand km³ was reached on September 8th:
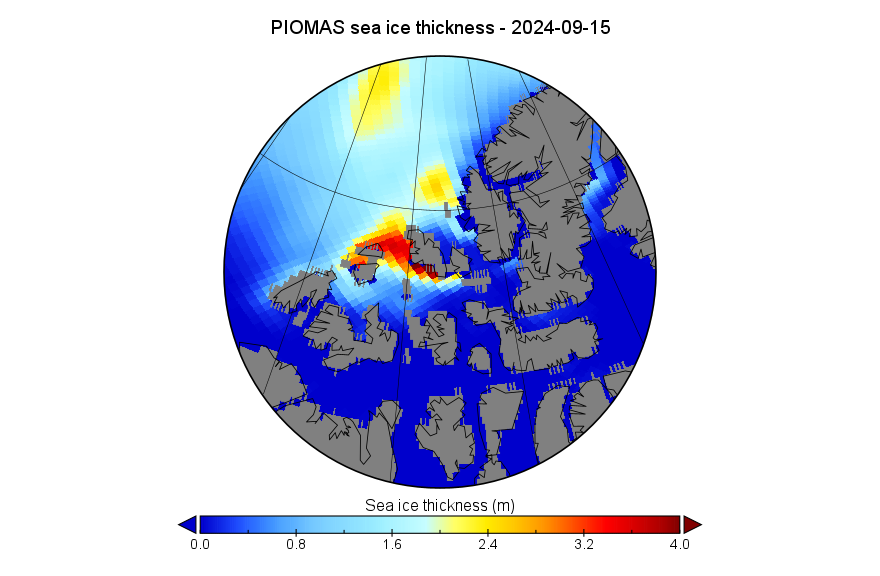
Here’s the associated thickness map:
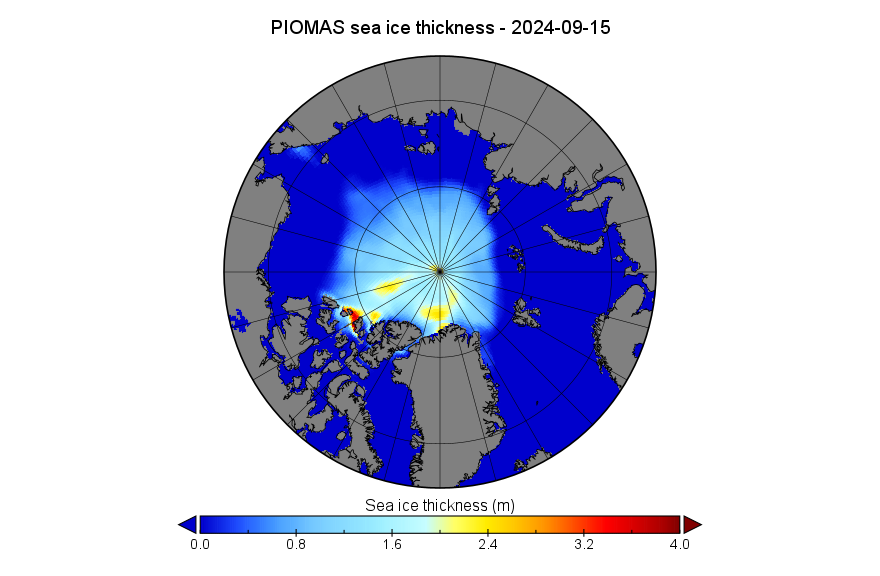
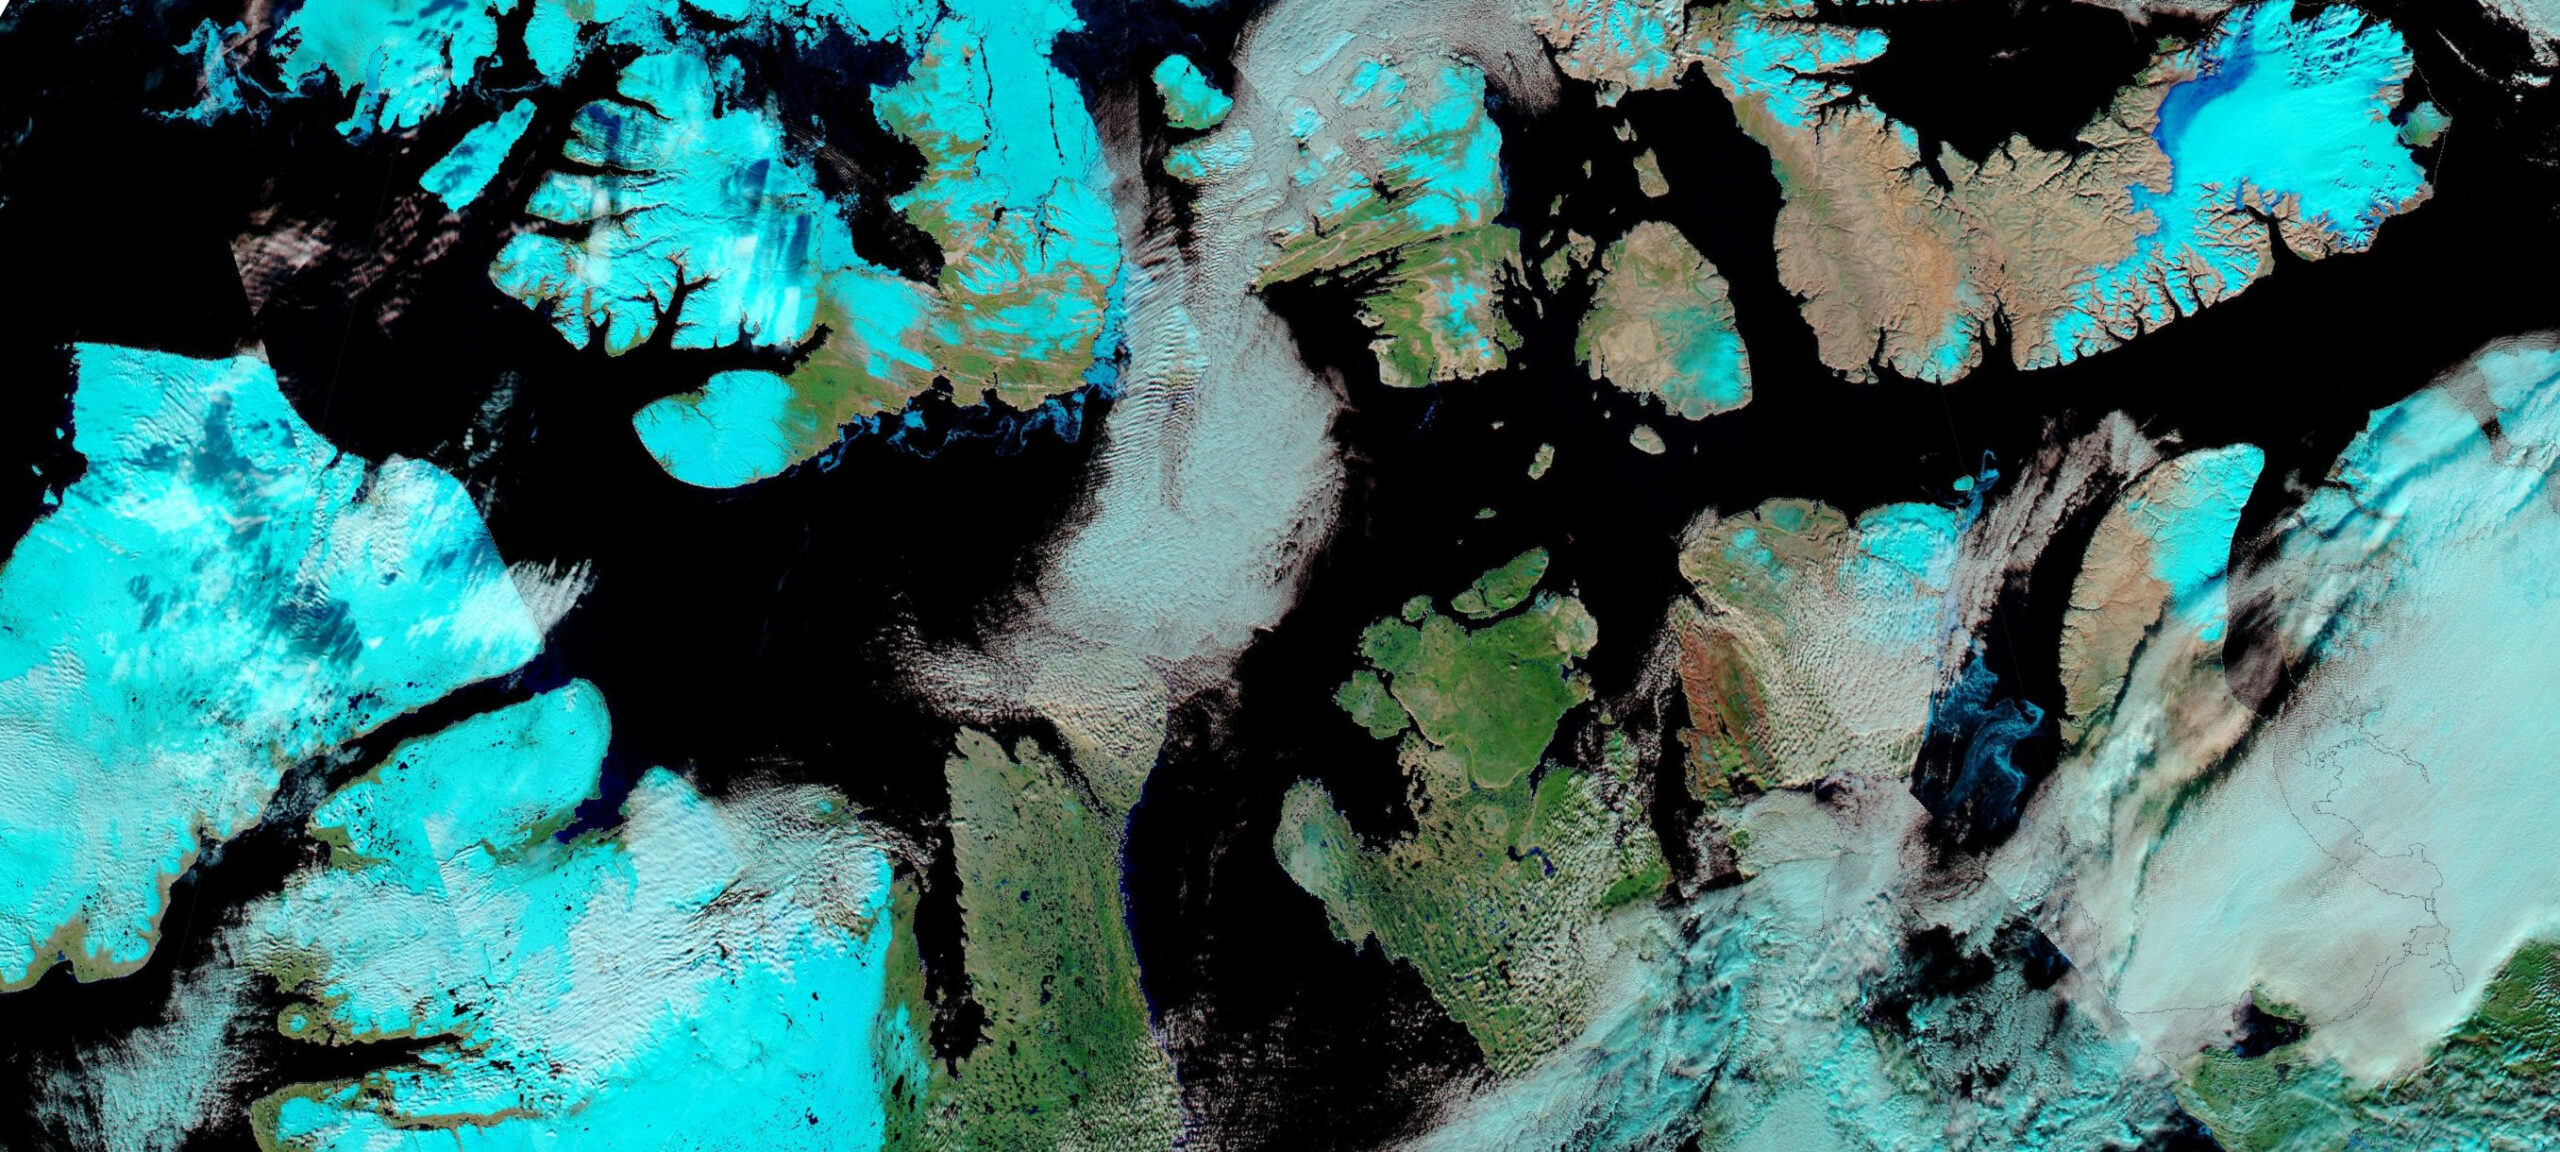
Zooming in on the Parry Channel, most of the thickest sea ice in the Arctic is now in the Prince Gustaf Adolf Sea, as it moves south through the Canadian Arctic Archipelago:
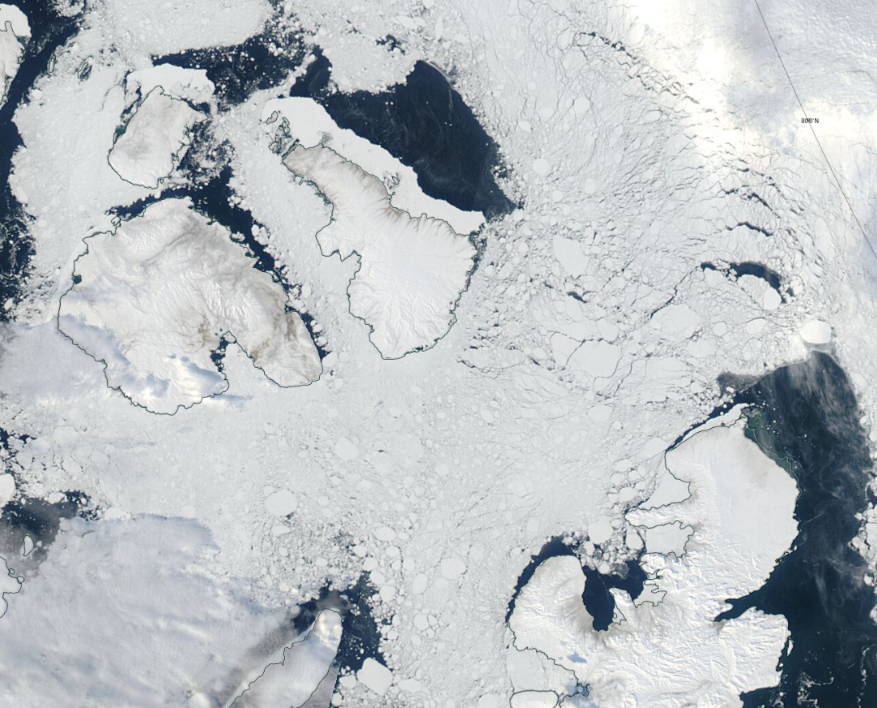
Here’s how the current “oldest, thickest ice” in the Arctic looks from on high:
It’s time to take another look at JAXA extent:
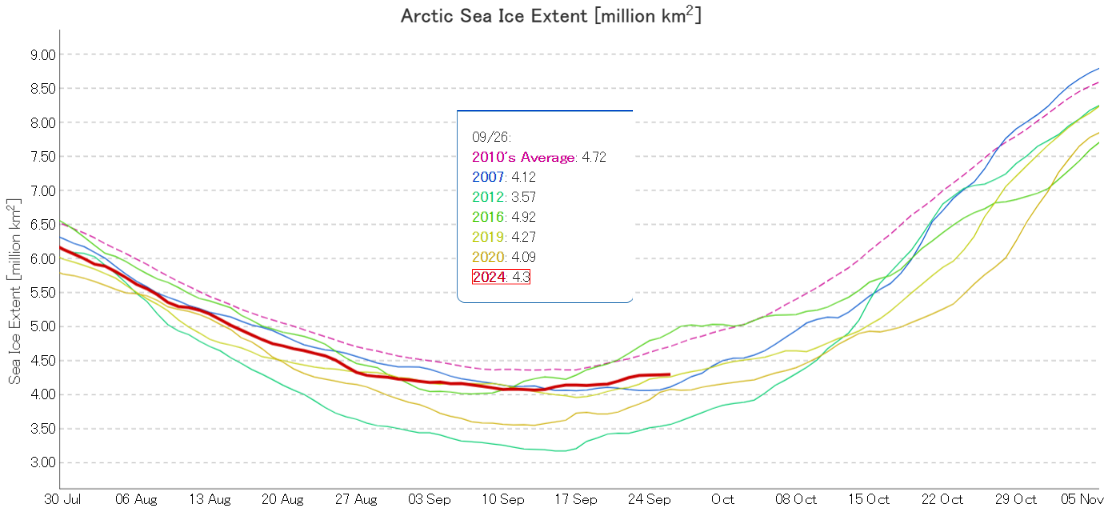
Currently it appears to be increasing in small steps, interspersed with multi-day periods that are almost flat. Extent is currently 5th lowest for the date, but if the pattern continues it will soon drop to 3rd lowest below 2007 and 2019.
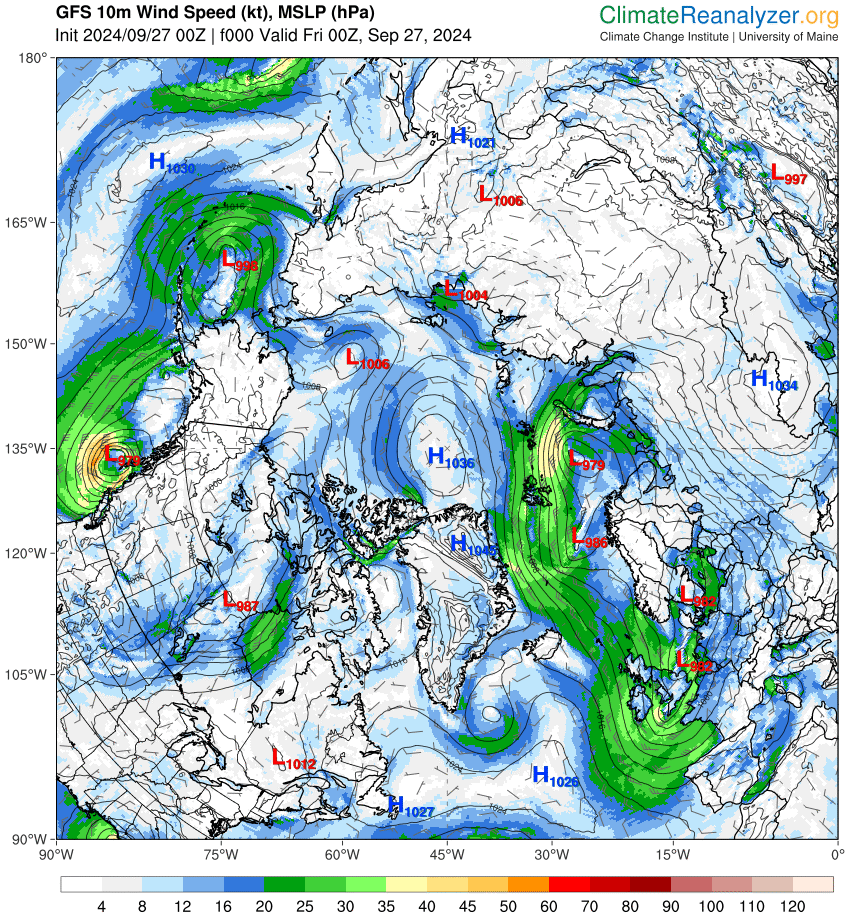
Turning next to the weather, there is currently high pressure over the central Arctic as there has been for much of September. That pattern is forecast to continue. Although there are cyclones on the periphery they cannot dislodge the high and infiltrate the Central Arctic Basin.
On the last day of September 2024 JAXA/ADS Arctic sea ice extent was 3rd lowest for the date (in the satellite era!):
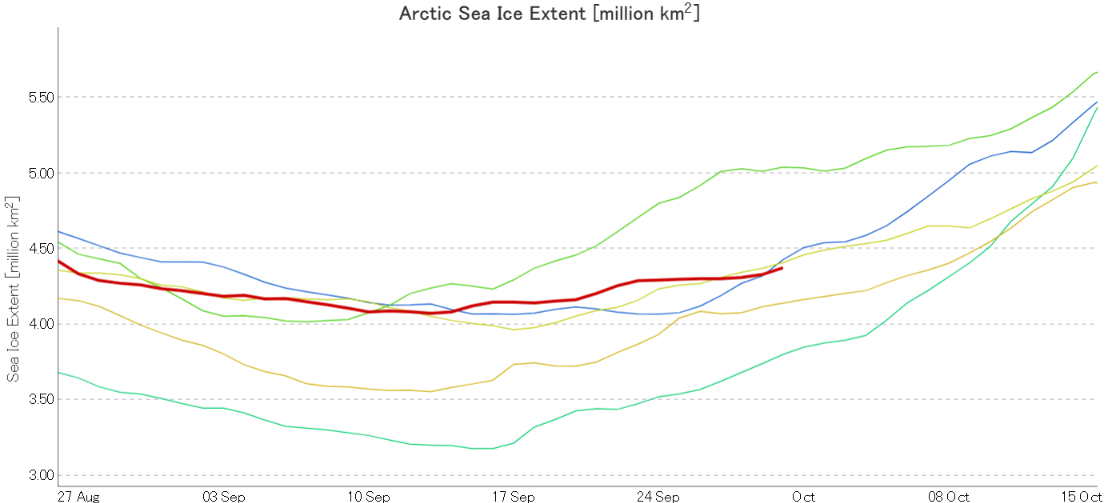
The “refreeze” has been slow so far this year. What is more the Parry Channel is still remarkably free of sea ice. The old ice that filtered through the CAA “garlic press” into Viscount Melville Sound and Barrow Strait earlier in the month has melted away to nothing:
The discussion continues over on the October open thread.
The JAXA graph shows quite clearly that Arctic ice extent has averaged about the same since 2007.
But that is off message and will not be tolerated. lol!
[Comment moved to a more appropriate thread – Mod]
Hello again Peter,
I cannot help but notice that you still haven’t answered this question:
https://GreatWhiteCon.info/2023/12/facts-about-the-arctic-in-december-2023/#comment-724331
Here’s another one for you. Can you spot the difference between Arctic sea ice age in August 2007 and in 2024, pictured above?
Of the ten lowest JAXA minimums,seven have occurred in the past ten years.
Then there are 2007, 2012 which off the charts in their time…
And the trend, Tom? I’m guessing that if “seven [of the ten lowest] have occurred in the last ten years, that if the overall trend is strongly down, then we are headed for big trouble. If it’s not down, and particularly if it’s slightly up, then maybe we are at a bottom, which would be good news.
See why such statistics don’t convey much information, but leave concern on the minds of general audiences? Or is that the point of such unidimensional stats?
As with area, it’s trending down so far, though obviously not as fast as the early 2000s when the arctic was loosing so much thicker multi year ice.
If the ice is going to recover back towards what it was, it hasn’t started yet unfortunately
As Tom pointed out, the “surprises” from the extent trend have only been on the downside:
“Surprises on the downside…”. Yes, but as your adjusted graph points out, neither of the ‘surprises’ were lately. Were those maybe a bottom? I suspect it will be a few more years before we know for sure.
Um? What??
no mention of volume when DMI said it was at record low?
I’m a trifle confused by your comment, since I’ve already mentioned both the PIOMAS and DMI flavours of volume.
thanks – I see the DMI now – yeah I wonder if the arctic sea ice forum is still trying to DMI as some kind of error. Volume leads extent. According to Hansen, the reduction of Aerosol Masking will keep the temperatures high.
Re trends, sea ice area has fairly consistently maintained a balance act around the 2.5 million sq-km mark for a considerable time period now.