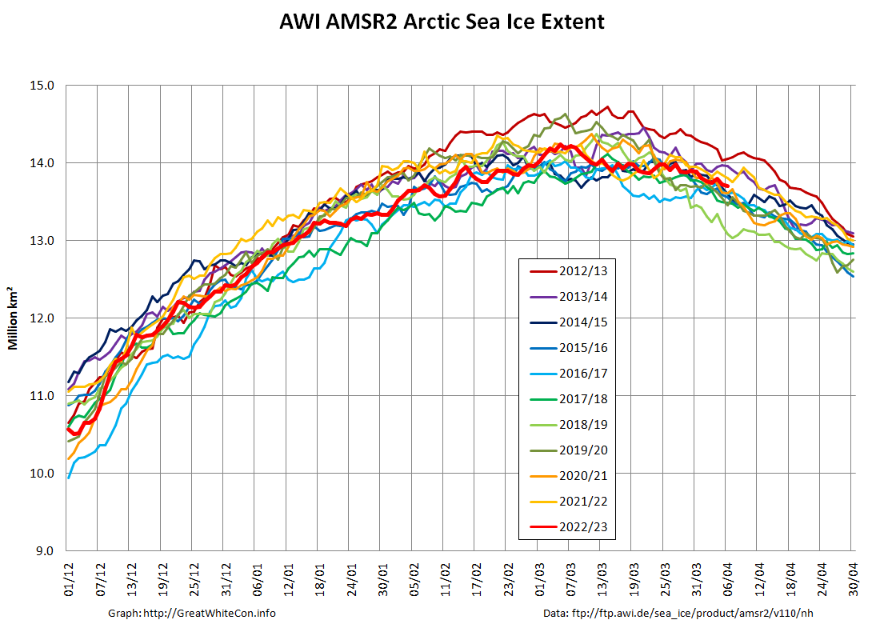
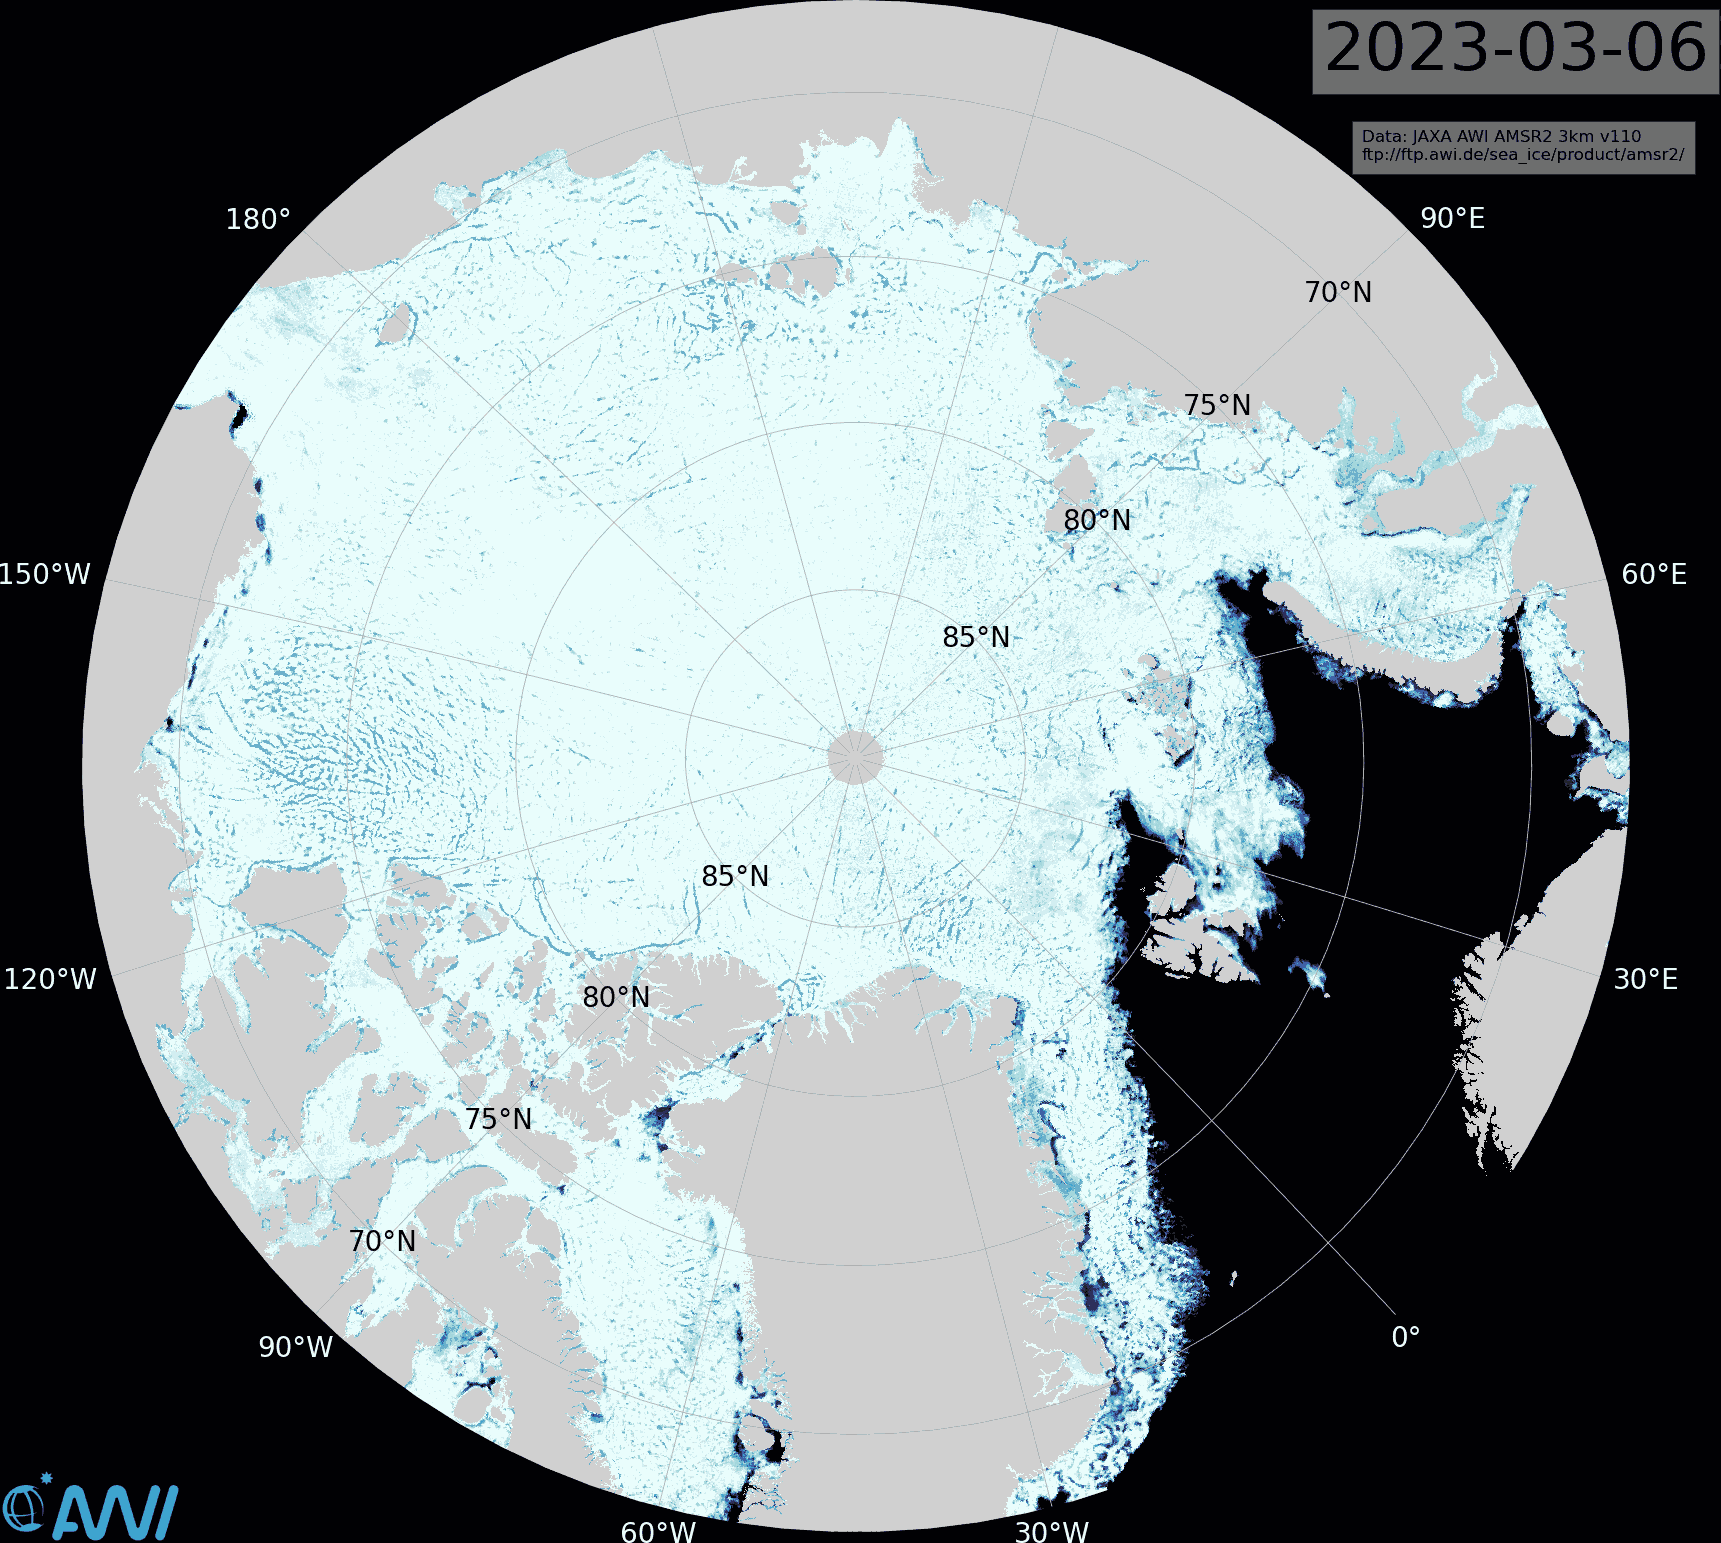
Arctic sea ice extent in early April is singularly unexceptional. Here’s the AWI AMSR2 version:
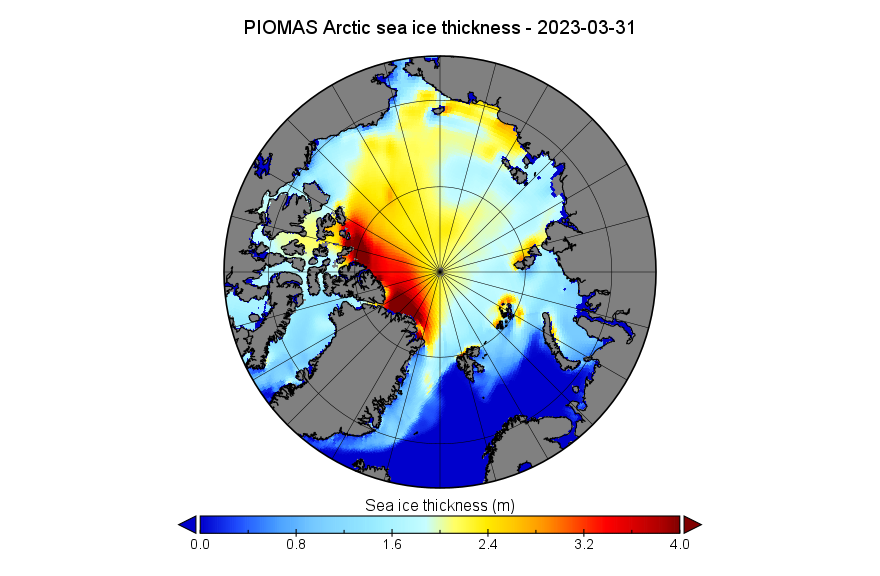
Things start to become more interesting when looking at the third dimension. Here’s the PIOMAS gridded thickness map for March 31st:
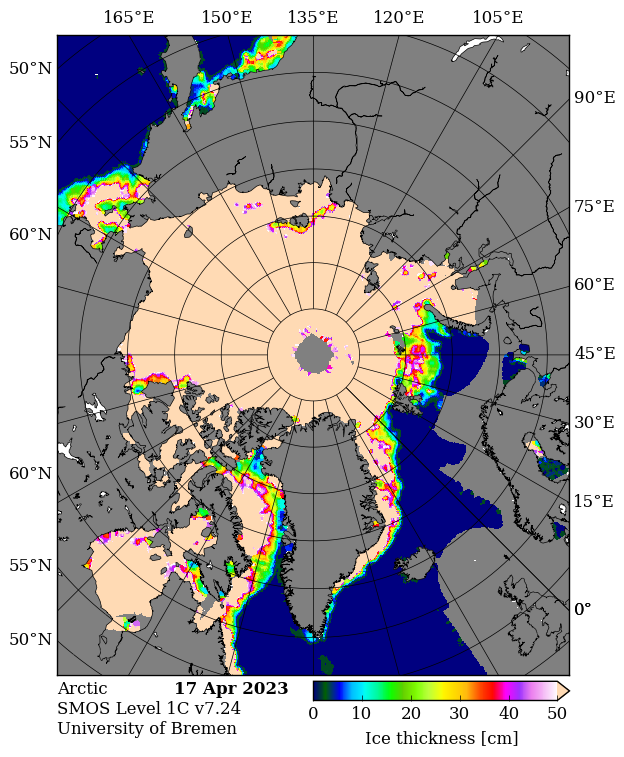
and the CryoSat-2/SMOS map for the same date:
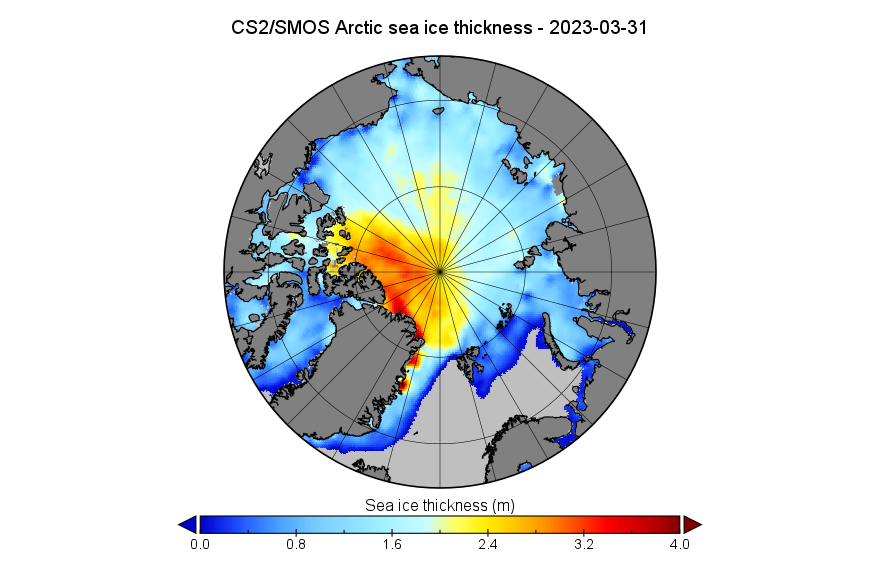
Note the differing distribution of thick ice north of Greenland and the Canadian Arctic Archipelago between the two maps. Note also the area of thinner ice along the coast of the Beaufort Sea visible on the CS2/SMOS map.
By way of explanation for that phenomenon see the March sea level pressure map from the latest edition of the NSIDC’s Arctic Sea Ice News:
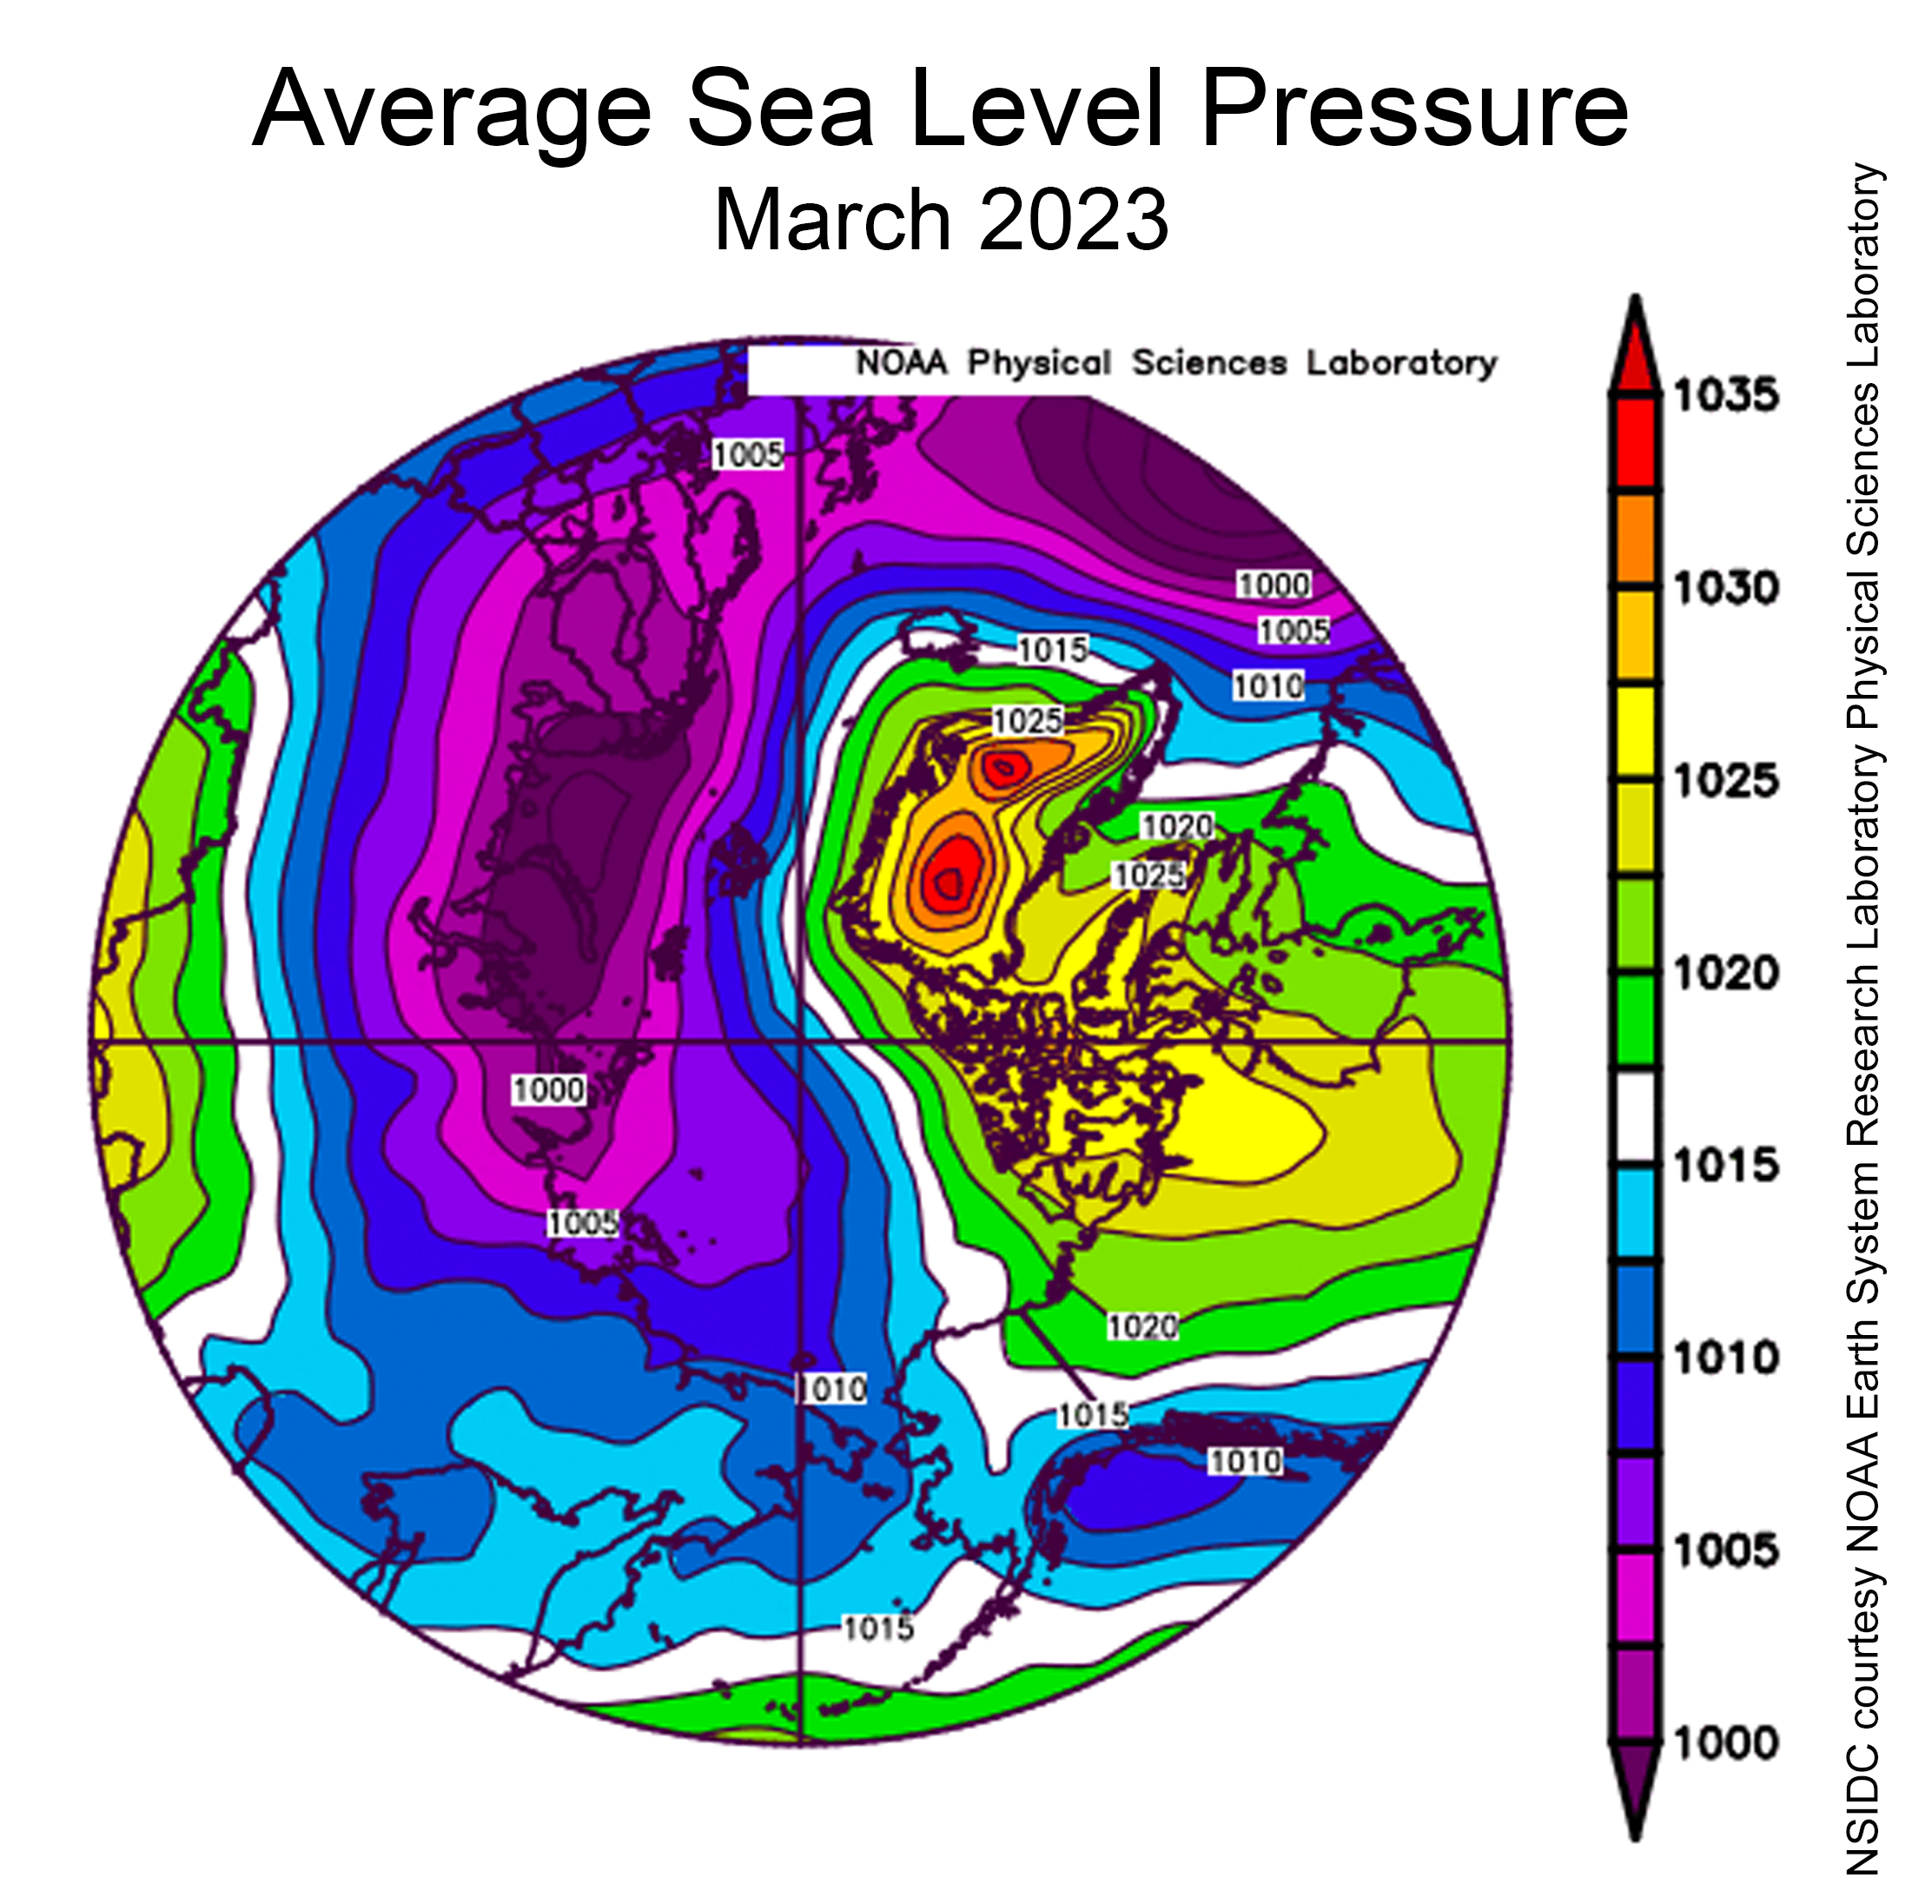
The persistent low pressure on the Siberian side of the Arctic together with high pressure over Greenland has led to significant ice drift from Alaska towards Svalbard. If you have the bandwidth for a multi megabyte download click the following image of AWI AMSR2 sea ice concentration to see an animation revealing the resulting disappearance of the area of open water north of Svalbard, and also periods of open water along the Beaufort Sea coast:
At this time of year that open water has refrozen, but another effect of the persistent ice drift is that the familiar arm of old ice in the Beaufort Sea has moved well to the north:
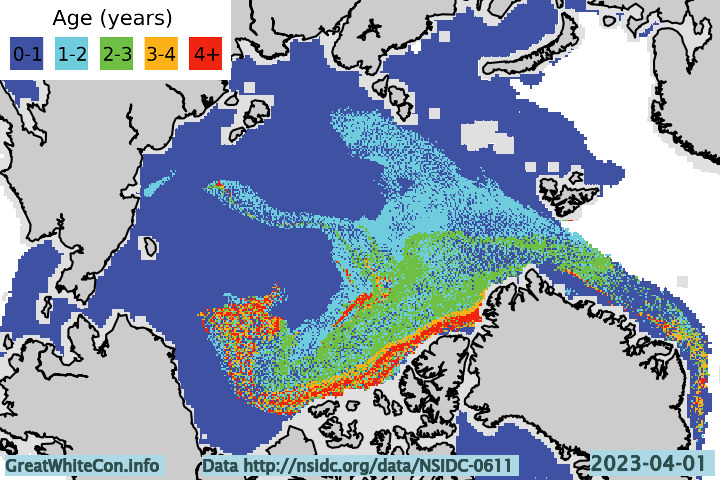
All of which suggests that this year a relatively early melt in the Beaufort Sea is likely.
The other side of the ice drift coin is that there is now plenty of old ice in the East Greenland Sea, and that regional ice extent on the Atlantic side of the Arctic is anomalously high this year:
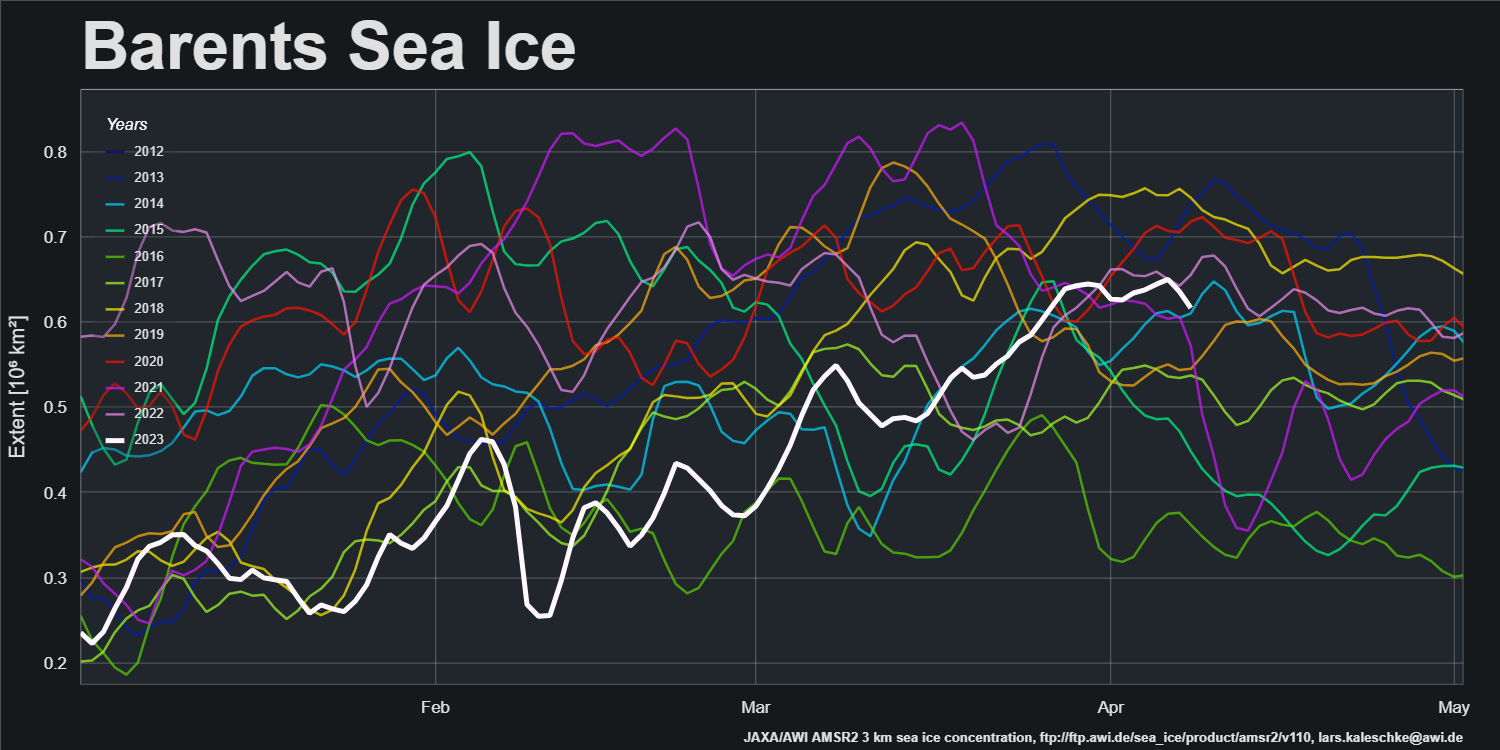
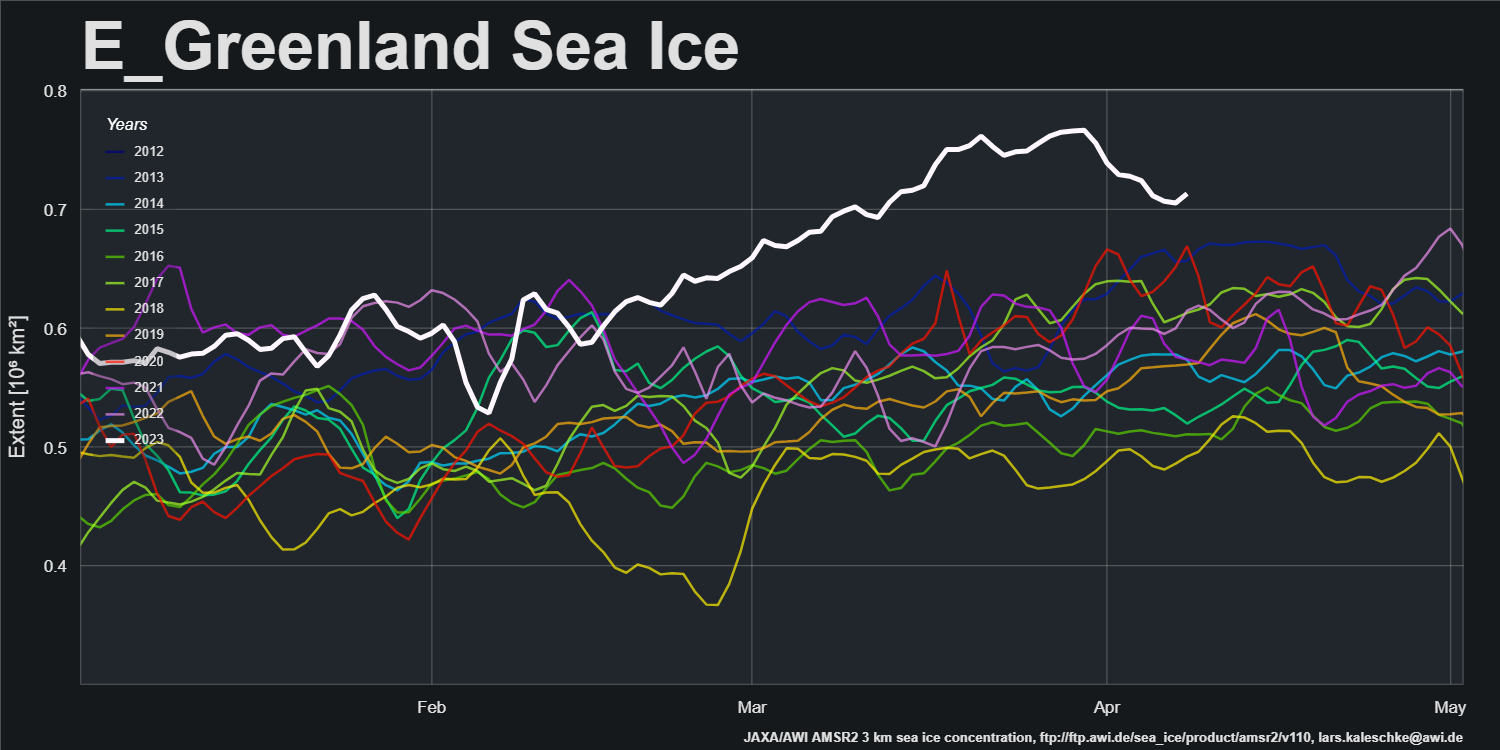
How long do you suppose it will take for all the extra ice currently heading south past the east coast of Greenland to melt?
[Edit – April 19th]The mid April PIOMAS gridded thickness data has been released. Here’s the modelled thickness map:
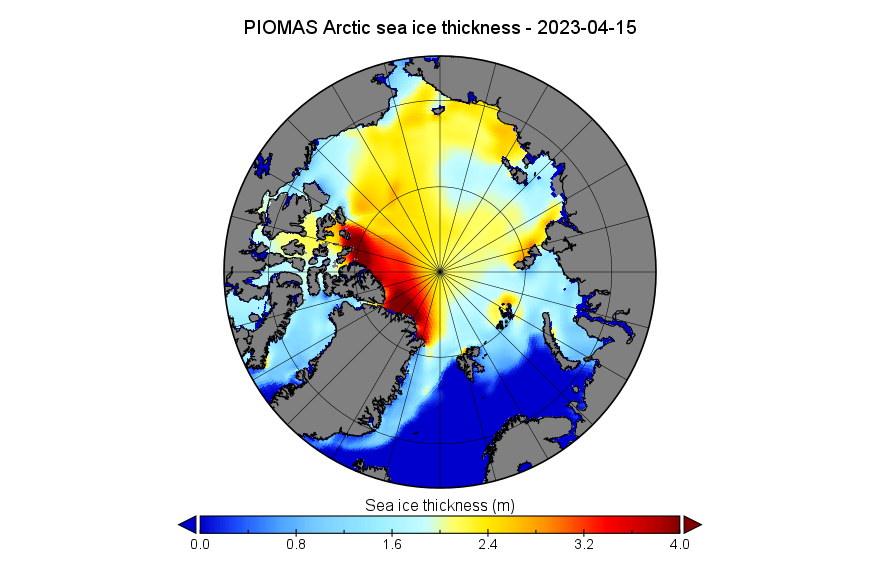
The calculated volume is still increasing, and is now 11th lowest for the data in the satellite era:
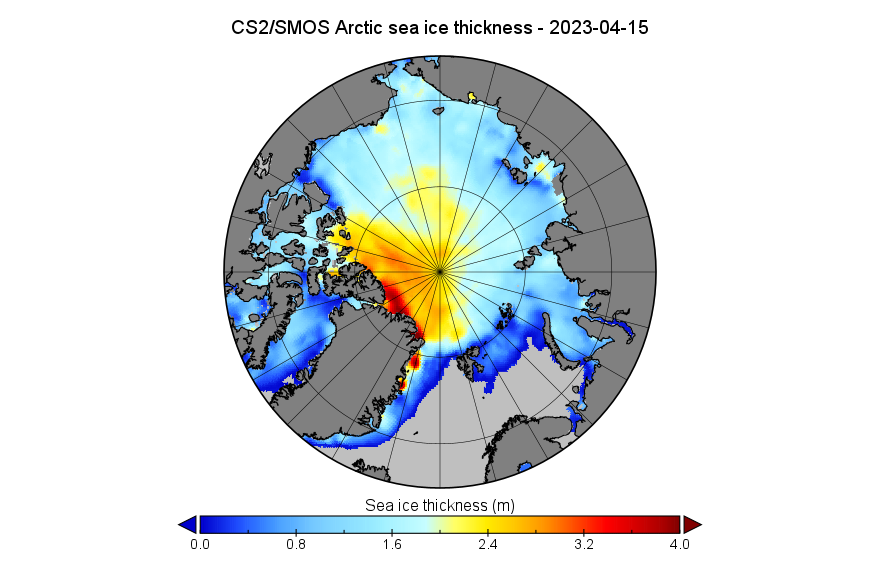
However the final near real time CryoSat-2/SMOS data of the 2022/23 season tells a different story. Here’s the thickness map:
The volume graph shows that Arctic sea ice volume is now declining:
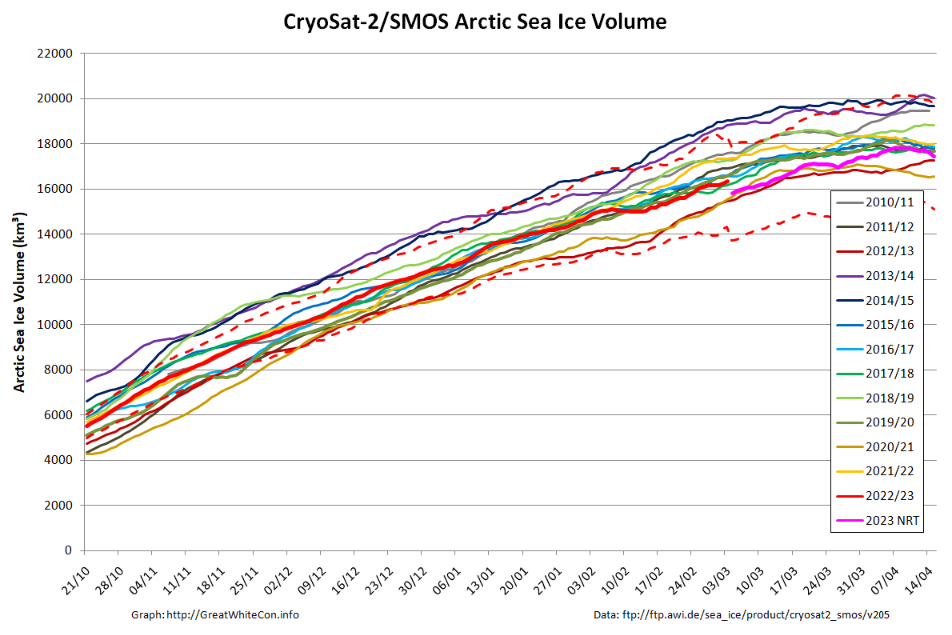
The maximum seems certain to increase when the reanalysed data is released in a few weeks time, but the NRT peak is 17,820 km3 on April 7th.
CryoSat-2 and SMOS thickness data becomes unreliable after the middle of April as melt ponds begin to form on sea ice in the Arctic, so here too is the current SMOS “thin ice thickness” map:
Note in particular the areas of thin ice in the Laptev and eastern Beaufort Seas.
The conversation has now moved to the May open thread.
Not on the topic of April, but I note with some interest that PIOMAS is now reporting that once again March ice volume ‘Shows no trend for 12 years’. They also remind us that such a short-term lack of trend highlights the importance of natural variability in masking long-term trends. Unfortunately they are silent on what natural variability factors are causing the ‘pause’ and when they might reverse. Looks like a lot of good science is yet to be done, but I see very little activity on this topic. Jim, did I miss some papers?
It’s possibly as apt to ask why the decline was so steep from 2006-2012!
Possibly because all the multiyear ice which previously made up the bulk of the sea ice, was more vulnerable to export when the Arctic sea ice declined to a certain level.
In my mind, the question is, are there any more potential tipping points ahead?
“What natural variability factors are causing the ‘pause’?”
It sounds as though you have yet to read, mark, learn, and inwardly digest Bitz & Roe (2004) and Armour, Bitz et al. (2011)?
“Did I miss some papers?”
See this month’s Arctic Sea Ice News (op. cit.) for one example:
“Regime shift in Arctic Ocean sea ice thickness”
“The multiyear ice which previously made up the bulk of the sea ice, was more vulnerable”
Here’s another extract from this month’s Arctic Sea Ice News:
“Are there any more potential tipping points ahead?”
A good question!
Jim,
Two quick comments while I dig deeper into the papers you cited:
First, as your chart shows, the % of multi- year ice (extent) hasn’t changed since the abrupt change in 2007. Not sure if that’s also true for volume, but seems significant nevertheless.
Second, if less ice volume is being exported via the Fram Strait because it’s thinner, then that would suggest a natural feedback mechanism that could lead to the accumulation of more ice volume centrally, eventually getting thick enough to start high volume flushing again. Period of that potential cycle is unclear to me, but it’s an interesting idea. Historical records would suggest similar cycles (of large-scale flushing and more open ice). I’ll do some checking, might be a paper in it…
The “natural feedback mechanism” involved is a result of the physics of “thermodynamic” sea ice thickness growth. From the abstract to Bitz & Roe:
That doesn’t “suggest a… mechanism that could lead to the accumulation of more ice volume centrally”. It does however suggest “a slowdown” in volume decline.
“Unfortunately they are silent on what natural variability factors are causing the ‘pause’ and when they might reverse.”
Only if you assume Earth year = 1 day. Most experts use the 365-day Earth year and are more careful with cherrypicking than the PIOMAS team. Why 12 years? Is it because you get 12 eggs in a pack? What happens if you do 20 or 30 years? Oh, no pause. I get it.
FrozenEarth: 12 year number by PIOMAS is not Cherry-picking, that’s how long it’s been since volume growth was negative. No growth since 2011 had been true for at least the last 18 months, as PIOMAS has faithfully been reporting. Sorry it’s bothersome for you.
And yes, 30 year trend is down. Extrapolating from that trend would have left us with a fraction of the current volume, which was the basis for my question about natural variability. Jim attempted to answer with some papers and other data, about which I will be commenting. Your comments are less useful.
Taylor, top 3 lowest years for Arctic sea ice were 2017, 2019 & 2020. Many people believe 2012 still fits here, but the facts say otherwise.
Following the 2015-16 super-el-niño we got the record low 2017 sea ice volume, as well as the (then) record low 2016 sea ice extent event.
And following the 2018-19 el-niño event, we had the 2nd lowest 2019 for sea ice volume, and the 3rd lowest 2020. 2020 was also record low for Arctic sea ice extent.
Piomas & Jaxa have graphed these sea ice records here:
http://psc.apl.uw.edu/wordpress/wp-content/uploads/schweiger/ice_volume/BannualVolumeTsCurrent.png
https://ads.nipr.ac.jp/vishop/data/SeaIceExtentGraph/graph/image/SIE_annual_n.png
PS: I believe your comment is useful to yourself, but inventing yet another pause isn’t. It may feel comfortable to do so, but as we say in the Arctic: So is wetting yourself in a blizzard.
PIOMAS may not be *strictly* cherrypicking, but they chose to begin their graph in 2011 as the ESA managed to launch their ice satellite, which is 100% unrelated to PIOMAS. So because some Europeans got their thing into orbit that year, PIOMAS justifies telling us every single month that there’s “no apparent trend over the past 12 years”, which incidentally Pause-Pushers love and adore, as it kind of props up their wonderful agenda.
But let’s assume you were right in 2017 that there has been a pause since ESA succeeded, and that you’re still right here 6 years later, then why are the 3 lowest years on record in the latter half, 2017—2022, and not in the former, 2011—2016? Strange, that.
Sorry FE,
A few of your comments went into moderation when I was otherwise engaged over the weekend. Too many links triggers a “spam” filter.
Hopefully this one makes all your points?
“Why are the the 3 lowest years in the record in the latter half…”. A better question, FrozenEarth (if that is your name) would be why, with those three years so recent, has there been a recovery such that the twelve year trend is zero?
To clarify, 2017,19&20 are the three years with the lowest 12 month rolling average ice;)
The AMO started to from its low-point in 1975.
Artic sea ice continued to fall as the AMO was rising.
The AMO reached its maximum about 2007.
I await with interest its decline which should start very soon.
Hello again Neil,
Have you seen Mann et al. (2021) yet? If not please see:
https://www.science.org/doi/10.1126/science.abc5810
You’re waiting for Godot?
Re Mann’s paper, simulation models that seem to contradict previous data and analysis should be viewed with a healthy skepticism, particularly when developed by someone with a vested interest AGAINST natural variation. I await with interest replication of Mann’s results.
The irony being that Prof. Mann claims to have constructed the AMO peg on which so many like to hang their hats:
Perhaps also worth noting that the greatest ice loss has been at the Pacific side of the Arctic, the Beaufort, Chukchi and East Siberian side, though Atlantification is a thing too.
Hi Jim,
I have seen Mann’s paper.
I’m 81 years old, Jim.
If I see out 4 score years and 10 then I hope to see a decline in AMO.
As yet I am still hoping Godot turns up in the shape of increased ice extent.
Best wishes
Neil
This one is perfect, Jim, thank you. I’d normally just post Jaxa’s & Piomas’s graphs, but in this case it was a key point that these are their own, ‘official’ graphs and not just some home-made stuff. We’re honestly not in any form of ‘Pause’, even though not every single year can be a record-breaker. Neil Degrasse-Tyson explains this perfectly, walking his dog: “Follow the man, not the dog.”
And btw, it’s only been 2 full years since we beat the all-time record for sea ice extent in the Arctic, and at the same time pushed 2012 out of the Top 3 for volume. Two non-record years in a row is no big deal, it’s what you expect.
Here’s a pseudo-colour image of the thin ice, and perhaps even open water, in the Amundsen Gulf:
Hi Jim.
I see Arctic sea ice is still around.
Regards, Matthew.
Of course it is Matt.
This is the time of year when it reaches maximum volume. See above ☝️
Hi Jim
Of cause. Now above the 2010’s average.
Regards, Matthew
Just had to check ASIF, JAXA extent is still below the 2010 average, as is the average of this decade, though it’s really a few years too early to plot a 2020s average.
Antarctica sea ice just slipped down to lowest extent on record again today, 65 days this year
Evidently you haven’t been following recent Arctic events closely Matt?
Plenty of thick ice is heading for oblivion in the far north Atlantic. It remains to be seen what happens to the ice that has replaced it.
The sky was clear over the Laptev Sea yesterday:
I took another look at SMOS, but it seems to have been suffering problems since the 17th:
2 days later the skies are clear again over the Laptev Sea:
Refreezing in places, and more open water in others. SMOS is still broken, but combined SMOS/SMAP looks (mostly) OK:
The 12-year trend isn’t zero, professor. Just like you are not really a professor.
FrozenEarth: Correct, I am not a ‘Professor’, nor ever claimed to be, but I can do simple math and logic, in which I do have some training. Re my comment about PIOMAS reporting ‘no apparent trend…’, let’s consider the possibilities:
1) the slope of the linear trend is >0 – they would report ”the trend is positive”
2) the slope of the linear trend is <0 – they would report “the trend is negative”
3) the slope of the linear trend (within error limits) is = 0 – they would report “no trend”.
See how that works? And BTW, not sure what all that about satellites and 2011 was. PIOMAS has been using their model(s) to track and report Arctic sea ice volume long before 2011. A quick look at their monthly reporting history would clearly demonstrate that. You might also try DMI. They’re not Jim’s favorite source, but they’ve been modeling volume for a long time as well and agree with PIOMAS at least WRT the trend.
PIOMAS model results since 1980:
(Jim, can I get a little help posting this?)
[Image embedded – Mod]
Hmm! Sea ice extent has just risen above 2010’s average for the first time since October 2022. What will happen in 2023?
Jan.31.—-16th.lowest. +333,064 sq.km. above 2010’s average.
Feb.28.—-11th.lowest +116,764 sq.km. above 2010’s average
Mar.31.—-10th.lowest -127,470 sq.km. BELOW 2010’s average
Apr. 30.—-14th.lowest +16,886 sq.km. above 2010’s average
May. 31.—15th lowest +395,097 sq.km. above 2010’s average
Jun. 30.—–10th.lowest +35,744 sq.km above 2010’s average
Jul. 31.—–12th lowest +228,905 sq.km. above 2010’s average
Aug.31.—-11th.lowest +203,902 sq.km. above 2010’s average
Sep.30.—-–7th lowest +115,918 sq.km. above 2010’s average
Oct.31.– 11th lowest, +269,119 sq.km. above 2010’s average
Nov30.——5th lowest, -183,803 sq.km. BELOW 2010’s average
Dec.31—–4th.lowest,-138,700 sq.km. BELOW 2010’s average
Jan.31—-2nd.lowest, -302,000 sq.km. BELOW 2010’s average
Feb.28——9th.lowest, -36,000 sq.km. BELOW 2010’s average
Mar.31—–7th.lowest, -274,000 sq.km. BELOW 2010’s average
Apr.28——13th.lowest, +57,000 sq.km. above 2010’s average
Neil, Jim would likely claim that thin refrozen ice is filling in behind the heavy export of ice and temporarily growing extent (at least WRT past years extents). On the other hand, volume seems a bit stalled as well. We’ll probably need to wait to see if volume plummets as well when the thick ice melts. I don’t have an opinion, much less a prediction, yet…
Final month end is 50,500 sq.km above 2010’s average.
What will happen in May?