By way of a change we’ll start the month of May with a closer look at one of the ice mass balance buoys deployed in the Beaufort Sea last Autumn. IMB buoy 569620 was deployed at 78.5 N, 147.0 W on September 3rd 2021, and since then it has drifted to 81.0 N, 147.7 W. Here is the buoy’s record of atmospheric conditions above the ice floe it’s embedded in since then:

Here too is the buoy’s record of the temperature of the ice floe itself, as well as the thickness of the ice and the snow layer covering it:
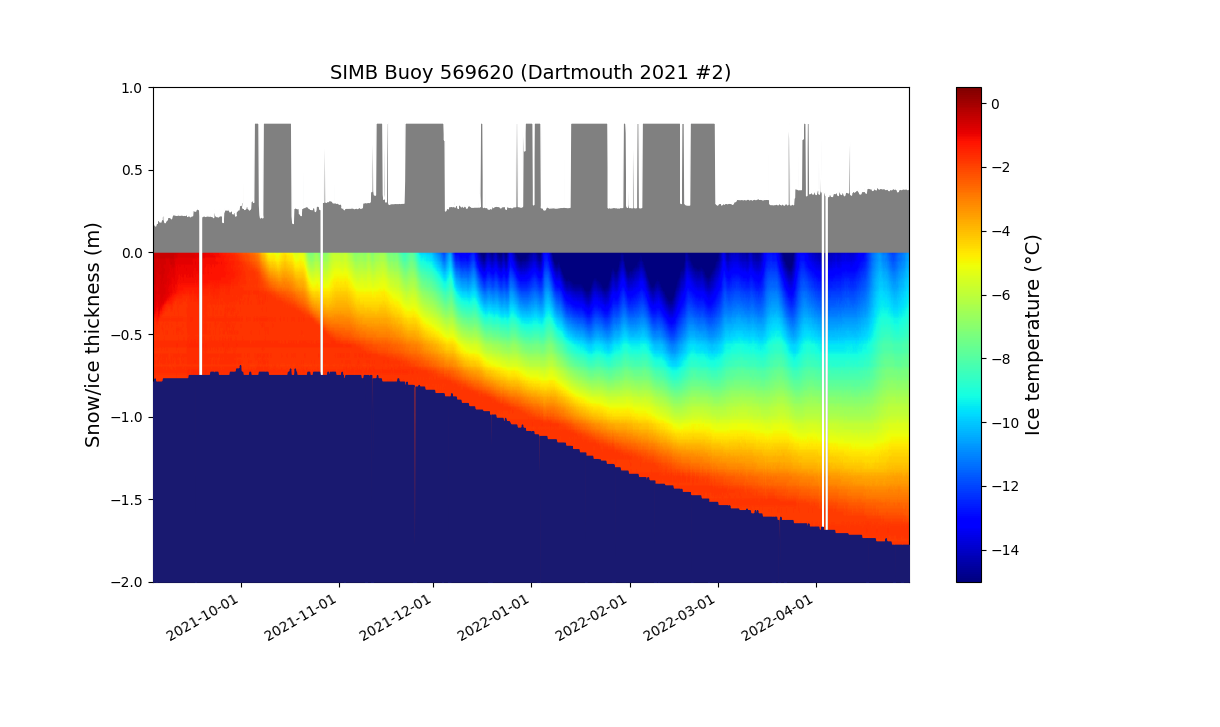
There’s a few things to note at first glance. The ice floe continued to decrease in thickness into November. It’s thickness then started to increase, but is currently still less than 2 meters. Also the snow depth has gradually been increasing, and (apart from some data glitches!) is now ~38 cm. Finally, for the moment at least, the ice surface temperature has been slowly warming since mid February and is now ~-11 °C.
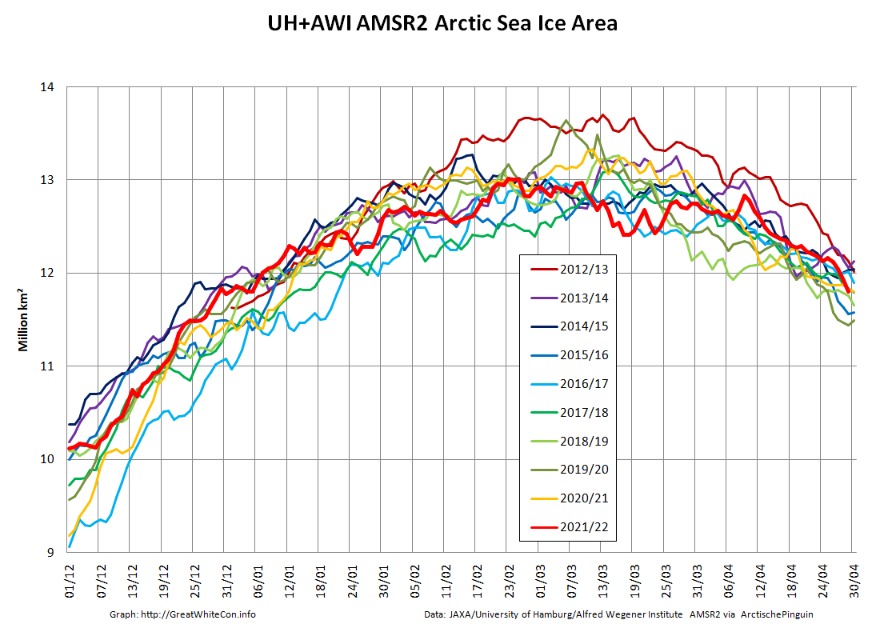
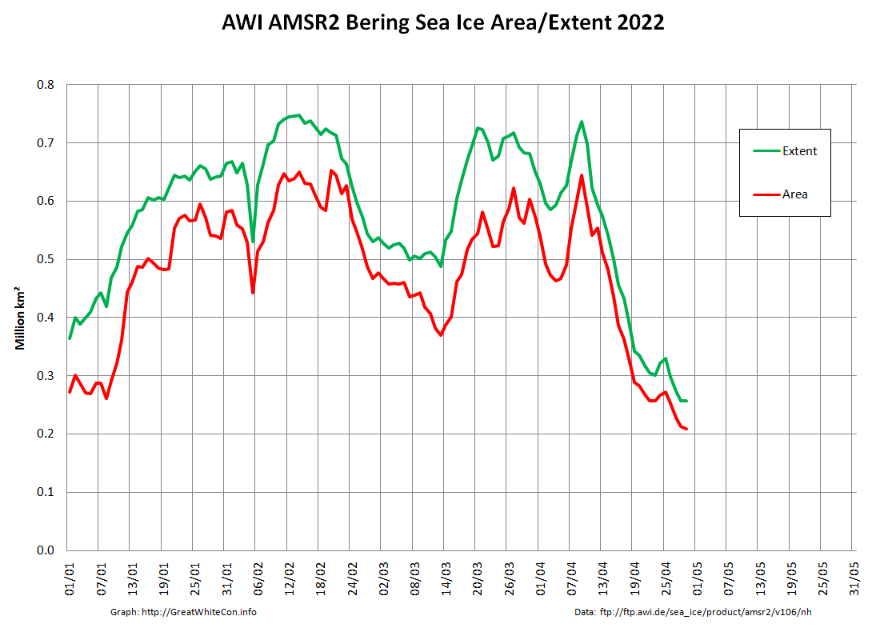
Returning to more familiar territory, high resolution AMSR2 Arctic sea ice area has taken a bit of a tumble recently:
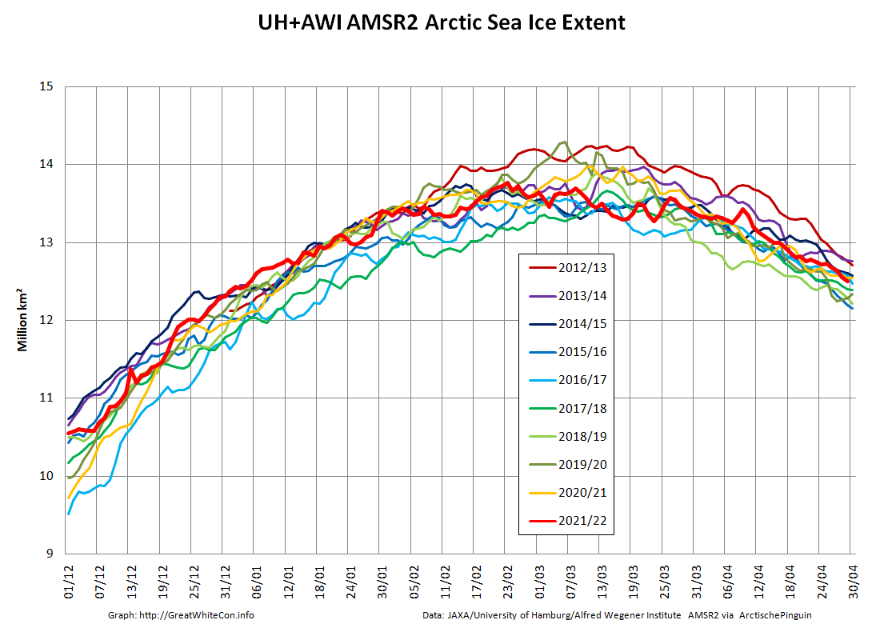
followed less steeply by extent:
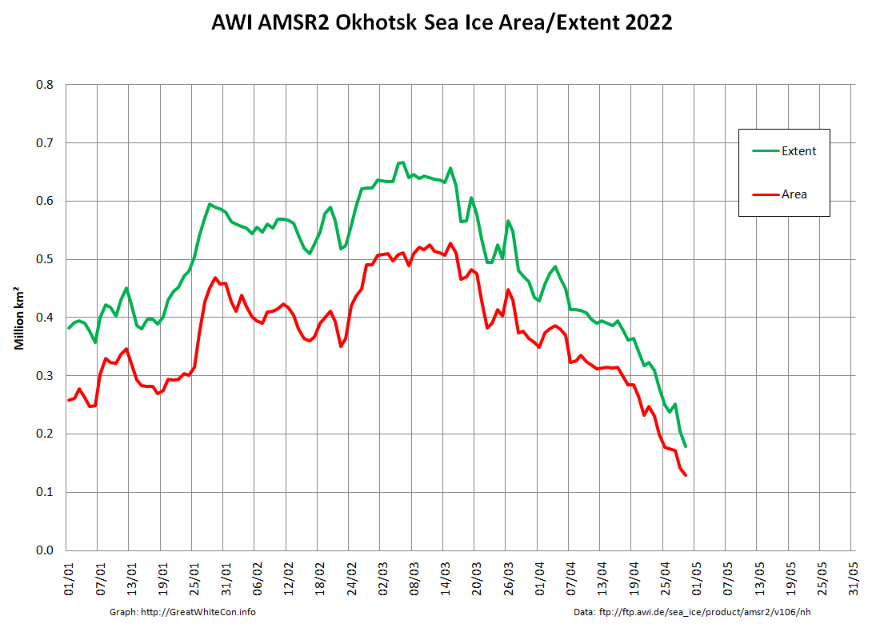
Not unexpectedly, the Pacific periphery is currently leading the decline:
The Rutgers Snow Lab has updated its northern hemisphere snow cover bar chart for April 2022:

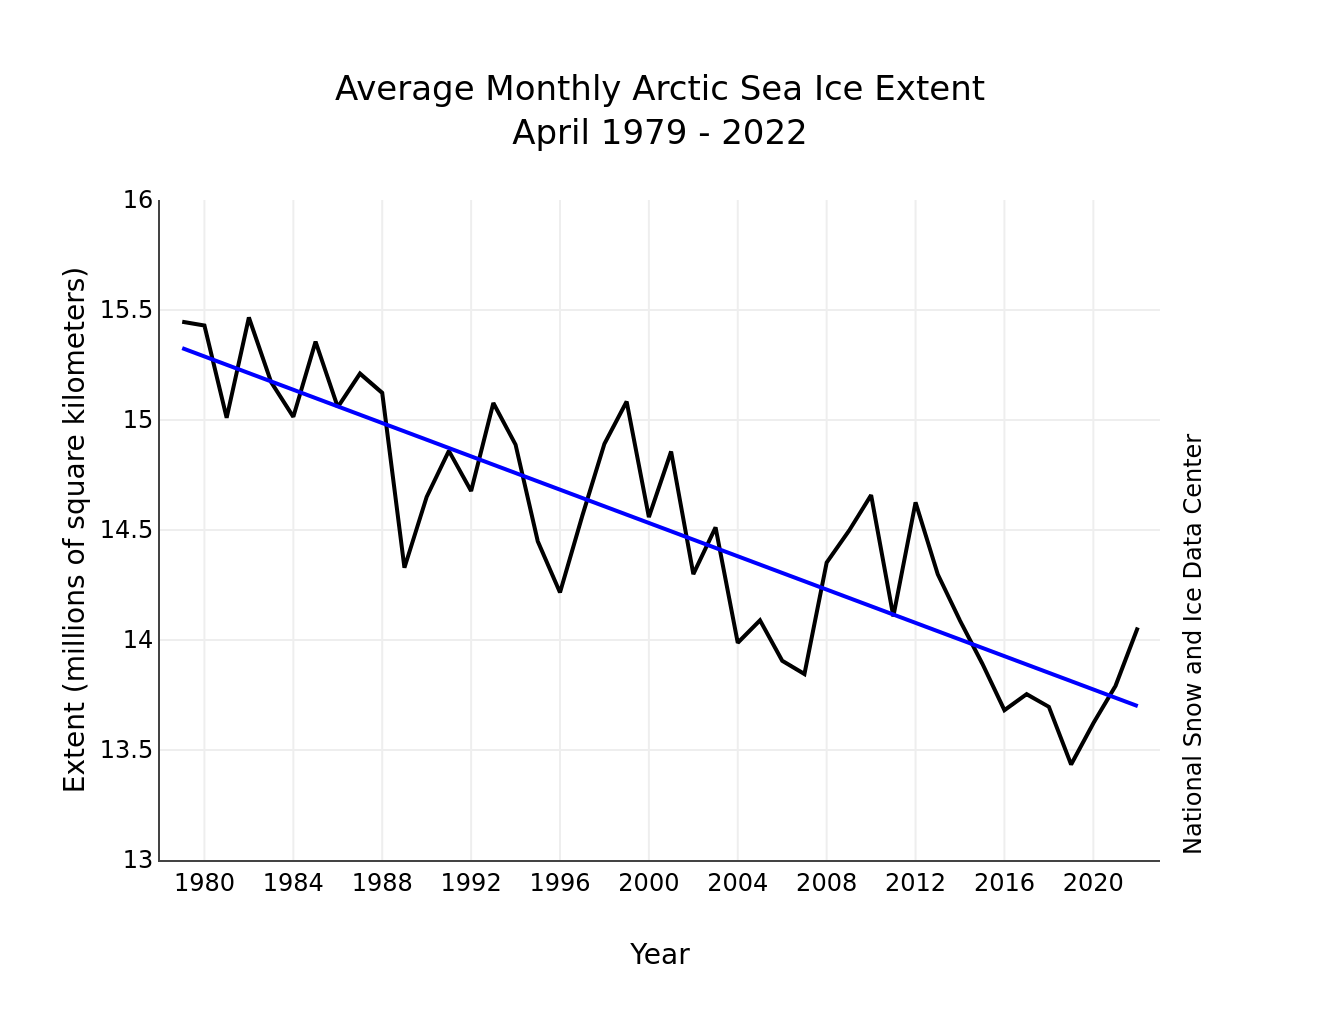
The May edition of the NSIDC’s Arctic Sea Ice News has also just been published. It summarises April 2022 as follows:
Average Arctic sea ice extent for April 2022 was 14.06 million square kilometers (5.43 million square miles). This was 630,000 square kilometers (243,000 square miles) below the 1981 to 2010 average and ranked eleventh lowest in the 44-year satellite record.
Extent declined slowly through the beginning of the month, with only 87,000 square kilometers (33,600 square miles) of ice loss between April 1 and April 10. The decline then proceeded at an average pace for this time of year through the reminder of the month.
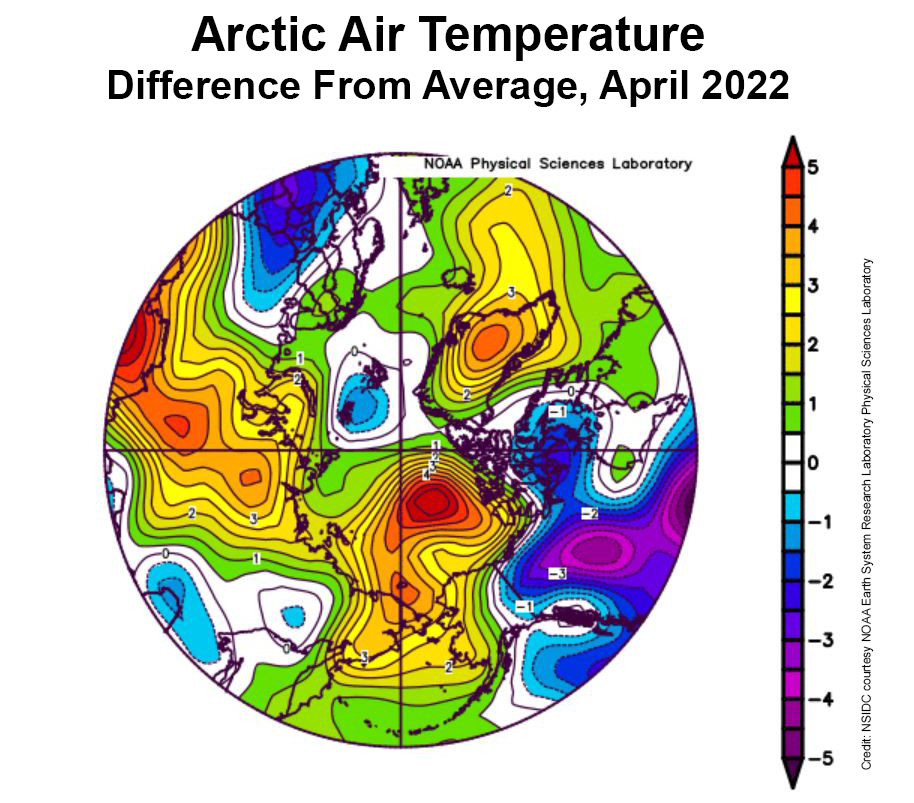
During April, temperatures at the 925 mb level (about 2,500 feet above the surface) over the Arctic Ocean were above average. Most areas were 2 to 3 degrees Celsius (4 to 5 degrees Fahrenheit) above average, but in the Beaufort Sea, April temperatures were up to 5 to 6 degrees Celsius (9 to 11 degrees Fahrenheit) above average:
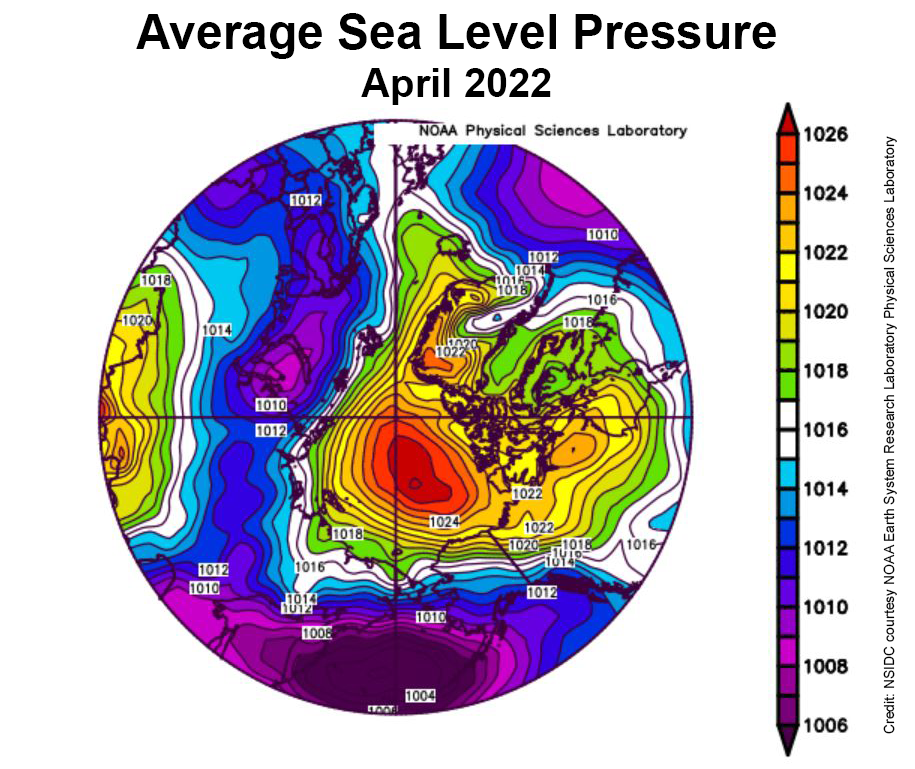
This was accompanied by a strong Beaufort High pressure cell through the month:
The NSIDC’s update also refers to the Chukchi Sea polynya we’ve been keeping an eye on here:
Strong offshore winds over the northwest coast of Alaska led to openings in the ice cover, called polynyas. The first pulse of winds began on March 21. At that time, surface air temperatures were still well below freezing, and the water in the coastal polynya quickly refroze. By April 9, the offshore push of the ice ceased and the polynya iced over completely.
However, starting on April 12, a second round of offshore wind pushed the ice away from the coast, initiating another polynya. Refreezing began anew in the open water areas, but the ice growth was noticeably slower, reflecting the higher surface air temperatures by the end of the month
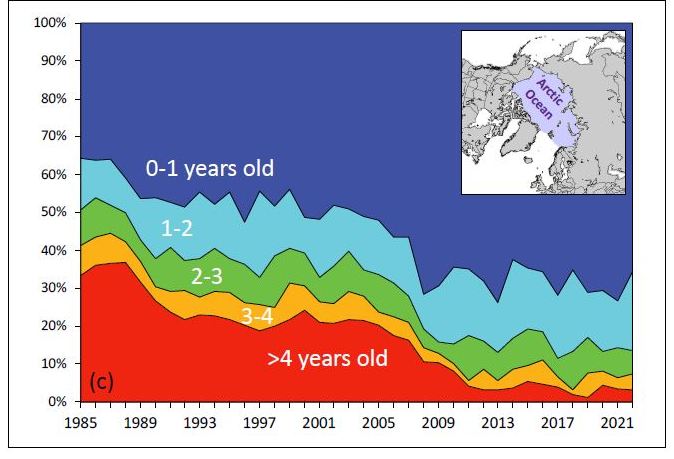
The NSIDC also updated their graph of sea ice age, on this occasion for the week of March 12th to 18th over the years:
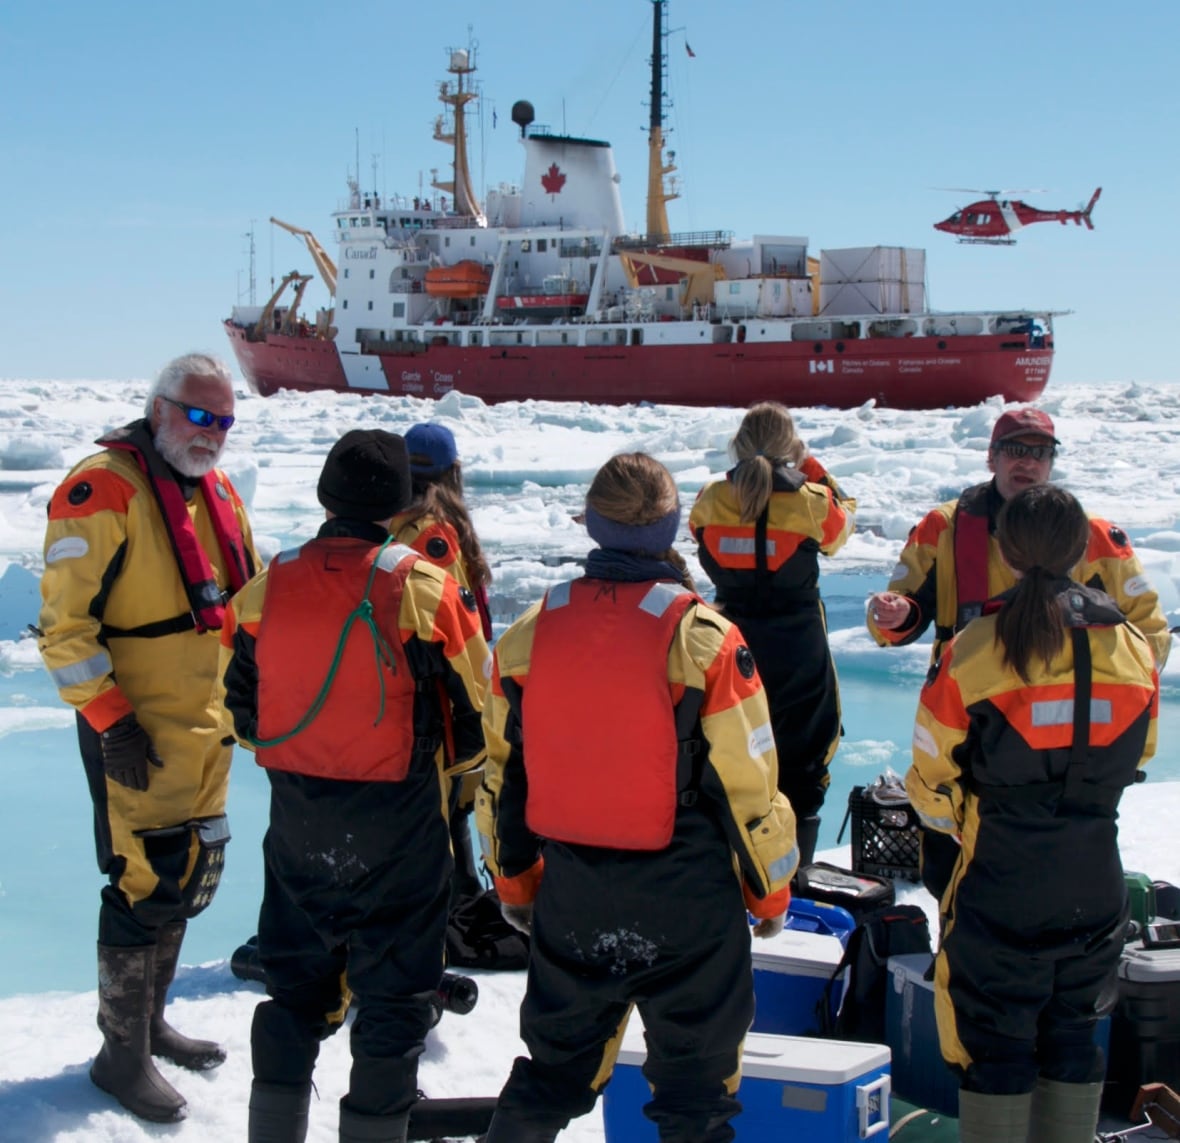
Arctic sea ice news concludes with brief news of the recent death of Canadian Arctic scientist David Barber. CBC News’s obituary for David provides more details:
Family and friends are mourning the loss of the visionary Arctic researcher and University of Manitoba professor David Barber.
Barber, who was a distinguished professor, the founding director of the Centre for Earth Observation Science and associate dean of research in the faculty of environment, earth and resource, passed away on Friday after suffering complications from cardiac arrest.
Barber, 61, is survived by his wife Lucette, three children and two grandchildren.
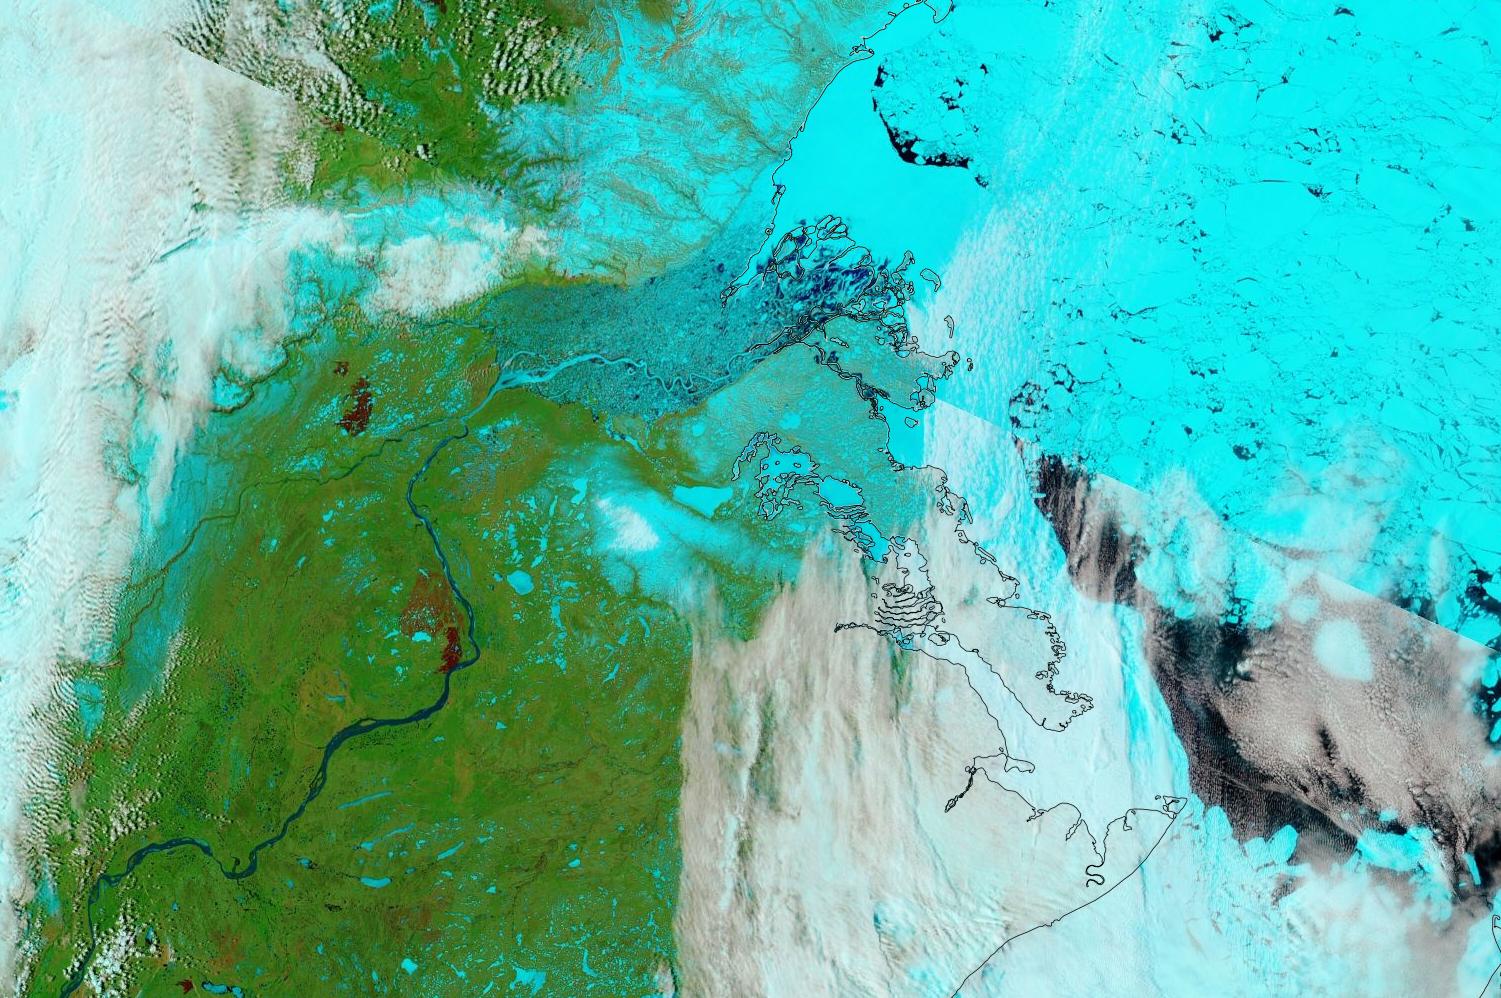
The waters of the Mackenzie River are starting to spread over the fast ice off the delta:

The Polar Science Center at the University of Washington has released the PIOMAS volume data for April 2022:
Average Arctic sea ice volume in April 2022 was 23,000 km3. This value is the 9th lowest on record for April, about 2,300 km3 above the record set in 2017. Monthly ice volume was 30% below the maximum in 1979 and 15% below the mean value for 1979-2021. Average April 2022 ice volume was 1.45 standard deviations above the 1979-2021 trend line.
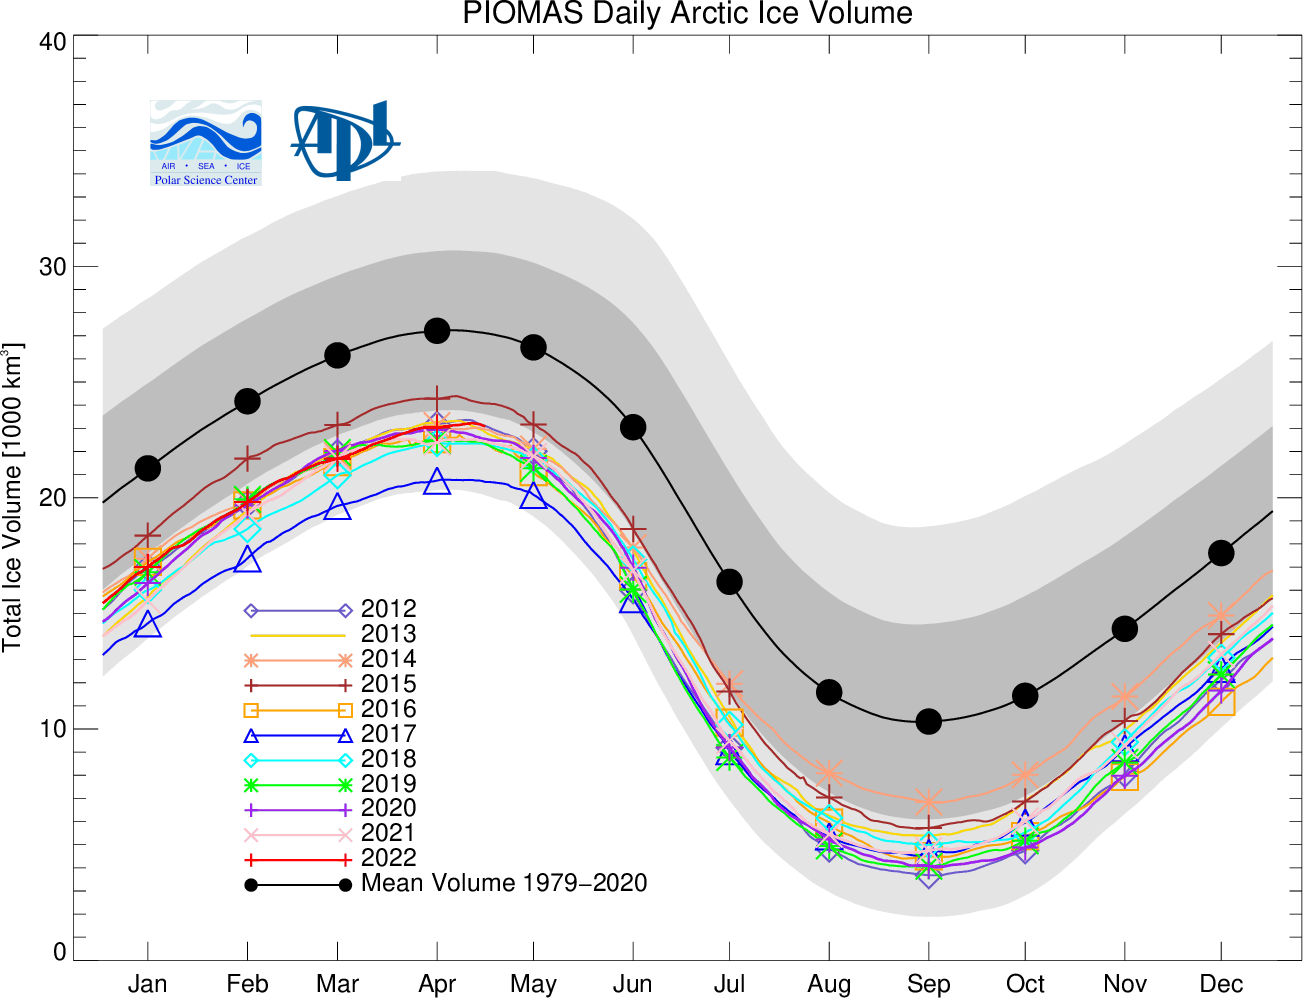
The daily volume numbers reveal the PIOMAS maximum volume for 2022 to be 23,225 km3 on April 26th.
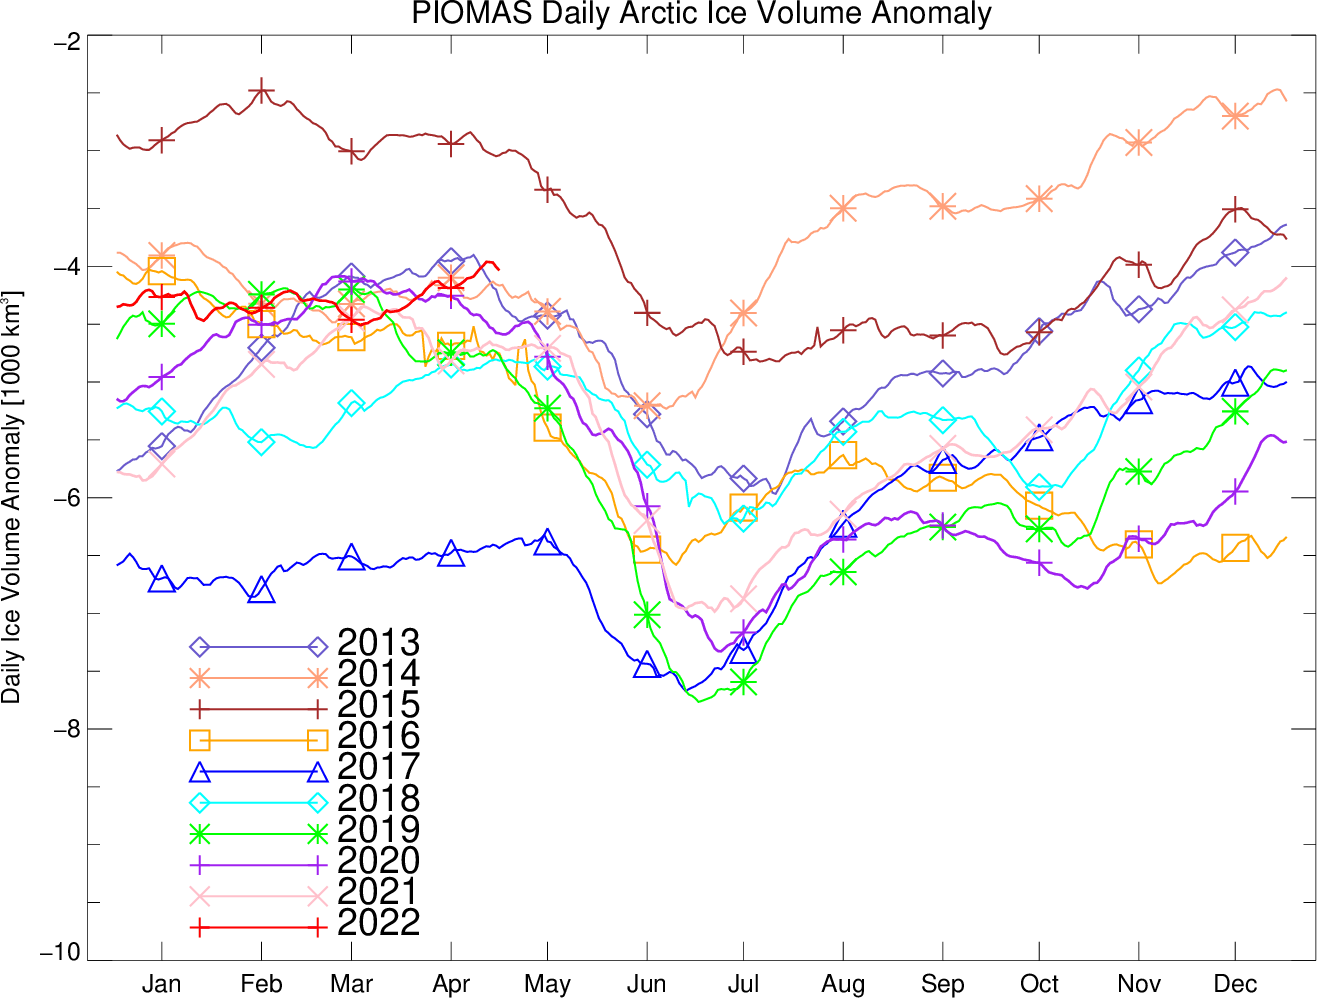
The PSC report continues:
Ice growth anomalies for April 2022 continued to be at the upper end of the most recent decade with a mean ice thickness (above 15 cm thickness) at the middle of recent values.
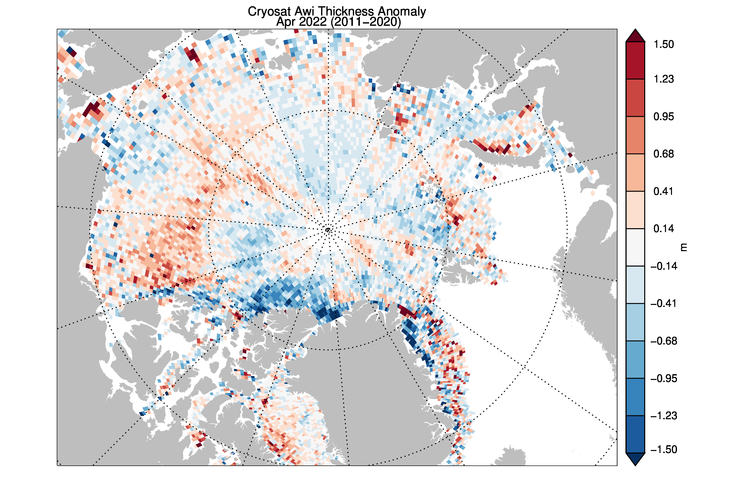
The ice thickness anomaly map for April 2022 relative to 2011-2020 divides the Arctic in two halves with positive anomalies in the “Western Arctic” but negative anomalies in “Eastern Arctic”. A narrow band of negative anomalies remains along the coast of North Greenland but a positive anomaly exists north of Baffin Island.

Note that the “positive anomaly north of Baffin Island” referred to is not apparent in the CryoSat 2 ice thickness anomaly map, although there is agreement about the thicker ice in the eastern Beaufort Sea:
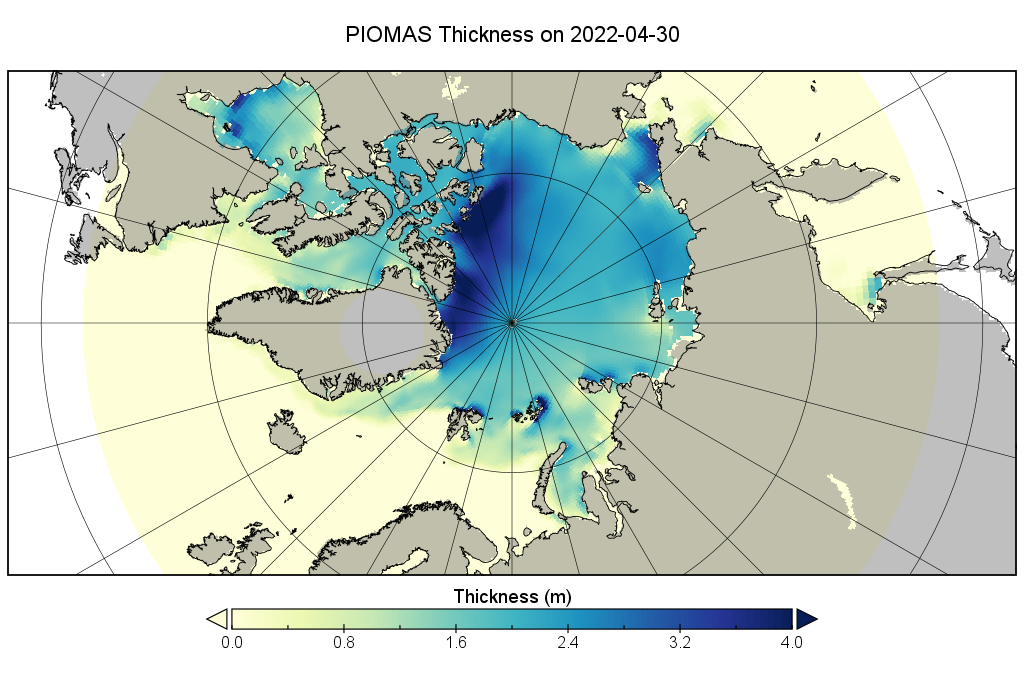
CryoSat-2 thickness maps stopped for the Summer in mid April. I’ve been hoping for mid May data from the PIOMAS team, but in vain so far. In its continuing absence here is a “work in progress” PIOMAS thickness map for the end of April:
The sea ice in Chaunskaya Bay and along the adjacent coast of the East Siberian Sea is starting to look distinctly damp:

That’s not too surprising when you also look at recent temperatures in Pevek, which have been approaching all time highs for the date:
P.S. The Mackenzie River has reappeared from under the clouds and is now largely liquid:
Some surface melt is now visible on the fast ice at Utqiaġvik:
No doubt the recent above zero temperatures are responsible, but the forecast is for colder conditions to return:

Discussion continues on the new open thread for June 2022.
Month end April sea ice extent ended above 2010’s average.
We await to see what happens in May
Jan.31st. 16th.lowest. +333,064 sq.km. above 2010’s average.
Feb.28th. 11th.lowest +116,764 sq.km. above 2010’s average
Mar.31st. 10th.lowest -127,470 sq.km. below 2010’s average
Apr. 30th.14th.lowest +16,886 sq.km. above 2010’s average
May. 2nd. 10th lowest +68,233 sq.km. above 2010’s average
Neil, Neil, Orange Peel…. when will I see you again ?
Any update from Piomas, if we have passed peak volume?
Indeed, any news if Wipneaus on ASIF will be able to do his twice monthly graphs this summer?
PIOMAS just posted, I assume Jim will follow up soon. Net, net, another ‘ordinary’ month. Volume in the middle of the recent years. Volume is nearly one and a half Standard Deviations above the long term trend, and they again report ‘no trend in volume changes in the last 11 years’. I believe that’s six straight months of “no trend in 11 years” compared to the respective month, essentially all Arctic winter. Whether this ‘Pause’ in volume will last is uncertain, but it seems significant to me, if only for the month-to-month consistency.
Quite agree Taylor.
Just updating my trend figures to May 10th.
The month end sea ice extent has remained above the 2010’s average for the past 9months except for March 2022
Jan.31st. 16th.lowest. +333,064 sq.km. above 2010’s average.
Feb.28th. 11th.lowest +116,764 sq.km. above 2010’s average
Mar.31st. 10th.lowest -127,470 sq.km. below 2010’s average
Apr. 30th.14th.lowest +16,886 sq.km. above 2010’s average
May. 10th. 13th lowest +272,000 sq.km. above 2010’s average
Not forgetting that extent at this time of year has remarkably little correlation with the September minimum. And that 2 out of the last 3 years finished up in the bottom 3:
May. 10th. 170,000 sq.km. below 2012
As the PIOMAS reports continue to point out:
Hi Jim,
Thanks for your comments. Much appreciated. Thanks also for allowing contrary views on your site.
Neil
Jim, I note that DMI temps above 80 degrees N have been below the 1958-2002 average for over 30 days now. I found a few similar periods in the last ten years, but none starting this early (April 10th approx). One must go back to 2009 to find a similar early run of low temps, and that’s the only other one this century.
I know you’re not a fan of DMI, but I wonder what significance, if any, you see in this unusual cold spell.
It’s resulted in the graph of freezing degree days being near the top of the range of recent years:
However being a bit on the cold side at the North Pole at this time of year is neither here nor there. What counts now is snow cover and open water at much lower latitudes. There are suddenly some negative anomalies in snow cover, particularly in Siberia:
Surface melt has set in on the fast ice in the Amundsen Gulf, which has started to break up:
What’s more above zero temperatures are forecast for much of the Alaskan and Siberian coasts by the weekend:
According to the PIOMAS data maximum volume was on April 26th, see above.
As yet there’s been no indication from Wipneus that he’ll be resuming his bi-monthly reports.
PIOMAS and DMI models are in close agreement on the volume peak. Looks like they have it topping out on April 30. The somewhat remarkable thing to me is the persistence of the extent in the Atlantic-facing portion of the Arctic. Both NSIDC and DMI show little, if any open water above 80 degrees on that side.
Apart from the occasional storm the ice has been consistently blown towards the Atlantic over the past month:
Jim, agree about lack
Of correlation between winter extent and summer minimum. From what I’ve read, skill window for minimum prediction is only a few months in advance of September. Do you know of any studies that have established a longer window or skill in multi-year predictions?
A skilful multi-month or multi-year prediction? No!
There is the late Andrew Slater’s 50 day “probabalistic” prediction, but that doesn’t seem to be up and running yet this year.
Just updating my trend figures to May 10th.
The month end sea ice extent has remained above the 2010’s average for the past 9months except for March 2022
Jan.31st. 16th.lowest. +333,064 sq.km. above 2010’s average.
Feb.28th. 11th.lowest +116,764 sq.km. above 2010’s average
Mar.31st. 10th.lowest -127,470 sq.km. below 2010’s average
Apr. 30th. 14th.lowest +16,886 sq.km. above 2010’s average
May. 23rd. 17th lowest +383,387 sq.km. above 2010’s average
Well, May is closing, and extent loss appears to be slower than normal for the month, per the leading sources. Above 80 degrees temps (Per DMI) continue their record run (for this century) at below normal, which implies (although I haven’t calculated it) that freezing degree days must be close to a recent record as well. DMI seems to see a recent sharp decline in volume, we’ll see what PIOMAS thinks, but all in all, a pretty average May, compared to recent years.
I wonder what that “Arctic Death Spiral” looks like just over the last 15 years or so. It’s always dramatic if you run it from the peak in 1979, but this century? Not so much.
The Sea Ice Prediction Network–Phase 2 (SIPN2) Project Team announces the Call for Contributions to the 2022 Sea Ice Outlook (SIO) June Report (based on May data).
[Added link – Mod]