September is upon us once again, the month in which the assorted Arctic sea ice area and extent metrics (almost) always reach their respective annual minima. Now we are free to start speculating about what the assorted minima will be, and on what date.
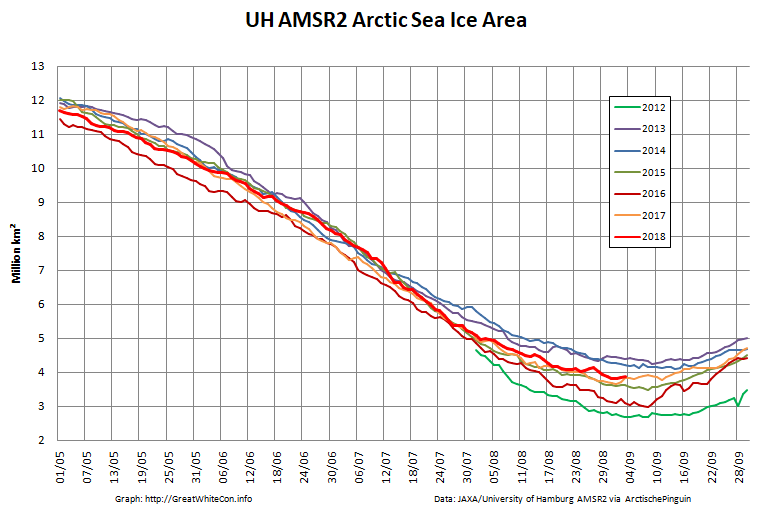
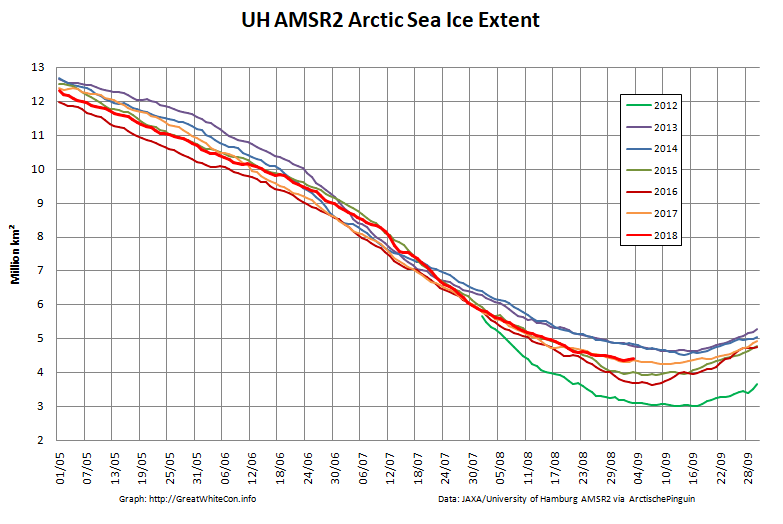
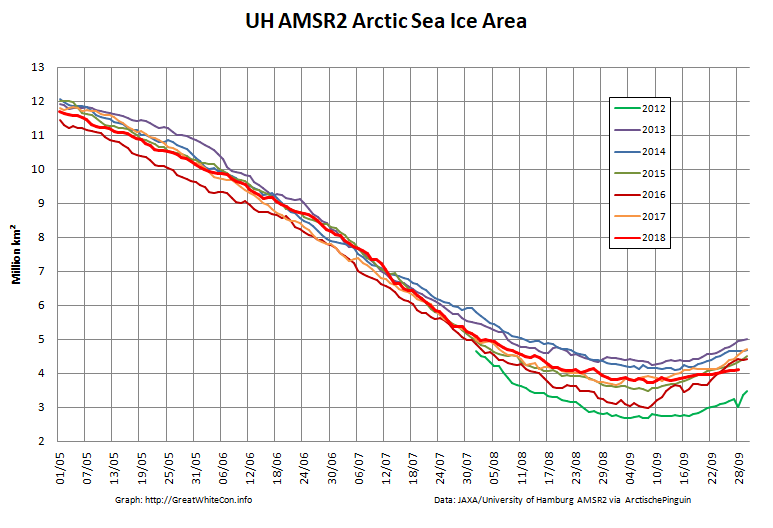
To begin with let’s take a look at our much beloved high resolution AMSR2 metrics derived by “Wipneus” from the University of Hamburg’s AMSR2 concentration data:
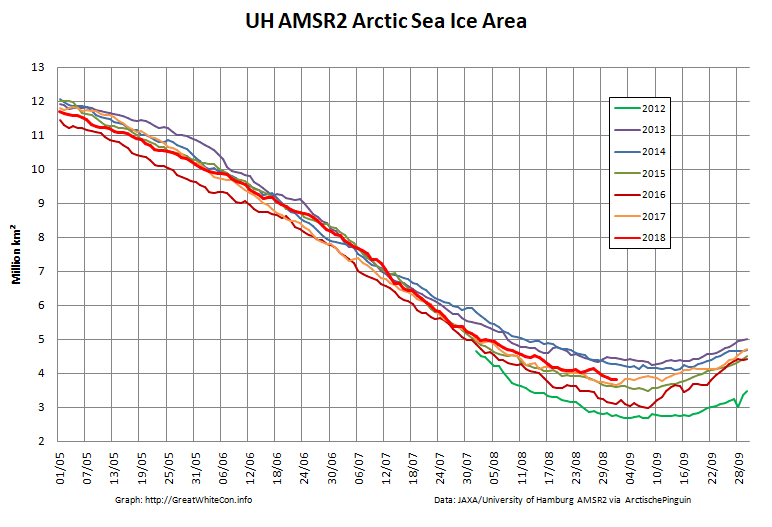
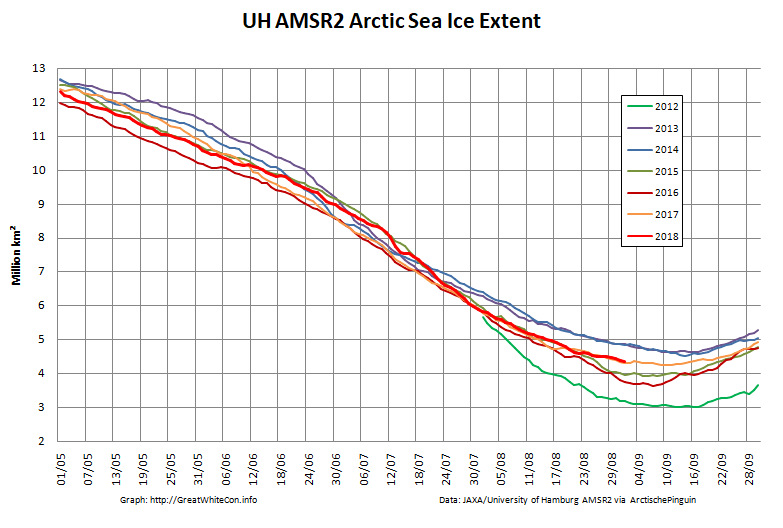
There’s currently some divergence between the area and extent graphs. Area is declining rapidly for the time of year, whilst extent seems to almost have come to a standstill!
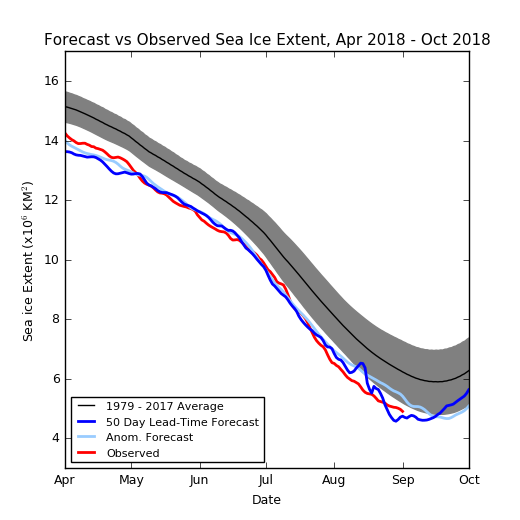
Next here’s the prediction of the late, great Andrew Slater’s Probabilistic Ice Extent algorithm:
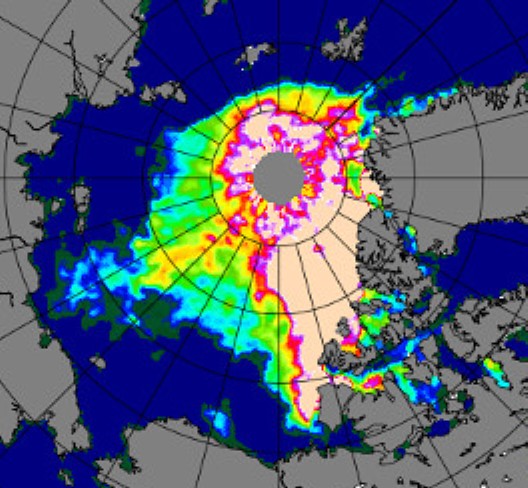
Before looking at some of the other metrics we’ll wait for the effect of the assorted storms currently circling the Arctic to play out. Here’s how the AMSR2 concentration map looks at the moment:

whilst here’s the University of Bremen’s summer SMOS sea ice “thinness” map:
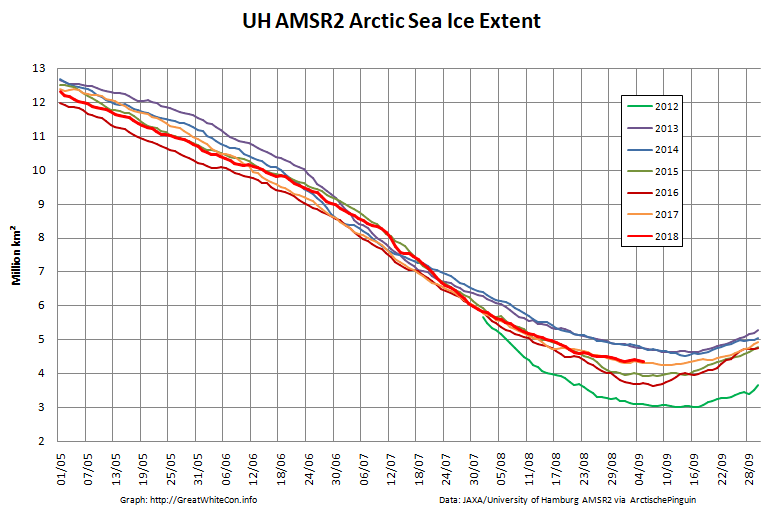
UH AMSR2 area and extent both increased yesterday, so we have a (very!) provisional minimum extent of 4.35 million square kilometres on September 1st.
Area and extent have both increased again:
Is the minimum already in, or will the storms still circulating around the Arctic Ocean reverse that trend over the next few days?
High resolution area and extent both posted marginal new lows for the year yesterday:

According to the latest edition of the NSIDC’s Arctic Sea Ice News:
On September 19 and 23, Arctic sea ice appeared to have reached its seasonal minimum extent for the year, at 4.59 million square kilometers (1.77 million square miles). This ties 2018 with 2008 and 2010 for the sixth lowest minimum extent in the nearly 40-year satellite record.
Please note that this is a preliminary announcement. Changing winds or late-season melt could still reduce the Arctic ice extent, as happened in 2005 and 2010. NSIDC scientists will release a full analysis of the Arctic melt season, and discuss the Antarctic winter sea ice growth, in early October.

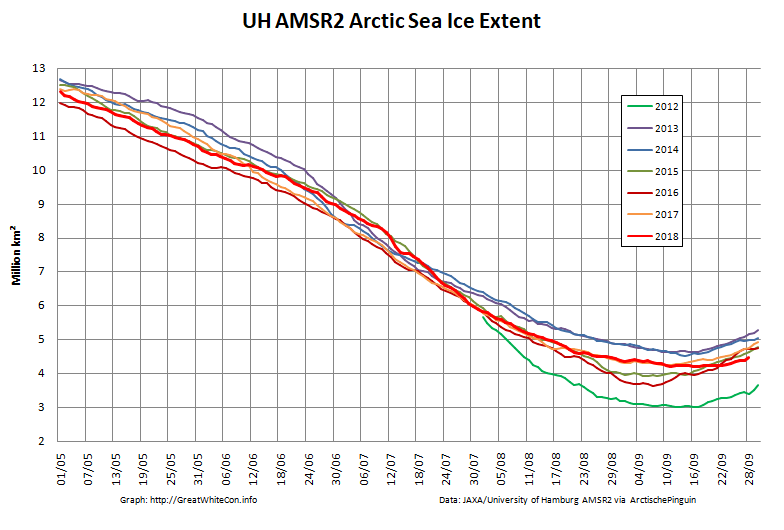
The NSIDC numbers are based on a 5 day average, whereas the one day high resolution AMSR2 extent reached a minimum of 4.195 million square kilometers on September 17th:
The AMSR2 area minimum occurred significantly earlier. 3.737 million square kilometers on September 9th:
Wipneus has performed his usual magic on the August PIOMAS gridded thickness numbers:
UH AMSR2 area and extent both increased yesterday, so we have a (very!) provisional minimum extent of 4.35 million square kilometres on September 1st.
Far too early to know. One can get a sudden sharp downturn for a few days quite quickly.
Toes and fingers crossed but no expectation. None. What will be will be.
What is the overall judgment of the situation of the ice now? Had it sort of hold well this season and what caused this?
The answer will no doubt depend on who you ask!
Given that what used to be considered as “the oldest, thickest ice in the Arctic” is no longer to be found in it’s usual hiding place north of Greenland I’d say this year is a long way from being a “holding up well” year.
I indeed meant this very relatively. Capital letters.
It’s certainly far too early to be sure!
Both area and extent dropped yesterday, but not yet to new lows for the year.
This is the beginning of the end of globull warming. The last 2 years have seen 1 trillion tons of ice accumulation on Greenland. Now the sea ice is responding to the AMO going to cold phase. Look for a massive sea ice extent increase the next 30 years. People will be dreaming of warming.
“The last 2 years have seen 1 trillion tons of ice accumulation on Greenland.”
I don’t suppose you have any evidence for that assertion do you Joe?
Here’s how the sea ice is responding, extent wise at least. Short term, according to the NSIDC:
Longer term, again according to the NSIDC:
DMI Jim, I assumed you follow Greenland SMB. 600 last year, 400 this year (ending August 31). Way above average.
First week or so of new year, already above average. Not clear calving is making much of a dent in that.
Surface mass balance doesn’t include what breaks off into the ocean though. From the DMI SMB page:
For a handle on the calving see the GRACE data, which unfortunately doesn’t run to 2018:
Jim, I assume you know that the DMI estimates calving losses of 500 Gt per year. So, when the surface mass budget increases by that amount or more, as it did in both 2016-17 and 2017-18, the Greenland ice sheet is not shrinking.
Jim, note that this portion of their page has not been updated for several years. I keep checking back to see if they will acknowledge the (nearly) unprecedented growth over the last few years and answer the calving and sublimination questions, but no luck to date.
Jim, note that this portion of their page has not been updated for several years.
That’s because the GRACE satellite died and the data was no longer available.
Phil, GRACE was operating until less than a year ago. Weren’t DMI reading the data between 2013 and 2017? Also, GRACE data for 2017 seem to indicate that, as the surface mass budget recorded almost record growth in 2016-17, so did calving, as the GRACE data appear to show the ice sheet shrinking that year. This contradicts the conclusions of both DMI and NSIDC, who both said it either didn’t shrink or grew a little. As Mark Knopfler sang, “Two men say they’re Jesus, one of them must be wrong.” So, was GRACE wrong? Or, was it DMI and NSIDC?
The Grace data on that page ended on Aug 2016 which was the last year for which the Grace data was available.
See Tedesco et al. “The cumulative ice sheet mass balance up until April 2017 (end of GRACE observations) was close to the average of the years 2003-2016.”
Jim, you asked for a dats reference in your reply to Joe above (a bit sarcastically in my judgment). I pointed you to some data – it would have been courteous to reply and acknowledge that.
Sorry, I stand corrected. Didn’t refresh the page, and therefore didn’t see your reply.
The NSIDC have published the latest edition of their Arctic Sea Ice News.
This map of 925 hPa temperature anomalies perhaps helps explain the ice still blocking the Northwest Passage?
Via the World Climate Service on Twitter:
Area in particular has taken a tumble over the last couple of days:
Extent is also at a new low for the year:
Phil, I have looked for the Tedesco paper you cryptically reference, but no luck. But, the facts are that GRACE ended its mission in October 2017, and reported data until June 2017 (not, as you say, April 2017). I still wonder: why hasn’t DMI updated their calving estimates in several years? In any case, the Greenland ice sheet grew in 2016-17 and may well have grown in 2017-18.
Here it is sorry you were unable to find it.
https://www.arctic.noaa.gov/Report-Card/Report-Card-2017/ArtMID/7798/ArticleID/697/Greenland-Ice-Sheet
The DMI GRACE data is up to date:
http://polarportal.dk/en/greenland/mass-and-height-change/#c8450