Arctic Sea Ice Area and Extent Lowest *Ever for the Date

We’ve recently been speculating about the effect on the sea ice in the Arctic of varying amounts of weather borne heat, wind and waves. The cumulative effect of all the assorted storms is that today a variety of sea ice metrics are all at their lowest ever level for the date, since their respective records began.

The JAXA/ADS extent was the first to fall below all previous years, and here’s how it looks today:

vishop_extent-20160202

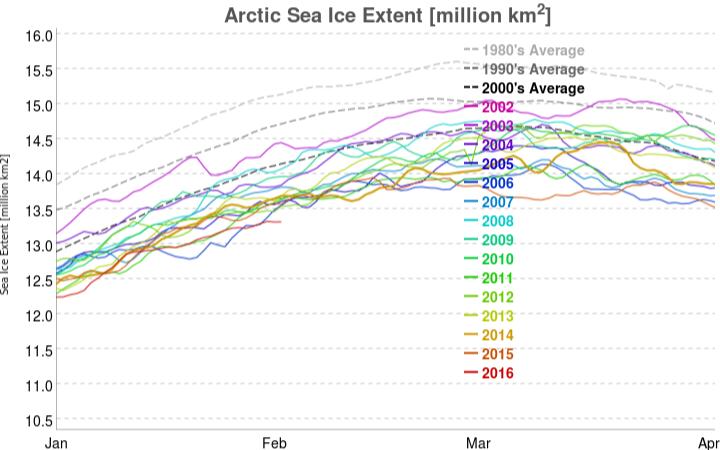
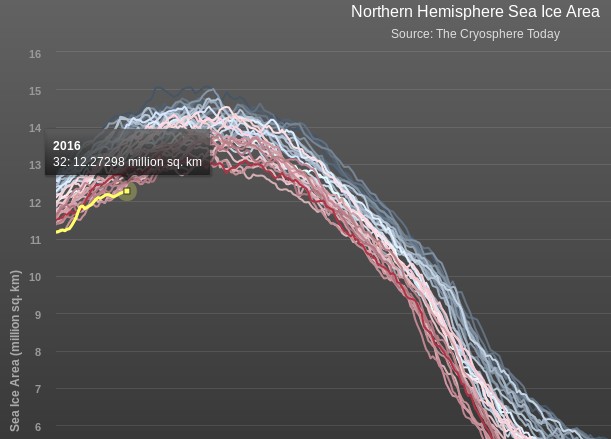
Note that it shows extent currently decreasing. Next came the Cryosphere Today area, which has also just decreased from the day before:

CT-2016-032

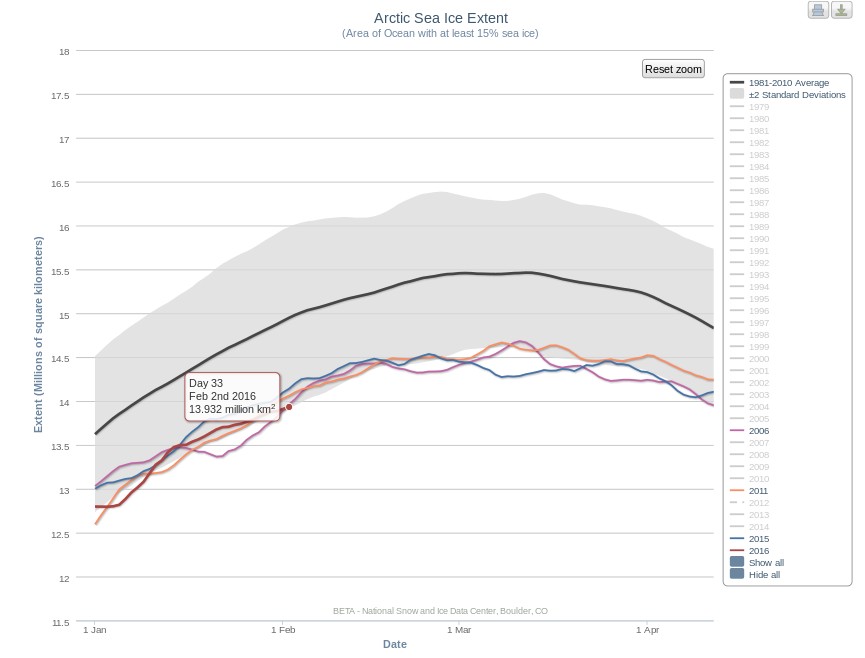
The latest metric to join the club is the 5 day averaged version of the NSIDC Arctic sea ice extent, which currently reveals:

NSIDC-20160202

Would any brave reader care to hazard a guess where and when the assorted Arctic sea ice metrics will eventually reach their maximum values for 2016?

P.S. The NSIDC average Arctic sea ice extent for January 2016 is also in the “lowest ever” club:

nsidc-2016-01

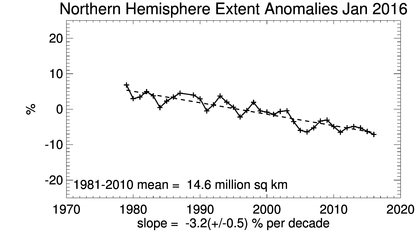
* Since satellite records began

3 thoughts on “Arctic Sea Ice Area and Extent Lowest *Ever for the Date

  1. The NSIDC have published the latest edition of Arctic Sea Ice News.

    Amongst other things they point out that:

    January Arctic sea ice extent was the lowest in the satellite record, attended by unusually high air temperatures over the Arctic Ocean and a strong negative phase of the Arctic Oscillation (AO) for the first three weeks of the month. Meanwhile in the Antarctic, this year’s extent was lower than average for January, in contrast to the record high extents in January 2015.

    Arctic sea ice extent during January averaged 13.53 million square kilometers (5.2 million square miles), which is 1.04 million square kilometers (402,000 square miles) below the 1981 to 2010 average. This was the lowest January extent in the satellite record, 90,000 square kilometers (35,000 million square miles) below the previous record January low that occurred in 2011. This was largely driven by unusually low ice coverage in the Barents Sea, Kara Sea, and the East Greenland Sea on the Atlantic side, and below average conditions in the Bering Sea and Sea of Okhotsk. Ice conditions were near average in Baffin Bay, the Labrador Sea and Hudson Bay. There was also less ice than usual in the Gulf of St. Lawrence, an important habitat for harp seals.

    January 2016 was a remarkably warm month. Air temperatures at the 925 hPa level were more than 6 degrees Celsius (13 degrees Fahrenheit) above average across most of the Arctic Ocean. These unusually high air temperatures are likely related to the behavior of the AO. While the AO was in a positive phase for most of the autumn and early winter, it turned strongly negative beginning in January. By mid-January, the index reached nearly -5 sigma or five standard deviations below average. The AO then shifted back to positive during the last week of January.

    .

  2. Another sea ice metric has joined the “lowest ever for the date” club. This time it’s the Cryosphere Today global sea ice area, which today dropped to 14.453 million square kilometres.

    That’s just a whisker away from 2006’s all time low level of 14.392 million, since CT’s records began.

  3. The favourite sea ice metric of those “skeptical” about anthropogenic climate change has been “lowest ever for the date” for a while.

    Today we bring you the news that Cryosphere Today global sea ice area fell to the “lowest ever” level since their records began in 1979, at 14.365 million square kilometres.

    Here’s a graph that includes the linear trend:

    CT-Global-2016-02-08

Leave a Reply

Your email address will not be published. Required fields are marked *

The maximum upload file size: 8 MB. You can upload: image. Links to YouTube, Facebook, Twitter and other services inserted in the comment text will be automatically embedded. Drop files here

This site uses Akismet to reduce spam. Learn how your comment data is processed.