The pseudonymous “Steve Goddard” proudly proclaims this morning that “Arctic Sea Ice Continues To Track 2005/2006“. Tony Heller states:
Experts say that the Arctic is in a “death spiral” – but for the past two years it has been tracking 2005/2006 – the years with the two highest summer extents of the past decade.
For the past four years, summer melt season temperatures in the Arctic have been well below normal.
No matter how many times experts lie about it, the Arctic is not melting down.
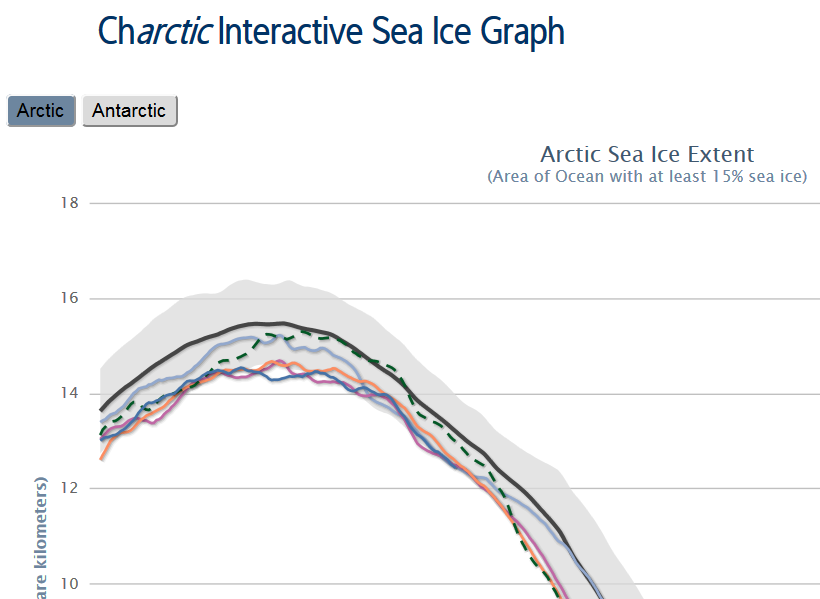
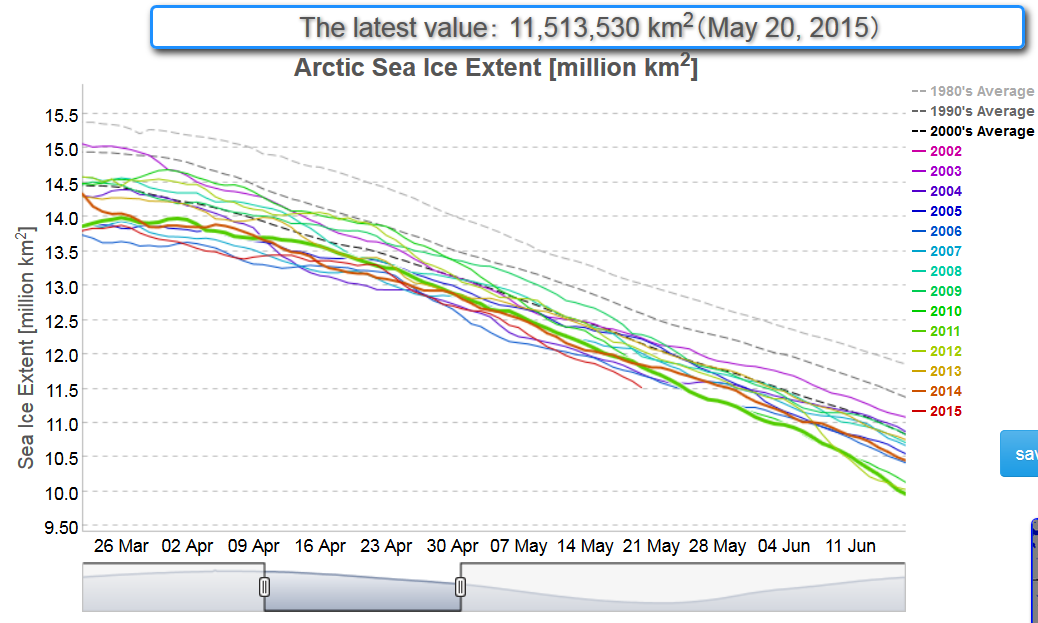
The Arctic, of course, has other ideas and continues to fail to conform to the narrative over at (un)Real Science. Today the NSIDC 5 day average extent Arctic sea ice extent is in actual fact at the lowest level for the time of year since their records began:
In view of “Steve”/Tony’s headline you may find it surprising that so is his much beloved DMI 30% threshold extent extent metric (displayed in full):
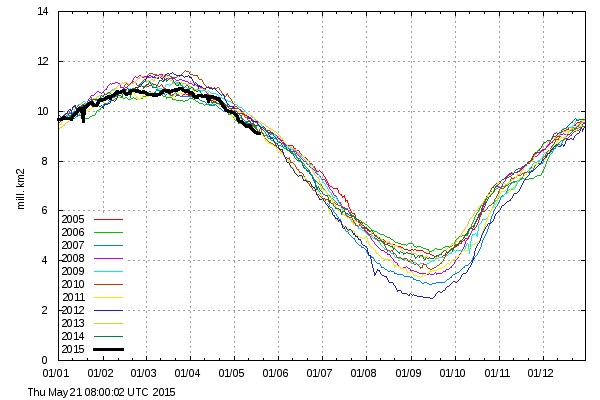
and so is the JAXA 15% extent extent:
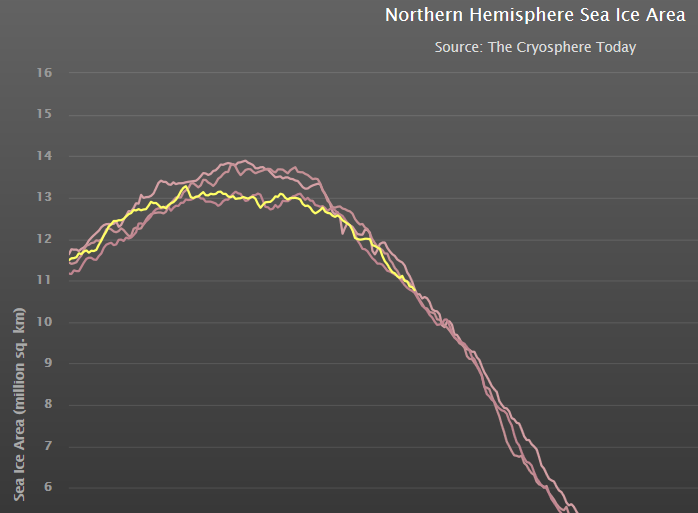
Holding out by the merest whisker (for the moment) is the Cryosphere Today area metric, which is nonetheless lower than on the same day in both 2005 and 2006:
Quod Erat Demonstrandum?
[Edit – May 23rd 2015]
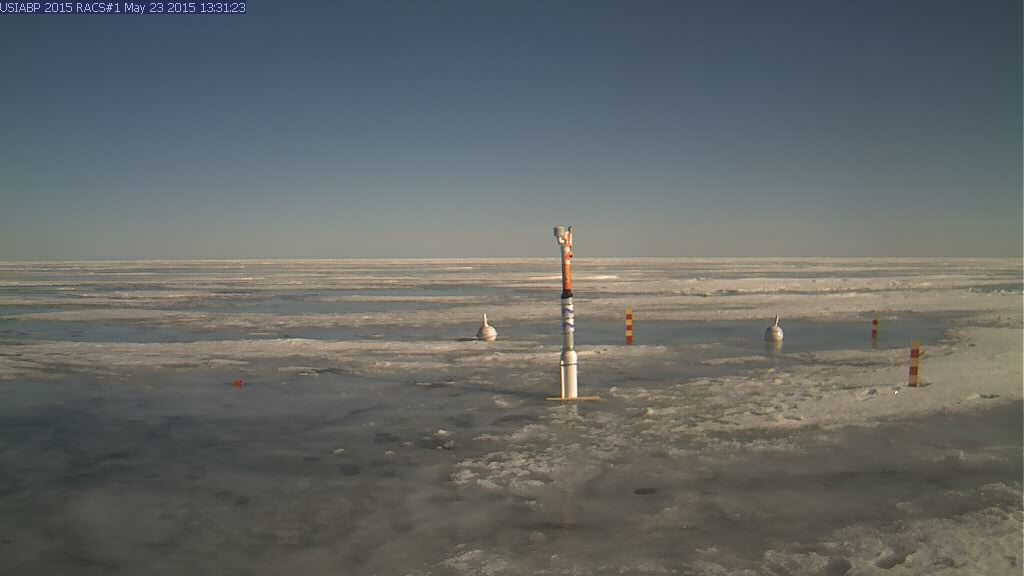
After being used by a polar bear to inspect its feet, the webcam trained on ice mass balance buoy 2015A is now pointing in the right direction again. It reveals that the Arctic is in fact “melting down” even as “Steve”/Tony maintains that it isn’t:
As if further proof were needed, the DMI 15% threshold extent graph extent is also now clearly lower than previous years at this time:
Why am I not surprised?…
Thank you very much for the information. Great job!
” You can fool some people sometimes,
but you can’t fool all the people all the time.”
Bob Marley
where will it be in a week or two jim , higher or lower than 2013 and 2014 😉 you boys need to keep your powder dry . have a word with wipneus over on the arctic sea ice forum,he seems to know his stuff 🙂
I have had numerous words with Wipneus. For an example of one outcome see:
https://greatWhiteCon.info/resources/antarctic-sea-ice-graphs/
Rest assured that if “Steve” continues to spout nonsense I reserve the right to continue to pontificate about it.
so where do you see the area heading in the next two weeks jim ? one thing for sure it will be an interesting melt season ,much different start than the last two years ,so an opportunity to learn some more for the people studying the arctic.
will be interesting to see what happens with the north west passage this year , i imagine there will be plenty people attempting it again this year . would be nice to see the people that have made the effort the last couple of years get the chance to make it through ,it is one of the big challenges that remain for serious sailors.
I agree it’s going to be interesting! Thus far the Beaufort and Kara Seas show more melt than last year. The reverse is true in the Laptev & ESS.
More anomalously warm temperatures are forecast, and I certainly don’t see 2015 tracking 2005/6 in the next 2 weeks!
Amongst all the yachts Anne Quéméré will be having another crack at kayaking through the Northwest passage west to east. I hope she manages to progress further than last year!
http://www.anne-quemere.com/?lang=en
You guys are cherrypicking just as you claim Goddard is…
Goddard’s main claim is that Arctic Ice is NOT in a Death Spiral… contrary to all the predictions from “Experts” out there… @GreatWhite.. even your own chart titled “Arctic Sea Ice Extent” shows today’s Arctic Ice extent down about 5% from the entire 1979 thru today Average!!
Next… clearly anyone with a pinch of honesty knows 79′-80′ was very cold and a recent high point for Arctic Ice… thus baselining at those years is another Cherry Pick..
Get real guys… quit claiming BS… then responding with it..
Hi Phil,
I am honoured! Taking your questions one at a time:
1) Which “experts” are you thinking of?
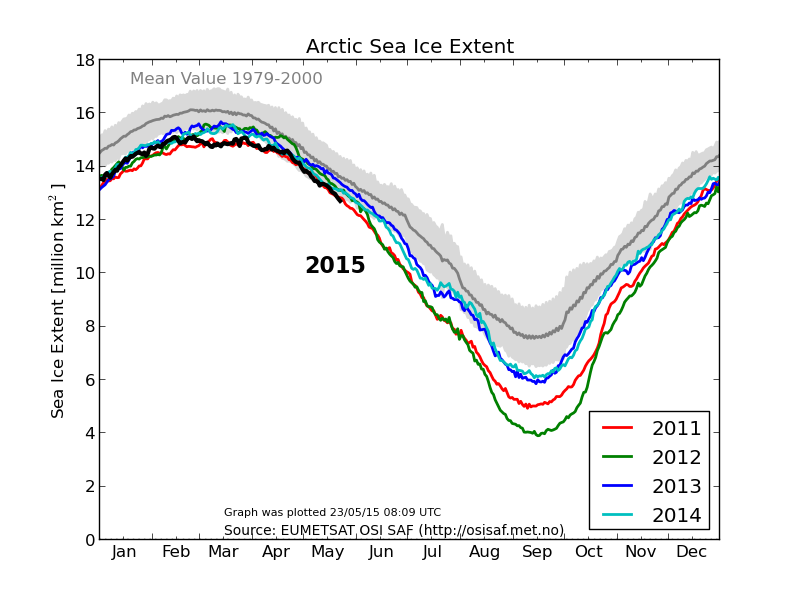
2) Which chart are you thinking of? This one?
3) Have you seen this graph from the NSIDC? Which year grew the juiciest cherries?
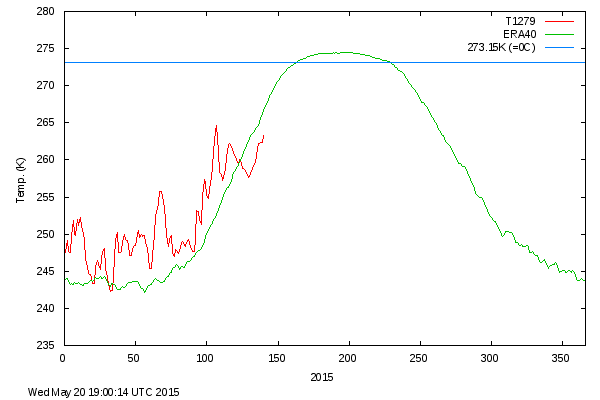
As the DMI’s > 80N temperature plot gets back to “normal”:
the NSIDC’s 5 day averaged Arctic sea ice extent falls below 12 million square kilometres in May for the first time since their satellite records began.
Needless to say it is not “tracking” 2005 and/or 2006 very closely at present either.