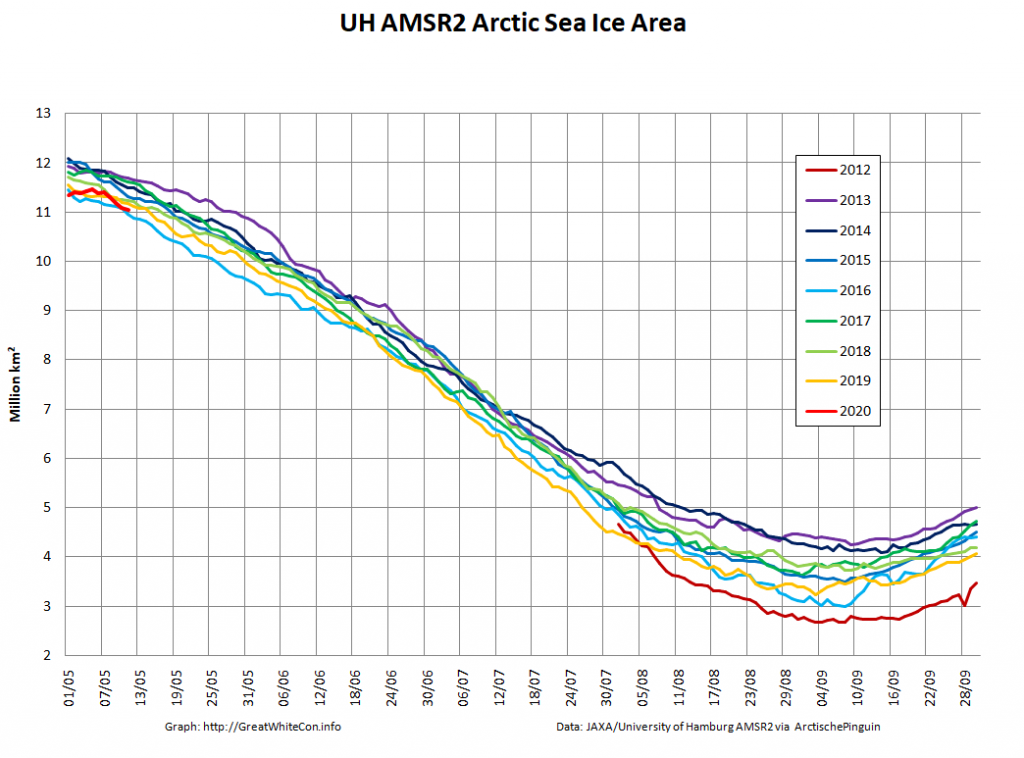
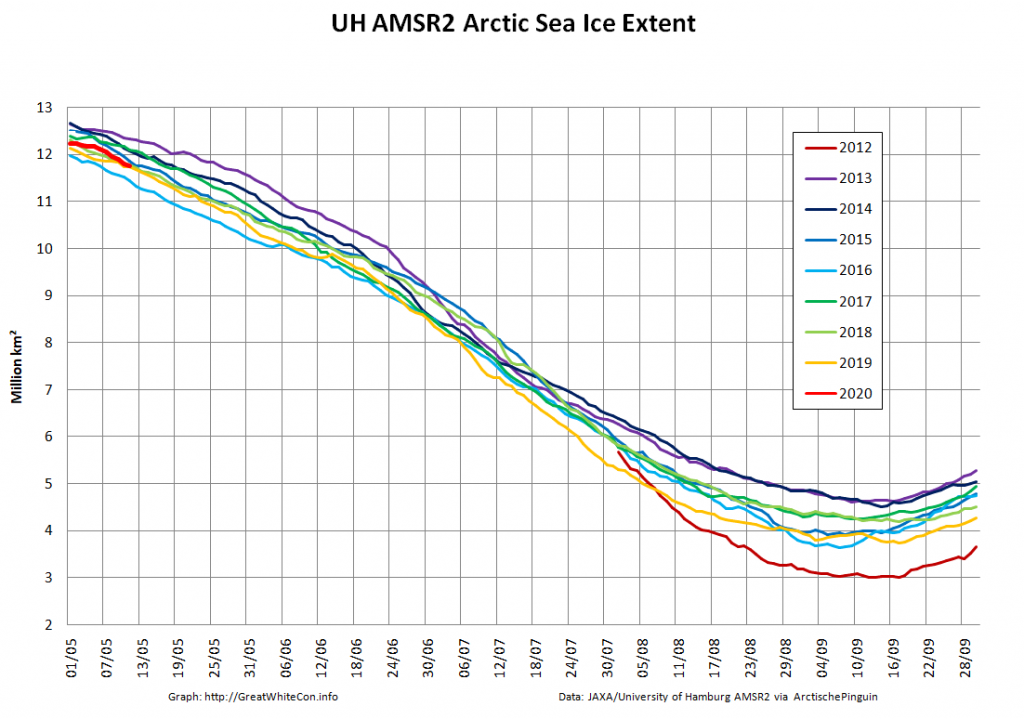
Let us begin this month’s report from the far north with the high resolution Arctic sea ice area and extent graphs based on the University of Hamburg’s AMSR2 concentration maps:
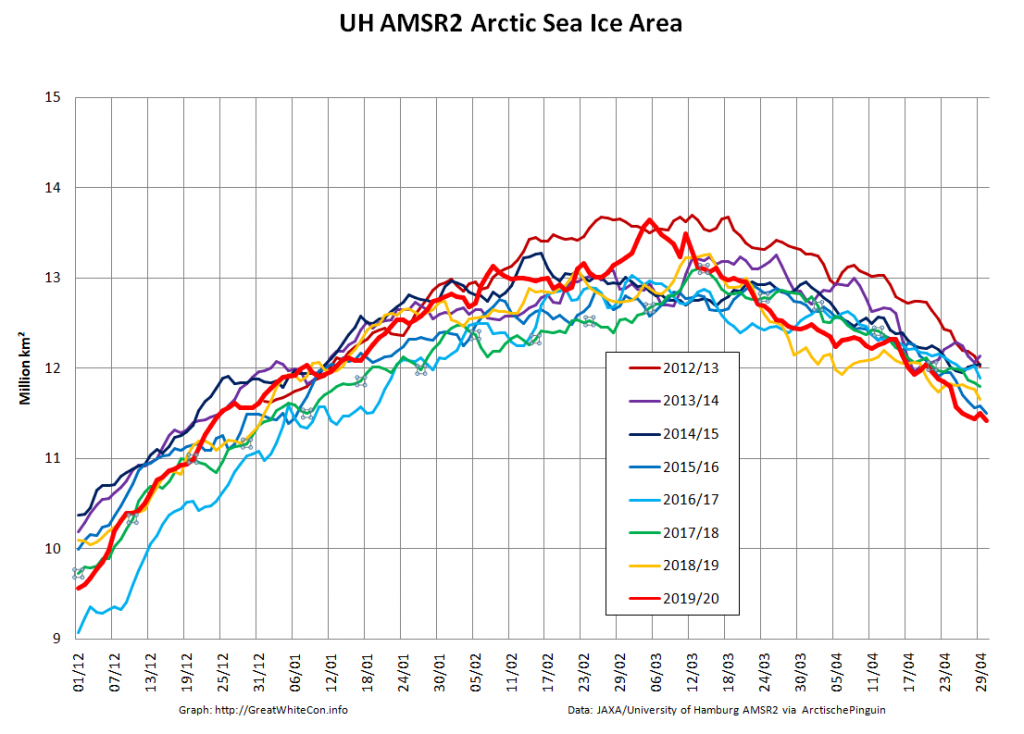
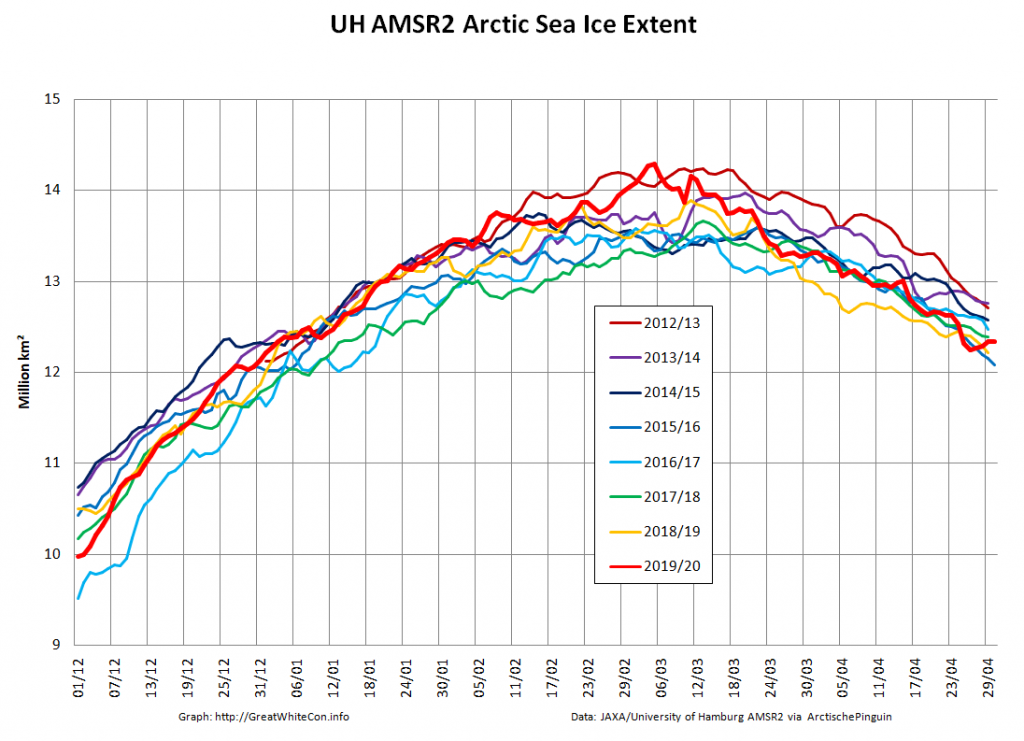
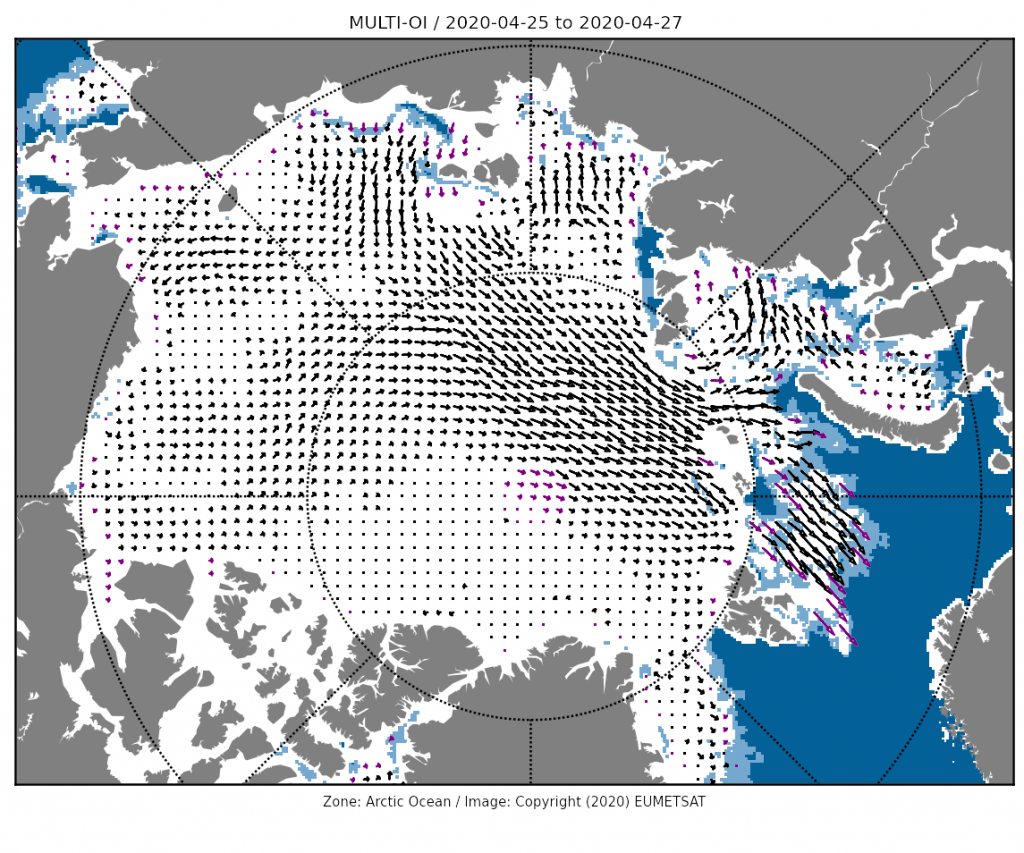
Area is currently lowest for the date in the AMSR2 record. After briefly occupying that position extent has increased over the last few days of April due to winds causing sea ice to move in the direction of the far North Atlantic:
The Alfred Wegener Institute has now finished reanalysing their CryoSat-2/SMOS thickness data, and the resulting volume graph looks like this:
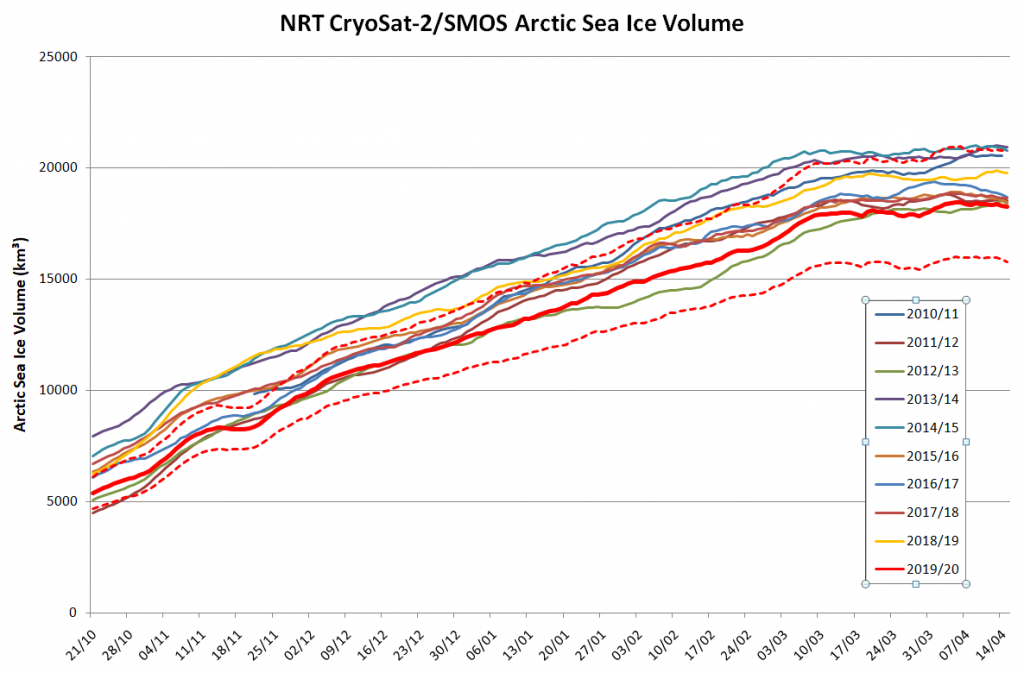
“Measured” Arctic sea ice volume is the lowest in the CryoSat-2 era as we head towards the main 2020 melting season, which in my calendar at least begins on June 1st. The PIOMAS modelled volume numbers should be released shortly.
The April 30th PIOMAS gridded thickness numbers have been released, and Wipneus has worked his usual magic. By way of comparison with the AWI metric:
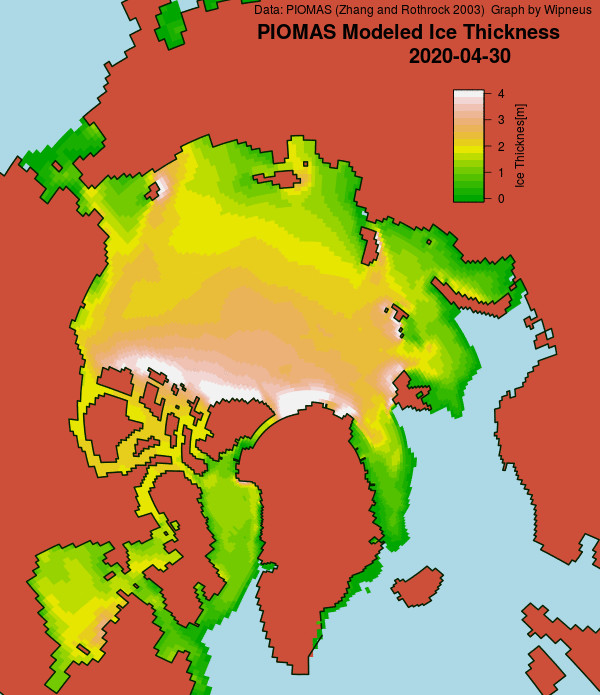
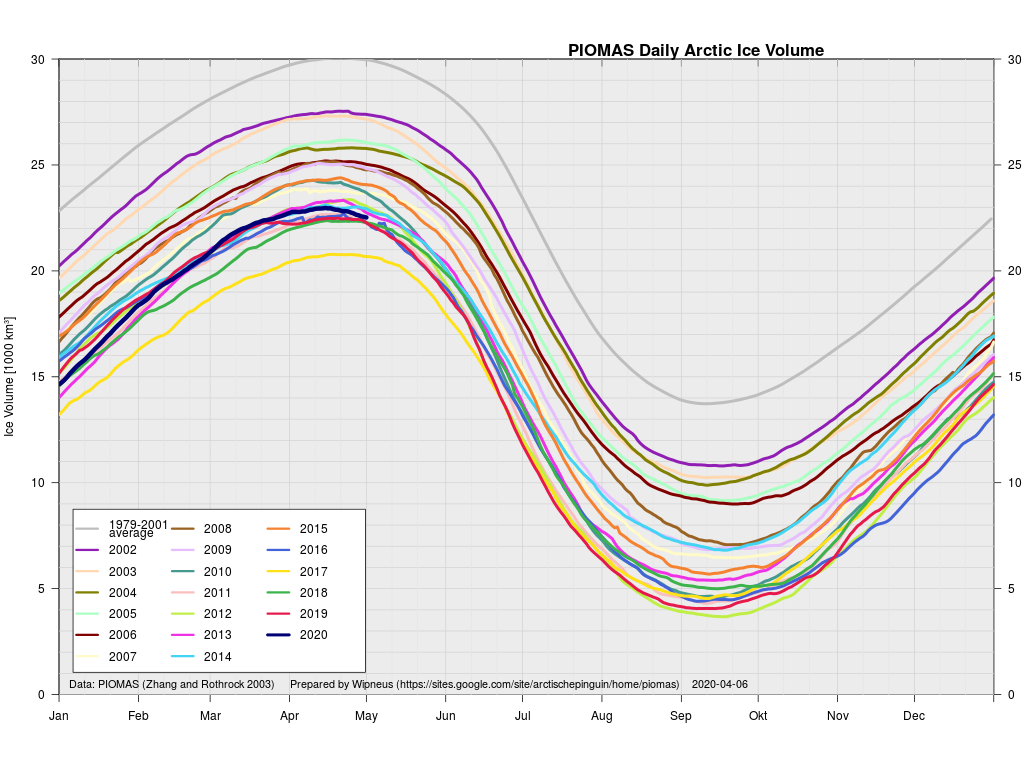
Obviously differing from CryoSat-2/SMOS, PIOMAS has 2020 volume a long way above 2017, in amongst a gaggle of other years.
[Edit – May 13th]
The middle of May is rapidly approaching, so let’s start to set the scene for the forthcoming melting season. First off here are the hi res AMSR2 area and extent graphs:
Extent is currently significantly above 2016 due to the recent “dispersion” mentioned above, but area is very close to an all time low for the date.
Next take a look at the current northern hemisphere snow cover anomalies from the Rutgers University Snow Lab:
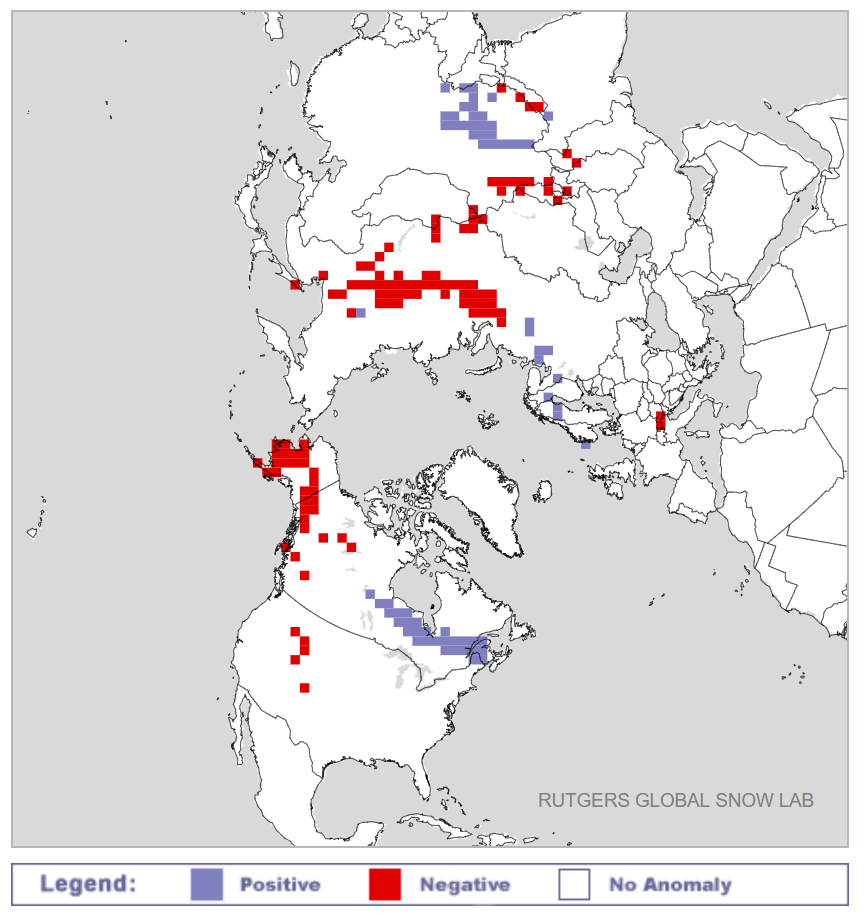
Whilst there is a positive anomaly near Hudson Bay, there are significant negative anomalies across Siberia and Alaska. This does not augur well for sea ice retention along both the Northern Sea Route and Northwest Passage by September 2020.
Watch this space!
Not commenting for a while,
Stuck on ice.
“Obviously differing from CryoSat-2/SMOS, PIOMAS has 2020 volume a long way above 2017, in amongst a gaggle of other year“
The Polar Science Centre presents a new pause
A new pause. Interesting.
“ The time series for CryoSat/SMOS total volume shows April 2020 a lower relative to the 2011-2020 period while PIOMAS shows a bit of an uptick. Neither time series indicates a trend over the past 10 years contrasting the drastic thinning over the last 40-years.”
Which as I apparently need to keep on repeating, should not come as a big surprise to anybody who follows Arctic sea ice science closely.
See “The Slow Transition” thread on the ASIF from 2014
However what about the trend in sea ice age over the last ten years or so?
Here partly as I was reading your comments on PIOMAS elsewhere.
–
I find the the trend in sea ice age over the last ten years or so a conceptually difficult metric.
Ine of the problems as I have mentioned before is that the less ice you have to start with the less the percentage of multi year ice appears to be in a good recovery year.
Counter intuitively this means that years with low percentage multi year ice are actually making good recoveries.
This might help explain the contradiction between a 10 year pause in ice volumes, sought of a recovery in a way from the previous high falls and a downwards trend in multi year ice for 10 years which also fits in with recovering, not diminishing ice in the Arctic?
If course I am probably wrong again but it is an interesting concept.