“Steven Goddard” is evidently magically turning into “Snow White’s” muse. His latest fairy tale addresses her second favourite subject after Arctic sea ice, which is of course northern hemisphere snow cover. The article is entitled “October-March Snow Cover At Record High Levels“, and proudly proclaims that:
Fifteen years ago, climate experts said that snow is a thing of the past. Since then, Northern Hemisphere snow cover has soared to record levels.
What this tells us is that cold air is intruding further south during the snow season. It also tells us that Tom Karl at NOAA is lying about global temperatures.
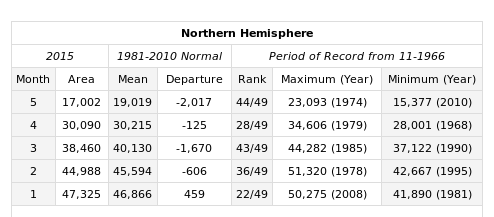
Snow White and I innocently followed Steve’s link, then clicked on the “Rankings” link on the left hand side, where we discovered this:
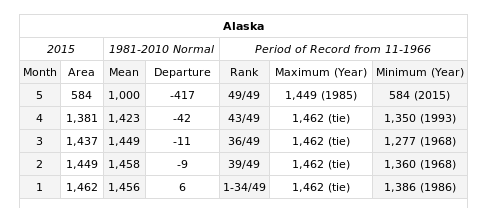
not to mention this:
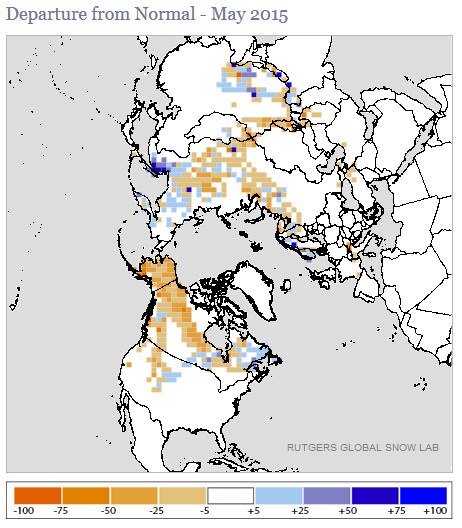
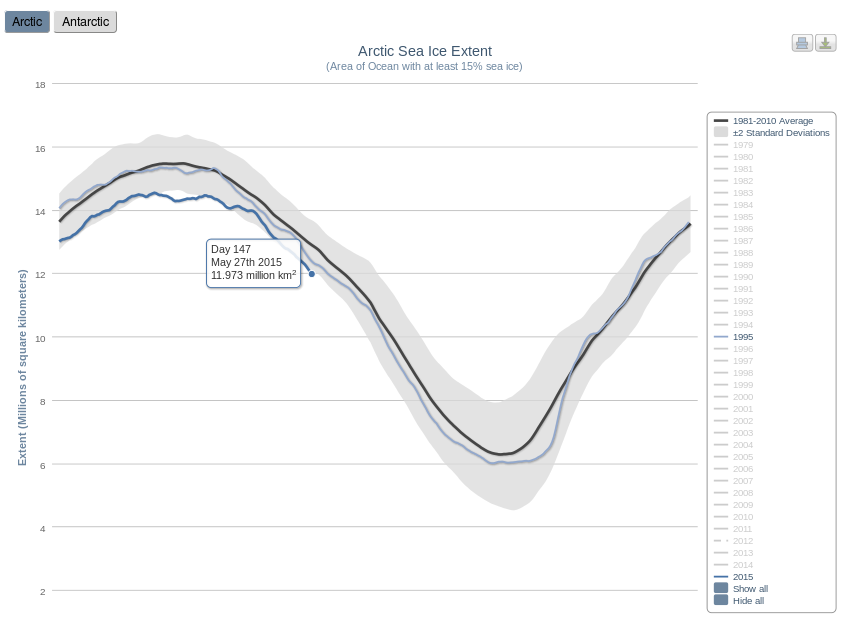
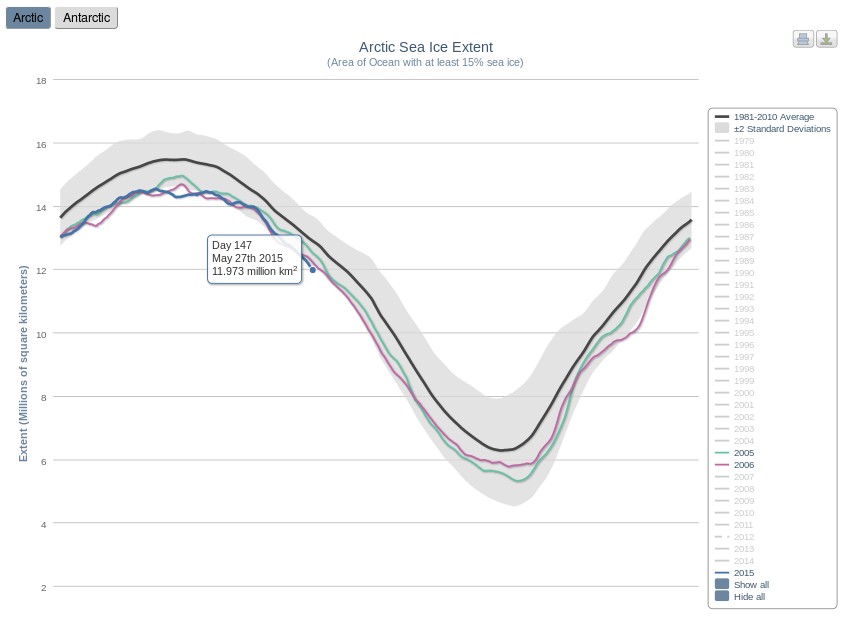
Feeling confident that all the Real Scientists would be interested in the latest data hot off the presses from the Snow Lab we showed them this picture:
and enquired?
What does that tell us?
The initial response from “gator69”?
The fact that you refer to “normal” in climate or weather tells us that you have zero understanding of either.
When will you work to help the starving millions by confronting alarmists, and assist in diverting money to where it is desperately needed right now?
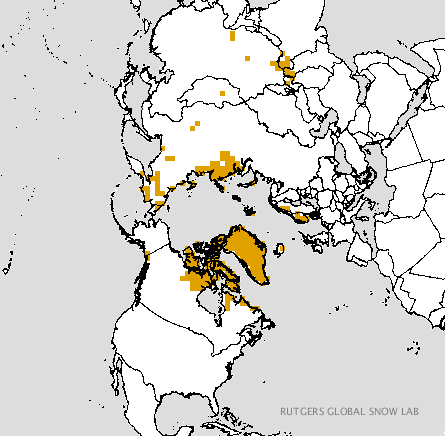
Since “Real Scientists” are apparently aghast at anomaly maps, here are the current absolute values from Rutgers:
Just in case you are wondering what all this has to do with Snow White’s favourite subject of all, here’s the current Topaz 4 map of Arctic sea ice snow cover:
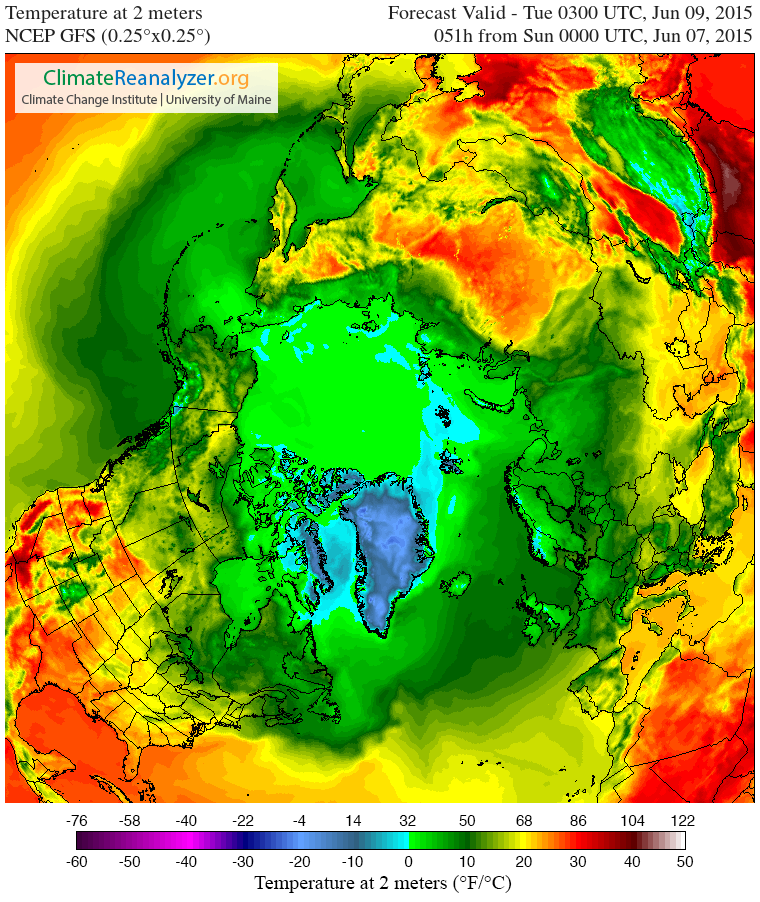
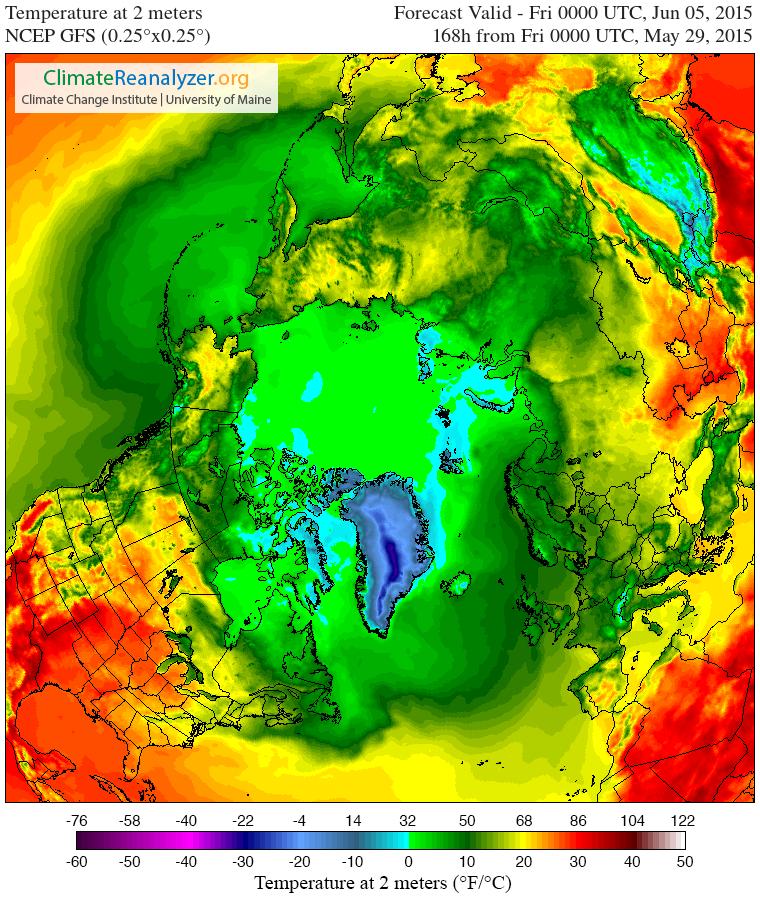
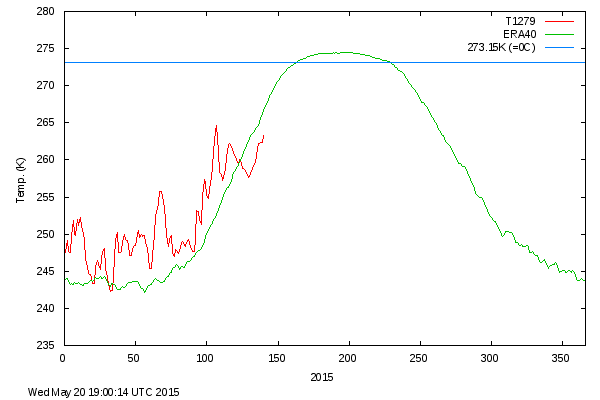
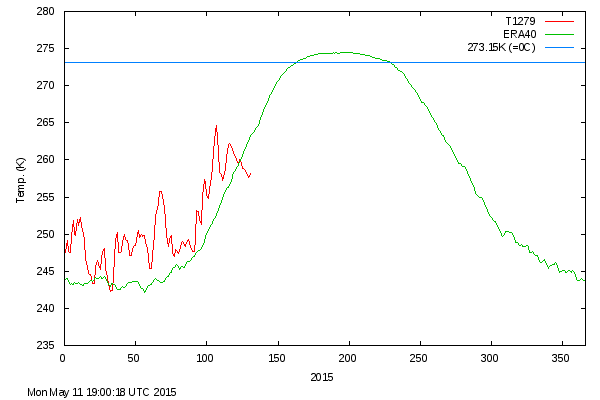
and here is the current northern hemisphere temperature forecast for Tuesday morning from the “Climate Reanalyzer”
Snow White and I cannot help but wonder what effect temperatures above zero across virtually the entire Arctic Ocean will have on the snow cover that currently remains. We also cannot help but wonder whether 2015 Arctic sea ice extent will suddenly start tracking 1995 or 2006 as a consequence.
We also wondered what Tom Karl et al. of NOAA have been saying about the Arctic, and discovered this:
Since the IPCC report, new analyses have revealed that incomplete coverage over the Arctic has led to an underestimate of recent (since 1997) warming in the Hadley Centre/Climate Research Unit data used in the IPCC report. These analyses have surmised that incomplete Arctic coverage also affects the trends from our analysis as reported by IPCC.
Finally, for the moment at least, here’s the Topaz 4 snow depth forecast for June 16th 2015:
Thanks to “Nightvid Cole” and “Vergent” at the Arctic Sea Ice Forum for bringing that view of things to our attention.
There’s no rest for the wicked! Tony Heller, still better known as the pseudonymous “Steven Goddard”, is promulgating his erroneous Arctic sea ice narrative once again this morning. In an article entitled “Rommulans Never Learn” he has this to say:
From five years ago, the Arctic was doomed and I was a denier. And five years later, the ice is still almost exactly the same as twenty years ago.
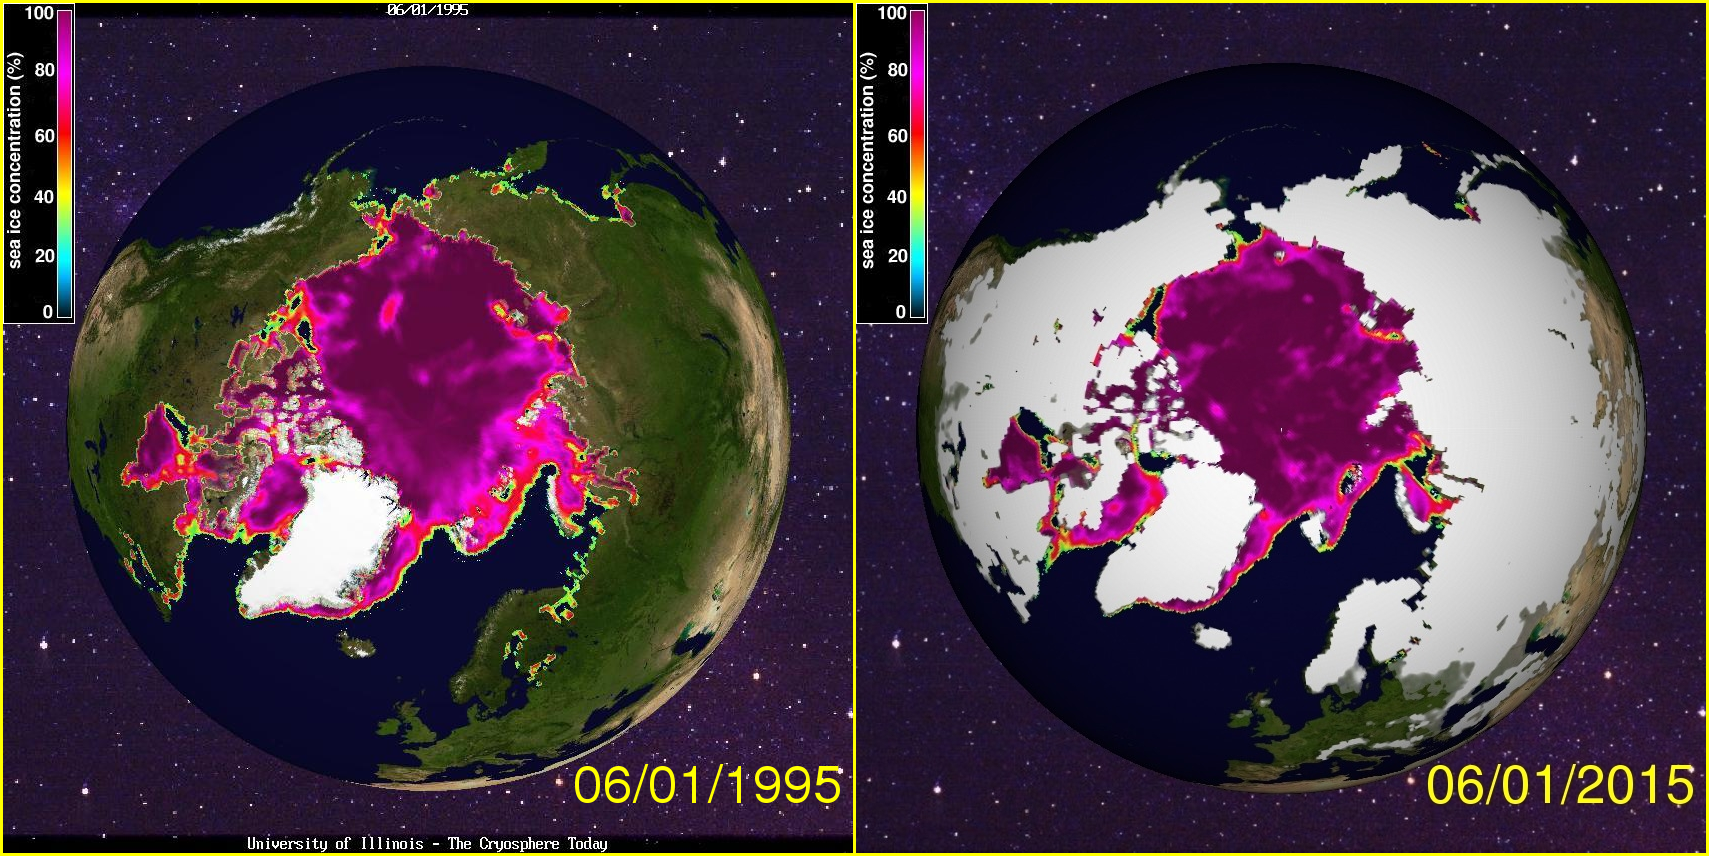
and he then presents this Cryosphere Today image comparing Arctic sea ice concentration on June 1st 2015 with the same date in 1995:
and comments:
Someone with an IQ over 30 might be able to figure it out, but not climate alarmists.
Obviously Steve/Tony hasn’t received our message yet, so we repeated it yet again:
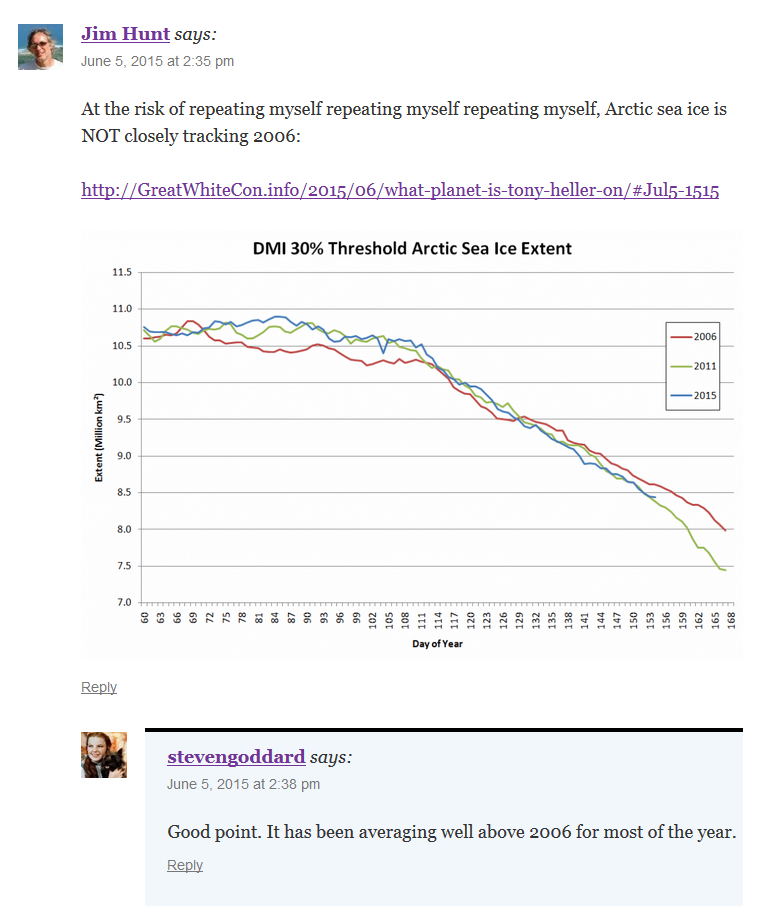
At the risk of repeating myself repeating myself, the ice is NOT still almost exactly the same as twenty years ago:
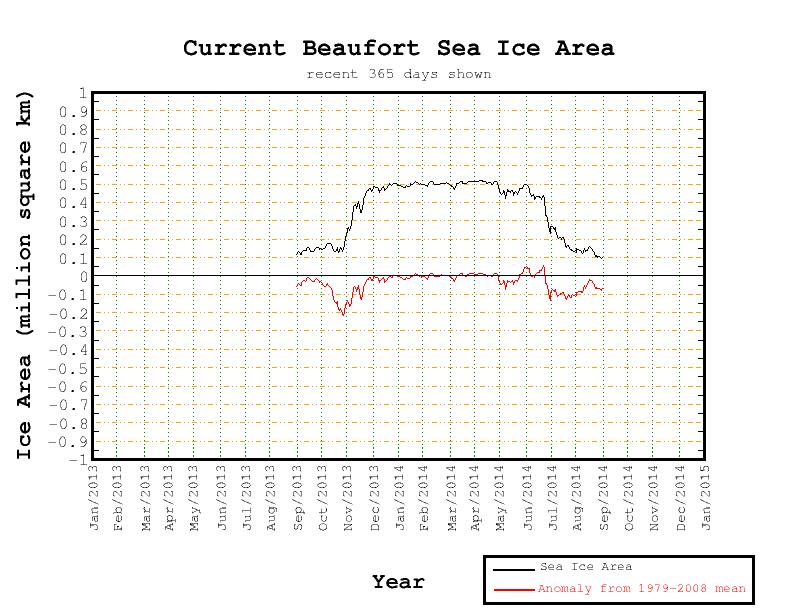
“Can you see the dark blue areas in the 2015 image where there aren’t any in the 1995 image? Try looking at the Beaufort Sea, the Chukchi Sea, the Kara Sea and the North Water Polynya”
The shiny white area in the 2015 image is also of course a long way from the current reality.
For those with an IQ of 30 or less who would like to play “spot the difference” with us, here is a hastily prepared animation of a somewhat pixellated Chukchi Sea:
It is my duty to report what actually is happening, even if it isn’t what I expect.
I sure do wish Mr. Hunt would learn to do the same. Why on earth he would want to tell us ice was melting when it seemed obvious it was refreezing is beyond me. Does he have some deep need to humiliate himself, like a medieval person undergoing self-flagellation?
Of course I couldn’t take that lying down, so:
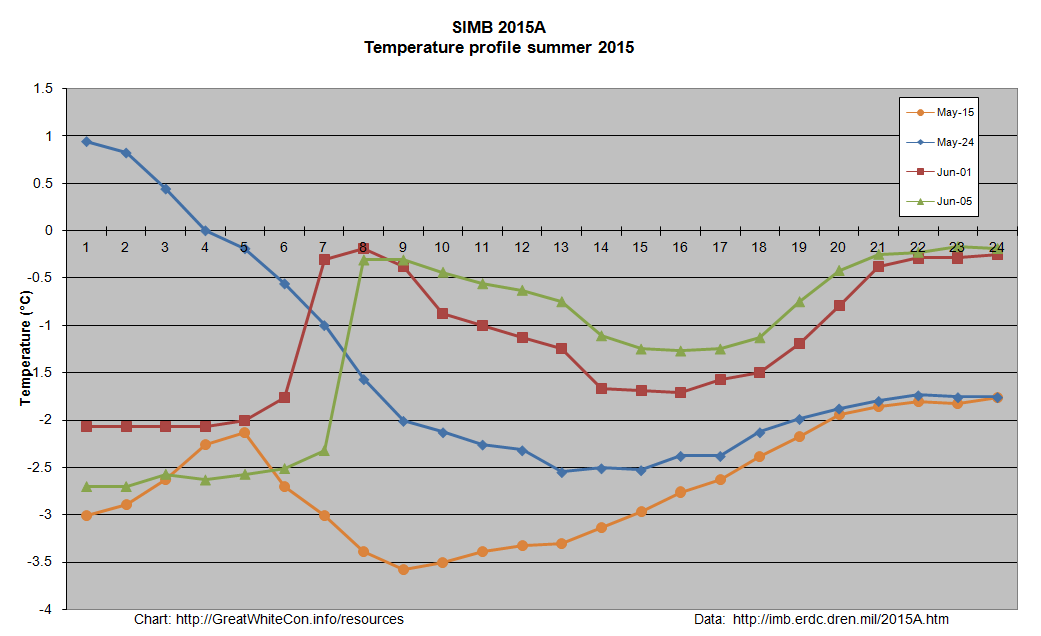
For your information, and that of anyone else who might be interested, the core temperature of the ice floe underneath 2015A got up to -1.34 °C yesterday:
Finally, for the moment at least, here’s an animated GIF of the North Water Polynya which I fear won’t impress Treesong very much:
[Edit 16:00 BST July 7th 2015]
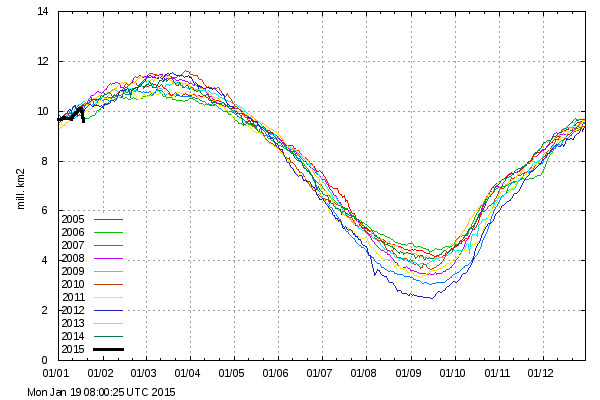
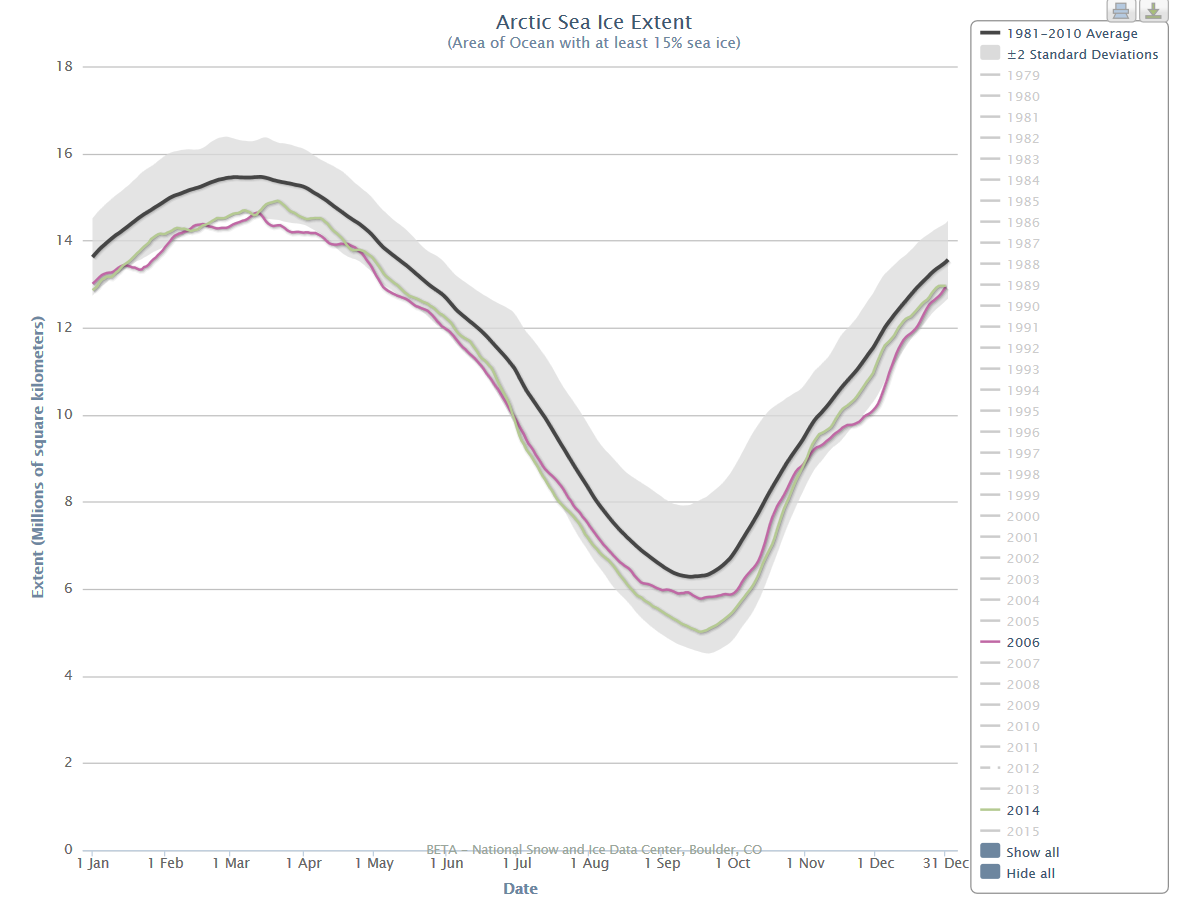
If you repeat something often enough does it eventually turn into the truth? Today’s Arctic article from Steve/Tony is strangely familiar. It is entitled “Arctic Sea Ice Continues To Track 2006“. However according to the NSIDC today:
[Edit 11:00 BST July 11th 2015]
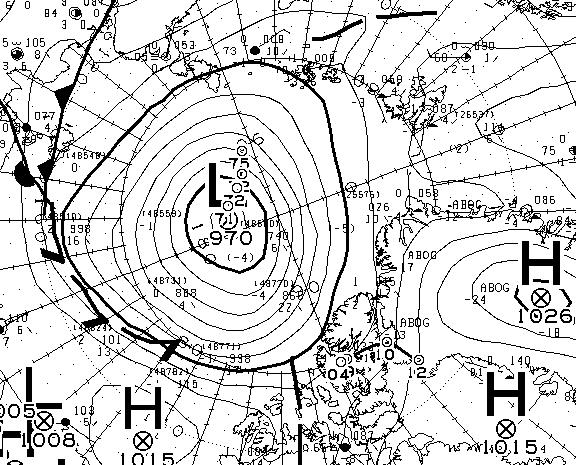
Steve/Tony keeps maintaining every day or two that “Arctic Sea Ice Continues To Track 2006”. There’s been a cyclone over the central Arctic with a minimum central pressure of 970 hPa (or mb if you prefer), which has caused some divergence of the sea ice:
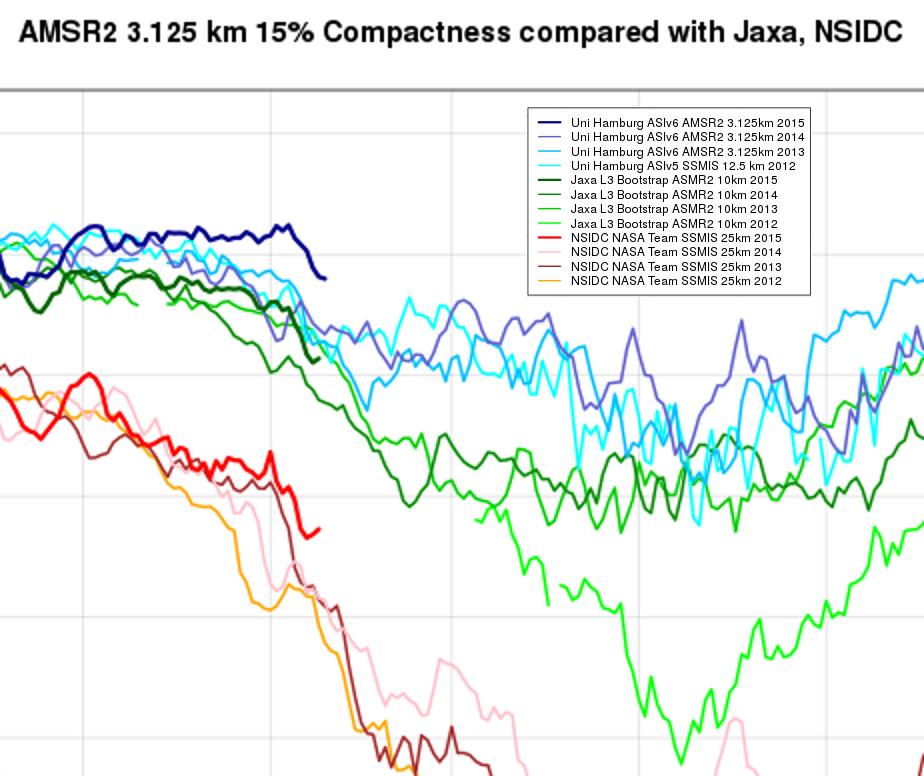
Here’s a closeup of the recent history of a variety of “compactness” metrics which illustrates that point:
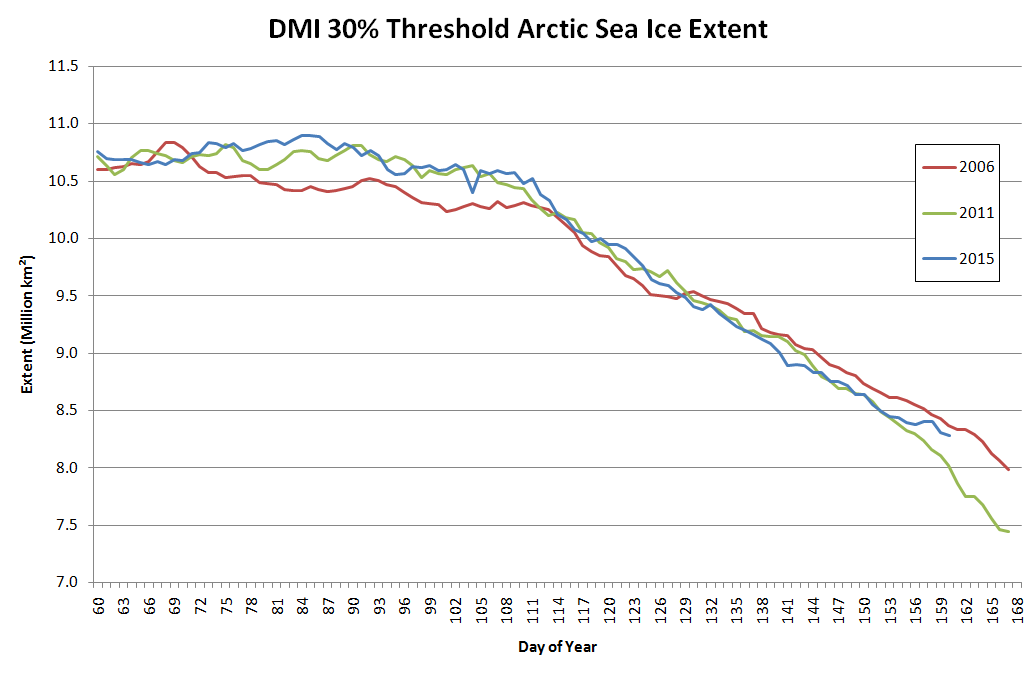
Across the board the sea ice in the Arctic is less compact than a few days ago as a result of the cyclone, but still more compact than on the same date in other recent years. Getting back to the extent metrics, here’s what the DMI 30% threshold version has been up to:
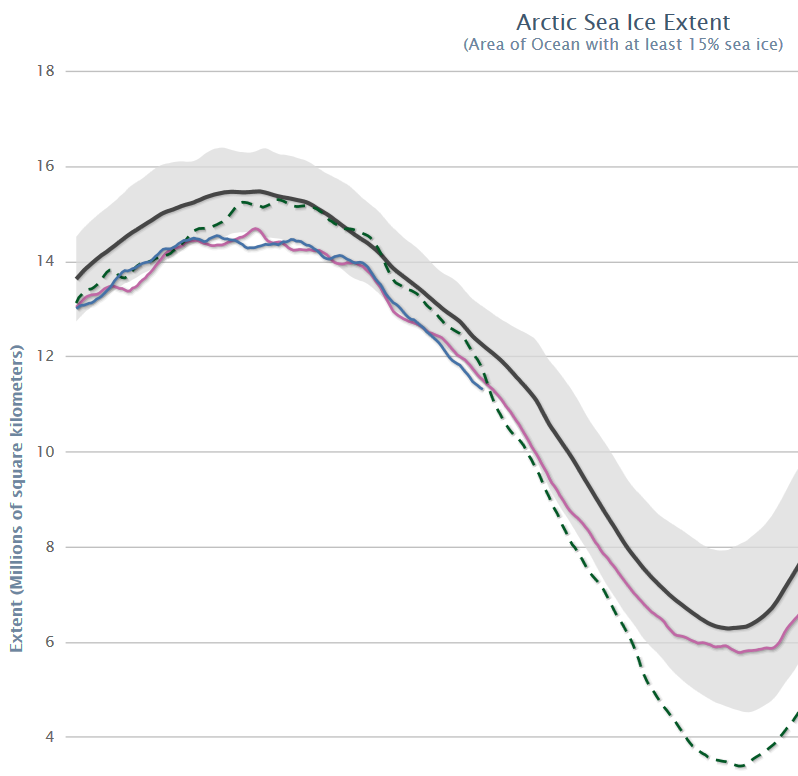
and here’s the NSIDC 5 day average of their 15% threshold flavoured variety:
Once again our title for today is inspired by the indefatigable “Steven Goddard”. His latest Arctic themed article on his so called “Real Science” blog is entitled “Trouble Looming For Arctic Alarmists“, and he’s following his usual formula of showing an image or two interspersed with unrelated text. Here’s Tony’s textual take on things, interspersed with our graphic retorts:
Arctic sea ice coverage is nearly identical to 20 years ago:
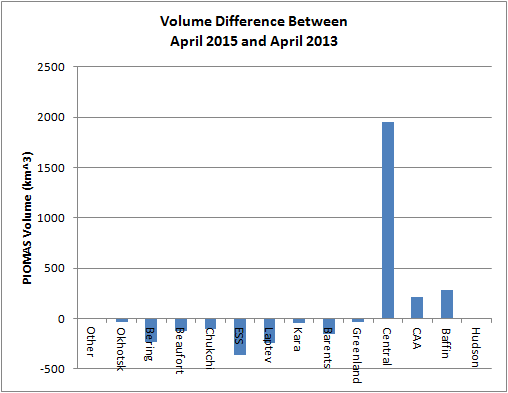
Arctic sea ice is the thickest it has been in a decade.
According to PIOMAS it’s thin in the Beaufort, and most other areas too!
As we summarised matters for “Steve”/Tony’s loyal readership:
The Gish Gallop continues! Just for the record:
Arctic sea ice coverage is currently NOT nearly identical to 20 years ago
Arctic sea ice is currently NOT following almost the exact trajectory of 2006
Arctic sea ice is currently NOT the thickest it has been in a decade in Ron’s beloved Beaufort/Chukchi/East Siberian Seas (BCE for short)
Renowned Arctic sea ice expert “Steve Goddard” predicted last year that.”The minimum this summer will likely be close to the 2006 minimum, which was the highest minimum of the past decade”. That’s not how things eventually turned out!
Experts say that the Arctic is in a “death spiral” – but for the past two years it has been tracking 2005/2006 – the years with the two highest summer extents of the past decade.
For the past four years, summer melt season temperatures in the Arctic have been well below normal.
No matter how many times experts lie about it, the Arctic is not melting down.
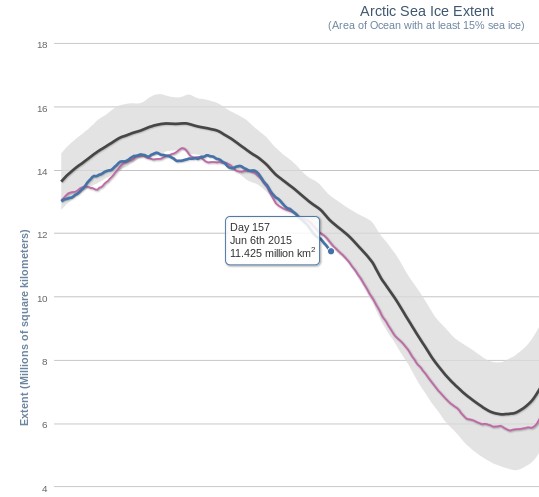
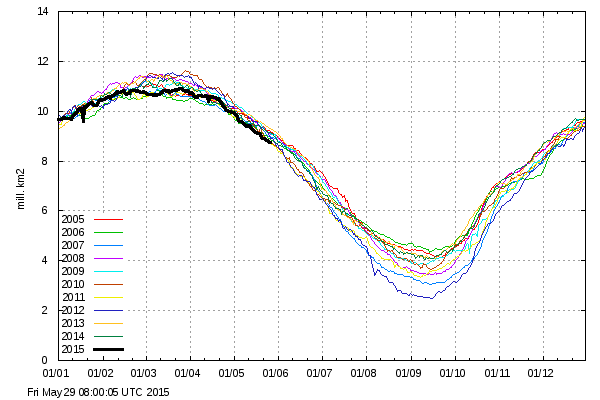
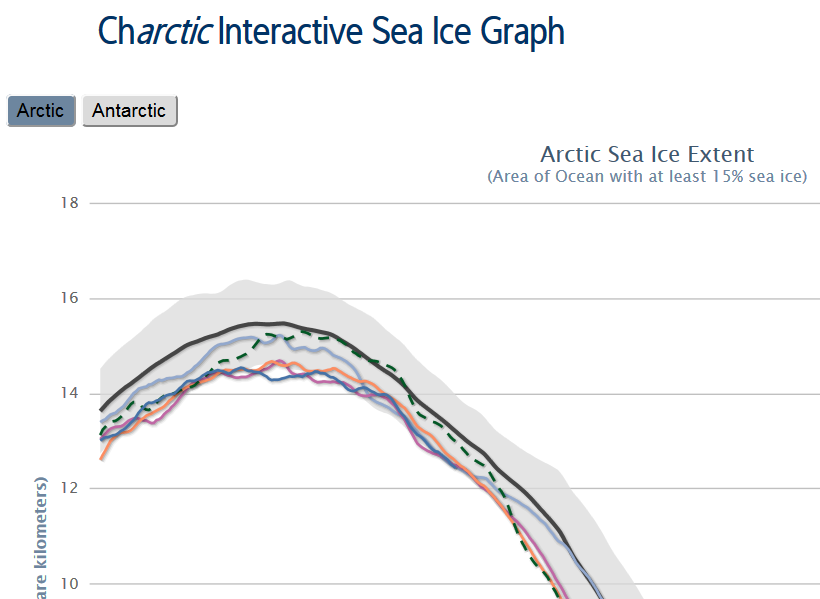
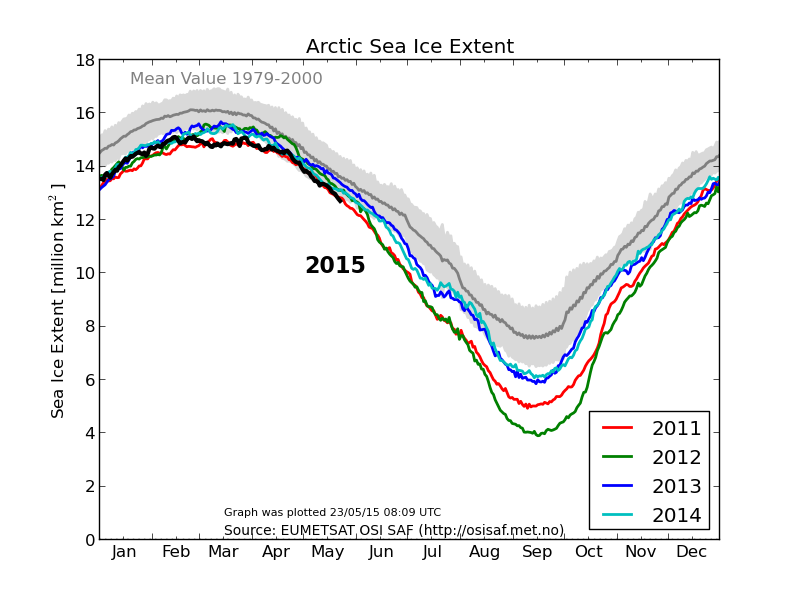
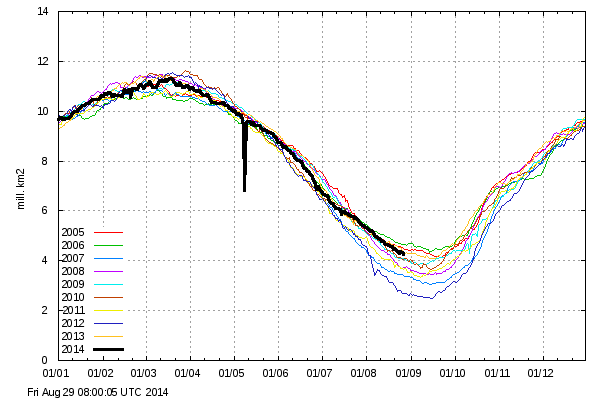
The Arctic, of course, has other ideas and continues to fail to conform to the narrative over at (un)Real Science. Today the NSIDC 5 day average extent Arctic sea ice extent is in actual fact at the lowest level for the time of year since their records began:
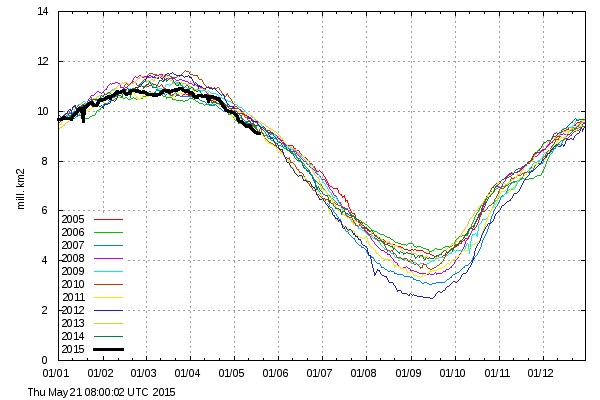
In view of “Steve”/Tony’s headline you may find it surprising that so is his much beloved DMI 30% threshold extent extent metric (displayed in full):
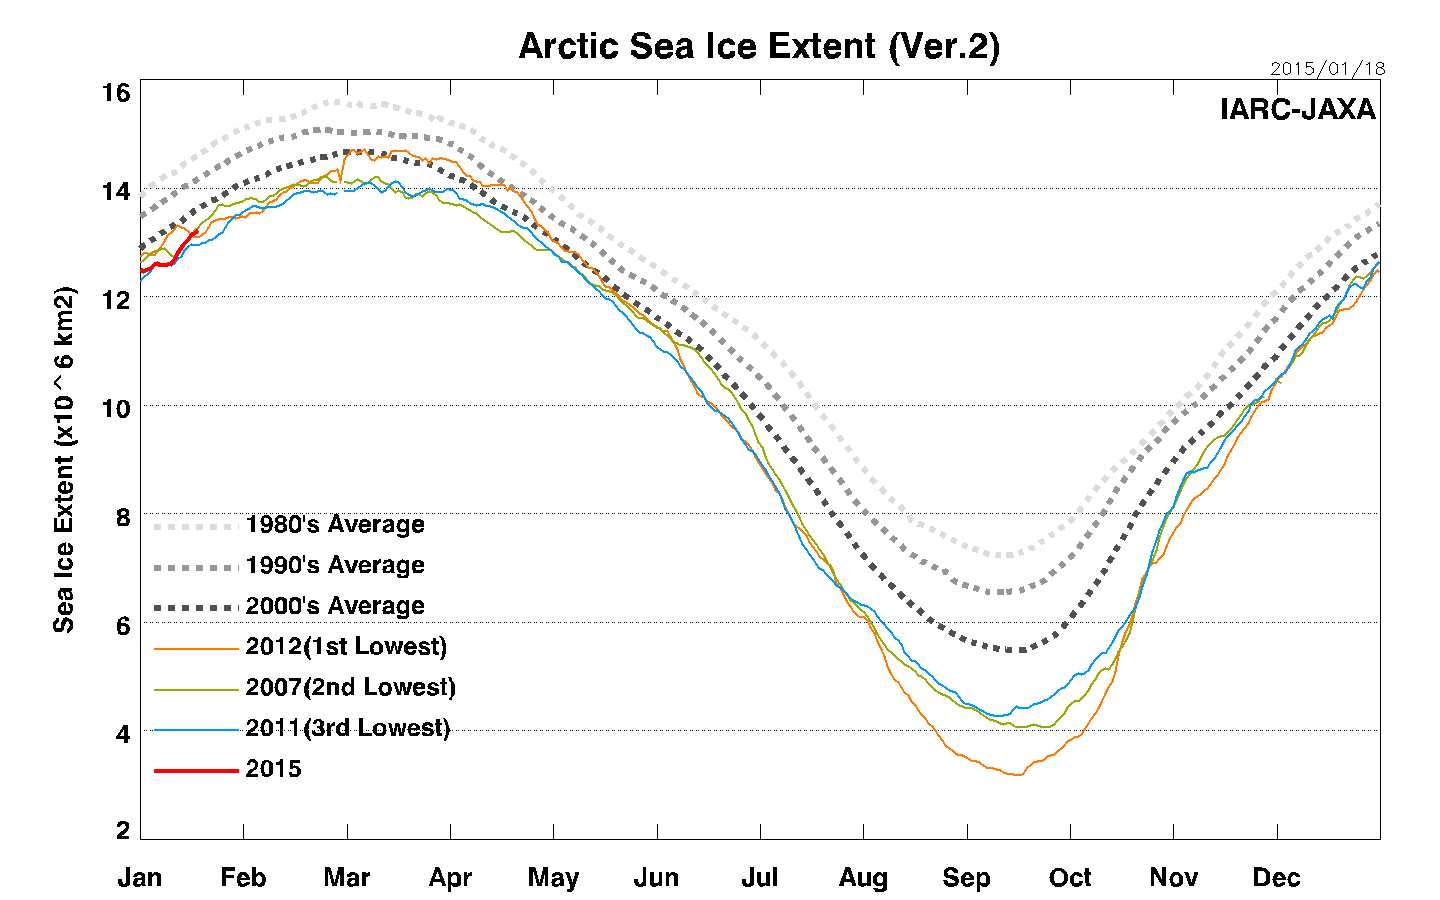
and so is the JAXA 15% extent extent:
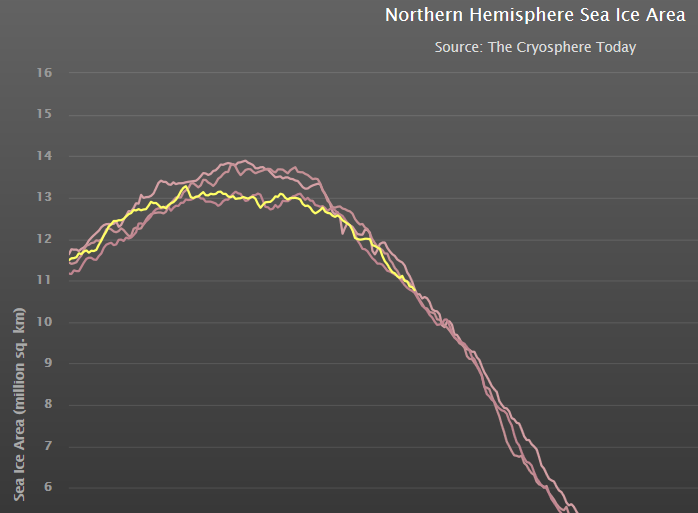
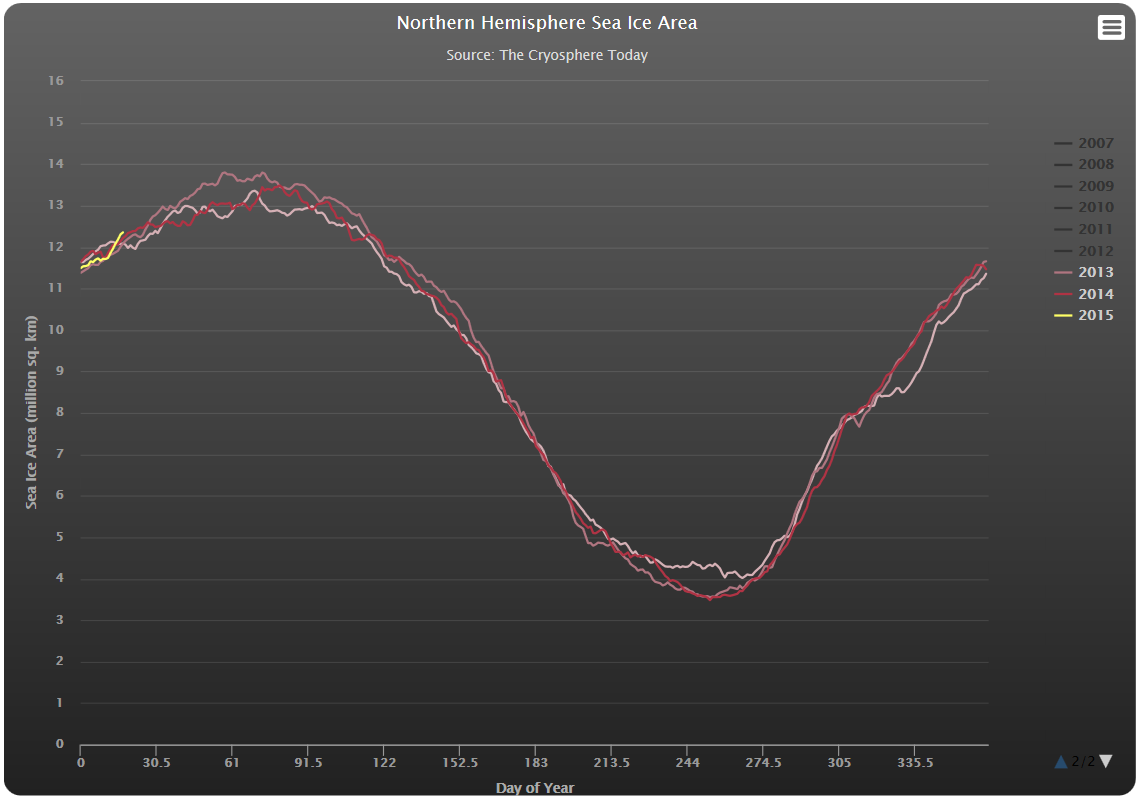
Holding out by the merest whisker (for the moment) is the Cryosphere Today area metric, which is nonetheless lower than on the same day in both 2005 and 2006:
Quod Erat Demonstrandum?
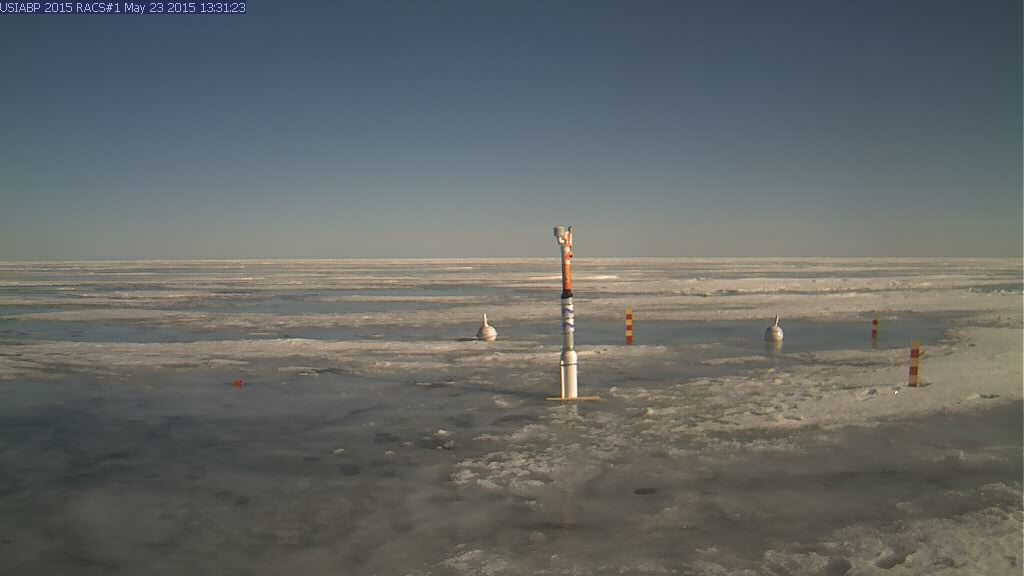
[Edit – May 23rd 2015]
After being used by a polar bear to inspect its feet, the webcam trained on ice mass balance buoy 2015A is now pointing in the right direction again. It reveals that the Arctic is in fact “melting down” even as “Steve”/Tony maintains that it isn’t:
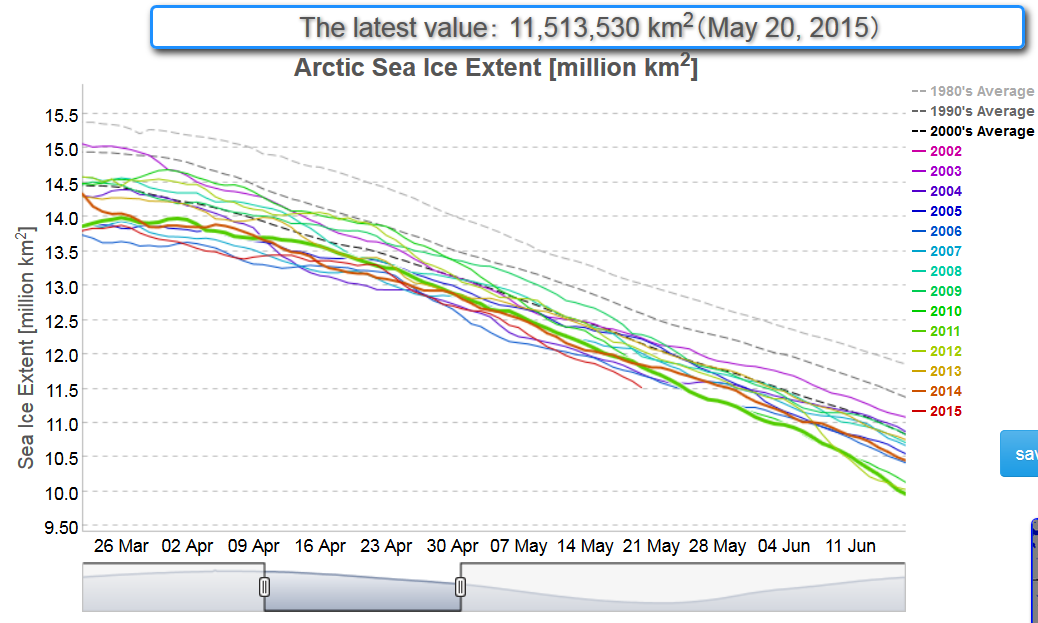
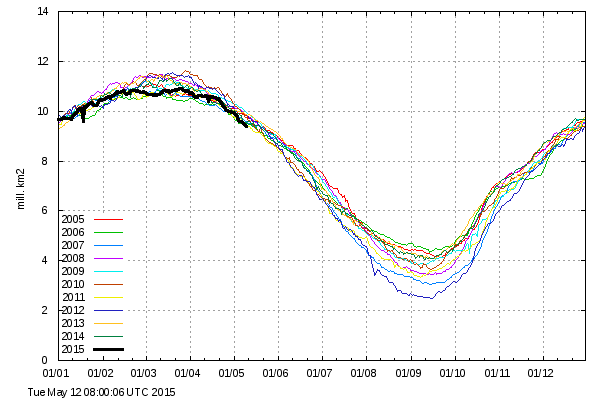
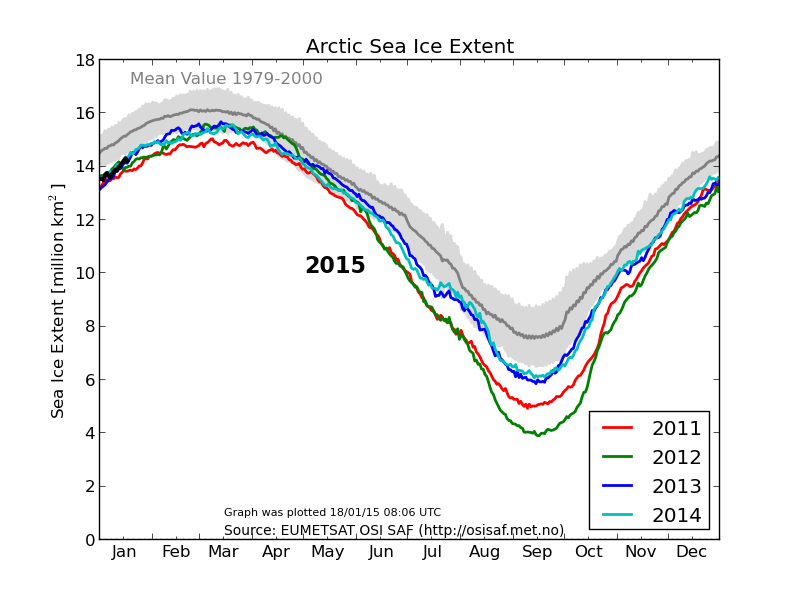
As if further proof were needed, the DMI 15% threshold extent graph extent is also now clearly lower than previous years at this time:
Both of the last two years, temperatures stayed below normal for the entire melt season.
The below normal summer temperatures are keeping the ice from melting, and have led to a large expansion in the amount of thick multi-year ice.
However the Arctic is unfortunately failing to cooperate with that narrative. Today we are unhappy to report that Tony Heller‘s favourite Arctic sea ice metric, the Danish Meteorological Institute 30% threshold extent, is at the lowest level ever for the date since their records began:
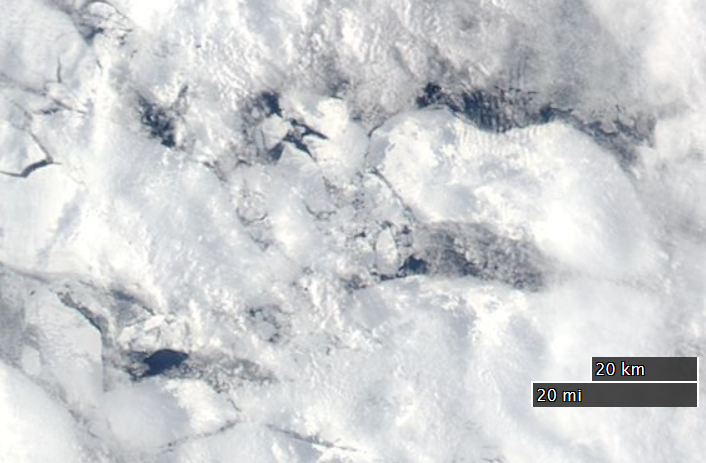
As if that wasn’t enough to be going on with, some big holes have already appeared in the middle of the supposedly multi-meter thick, multi-year sea ice in the Beaufort Sea, well away from the open water already warming up off the Mackenzie Delta:
NASA Worldview “true-color” image of The Beaufort Sea on May 11th, derived from bands 1, 4 and 3 of the MODIS sensor on the Aqua satellite
As regular readers will have realised by now, we are subject to a continuing barrage of verbal abuse as we fearlessly pursue our goal of telling the truth about the Arctic whatever the obstacles. Following the latest such episode we have consulted our learned counsel and decided to publish the spiciest episodes here. By the time August 2015 draws to a close a poll of our loyal reader(s) will determine which of our utterers of undeleted expletives will be awarded a wild card entry into the 2015 Great White Con Arctic Basin Big Wave Surfing Contest.
3) Roger (“TallBloke”) Tattersall, UKIP’s Yorks and North Lincs Energy and Climate Change spokesman and prospective parliamentary candidate for Pudsey, with:
Further to the cessation of the brief hiatus in my continuing discussions with “Steve Goddard” about “global warming”, the debate has turned to predictions concerning Arctic sea ice metrics during the 2014 melting season.
Firstly here’s a few charts of assorted Arctic sea ice metrics, hot off the virtual presses:
Chart from Cryosphere Today – http://arctic.atmos.uiuc.edu/cryosphere/arctic.sea.ice.interactive.htmlChart from IJIS – http://www.ijis.iarc.uaf.edu/en/home/seaice_extent.htmChart from DMI – http://ocean.dmi.dk/arctic/icecover.uk.phpChart from DMI – http://ocean.dmi.dk/arctic/old_icecover.uk.php
Here’s a table of the minimum value of some of those metrics for a selection of years:
In brief “Al Gore never ‘predicted’ that the Arctic would be ice-free by now!”
Them:
Well, he didn’t say ’22 years from now’, did he? No, he emphasized the most alarmist position he could find.
You can weasel out of this by stating that Gore did not make the prediction ,but he sure as Hell quoted and emphasized it, over any and all other predictions. And in front of the Nobel committee and entire world at that!
So have you confronted Gore over the failed prediction he parroted in Oslo? When you do, you will have a modicum of credibility. Get busy.
Us:
At the risk of repeating myself, “for the benefit of those who seem unable to understand either English or Mathematics a ‘projection’ is not the same thing as a ‘prediction’”
Getting back to Tony’s predictions, and using the NSIDC daily extent numbers for the moment, would you say that 4.98339 is “exactly” 5.74877? How about “close”?
Them:
Actually, no, your chart is less clear. Steve’s has all the years and it is clear his prediction is correct. Yours does not. Nor does yours have a legible legend. Another snow white lie.
Us:
Have you by any chance tried clicking on my chart? Does that help at all?
At the risk of repeating myself, would you say that 4.98339 is “exactly” 5.74877? How about “close”?
Them:
What bearing does 2013’s minimum have on goddard’s prediction for 2014? Are you a half-wit in addition to being a mentally ill stalker & transvestite?
Us:
What bearing does 2014’s maximum have on 2014’s minimum?
Are you blind?
Them:
You seem to think that some random number you came up with has some bearing on the subject at hand. Hint: it’s why we think you’re mentally ill.
Us:
Of course they’re not random numbers. To save you the bother of doing your own research please feel free to take a look at:
Stark, it’s not about random numbers, it’s about random harassment. This clown takes no issue with ridiculous ‘projections’ delivered by alarmist zealots on a world stage, instead he haunts this site moaning about near misses.
But you are right about the mentally ill bit.
Us:
The conversation about the non-random Arctic numbers has at last taken a statistical turn over at:
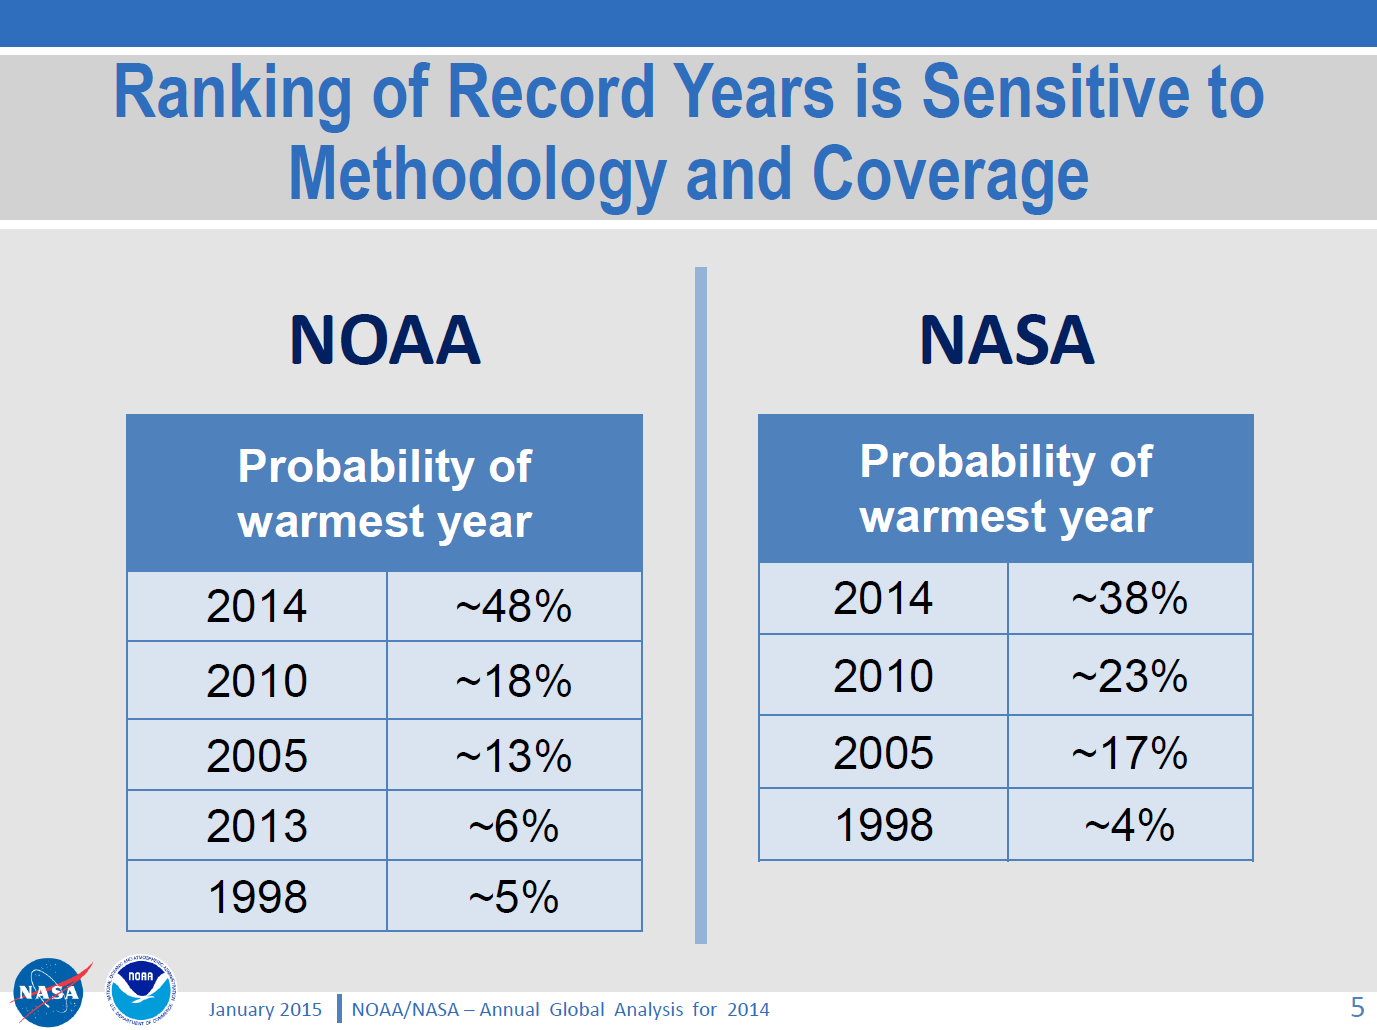
I don’t usually get involved in debates about “the global warming pause”, but as you will eventually see there is an Arctic connection, so please bear with me. Personally I reckon “global heat” is more relevant than “global surface temperature”, but nevertheless NASA and NOAA issued a “news release” a couple of days ago stating that:
The year 2014 ranks as Earth’s warmest since 1880, according to two separate analyses by NASA and National Oceanic and Atmospheric Administration (NOAA) scientists.
The 10 warmest years in the instrumental record, with the exception of 1998, have now occurred since 2000. This trend continues a long-term warming of the planet, according to an analysis of surface temperature measurements by scientists at NASA’s Goddard Institute of Space Studies (GISS) in New York.
In an independent analysis of the raw data, also released Friday, NOAA scientists also found 2014 to be the warmest on record.
The announcement was accompanied by this video:
I figured our old friend David Rose would have something to say about all that in the Mail on Sunday, and I was not disappointed. Yesterday David reported, in bold headlines:
Nasa climate scientists: We said 2014 was the warmest year on record… but we’re only 38% sure we were right
Nasa’s Goddard Institute for Space Studies claimed its analysis of world temperatures showed ‘2014 was the warmest year on record’
But it emerged that GISS’s analysis is subject to a margin of error
Nasa admits this means it is far from certain that 2014 set a record at all
David Rose includes this NASA video in the online version of his article:
which finishes up showing the Arctic blanketed in red for the period 2010-14. In the body of the article David suggests that:
GISS’s director Gavin Schmidt has now admitted Nasa thinks the likelihood that 2014 was the warmest year since 1880 is just 38 per cent.
but for some strange reason David neglects to mention this NASA/NOAA “press briefing“, which includes the following figure:
As you can see and hear, Gavin Schmidt’s “admission” was pretty public, and available for anyone doing their due diligence on this thorny topic to see well before the Mail on Sunday published David Rose’s article. For still more from Gavin see also the second half of yet another video from NASA, which we’ve hastily made embeddable from YouTube since NASA’s Goddard Space Flight Center don’t seem to have done so themselves as yet:
[Edit – 23/01/2015]
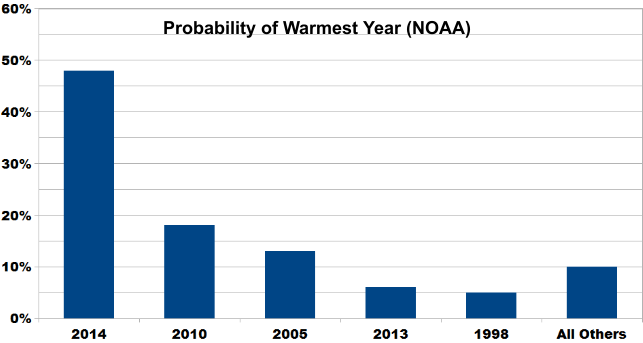
By way of further elucidation of the NASA/NOAA table of probabilities above, here’s a new graphic courtesy of Skeptical Science:
The probability of 2014 being the warmest year (due to margin of uncertainty and the small differences between years) is almost ten times that of 1998. And the contrarians were very certain that year was warm!
Does that help make things clearer, for those who evidently have difficulty understanding statistics?
[/Edit]
I also figured that the likes of “Steve Goddard” and Anthony Watts would be jumping on the same bandwagon, so you can imagine my disappointment when I discovered that they have both, unlike Gavin, blocked me from their Twitter feeds! Venturing over to the so called “Real Science” blog instead I discovered that Steve/Tony does at least read Gavin’s Twitter feed, although apparently not NASA/NOAA press briefings:
Them:
Implausible Deniability
Gavin is playing his usual game, trying to cover his ass with “uncertainty” that wasn’t mentioned in the NASA press release.
They get the propaganda out there for the White House and major news outlets, then try to generate implausible deniability through back channels like twitter. None of this was mentioned in the NASA press release.
Us:
I take it you weren’t on the call either Tony? Have you by any chance seen this press briefing?
THE DATA ON WEATHER AND CLIMATE (NASA AND NOAA) CAN BE COMPARED TO THE STOCK MARKET ON WALL STREET, MUCH CORRUPTION AND ALTERING. WE ARE NOT GUARANTEED A CERTAIN TEMPERATURE EVERYDAY; ALTHOUGH, THAT IS WHAT THEY WOULD HAVE US THINK, JUST BECAUSE OF SEASONS IN GENERAL.
Further to previous correspondence on similar matters, on January 27th 2015 I received the following email from the Personal Assistant to John Wellington, David Rose’s managing editor at the Mail on Sunday:
Dear Jim,
Thank you for your email.
I am afraid the best person to deal with your question is John Wellington who will reply on his return at the beginning of March.
Thank you for your patience.
Kind regards
Poppy Hall
Us:
CC: IPSO.co.uk
Dear Poppy,
Thanks for that information, but I am afraid my almost infinite patience in this matter is exhausted.
In John’s absence perhaps I might reiterate a question posed by Bob Ward of The Grantham Institute on Twitter yesterday:
Predictable that Mail on Sunday censored all letters pointing out errors in last week's article by @DavidRoseUK about @NASAGISS
Please would you ask whoever owns the desk on which the buck currently stops for the article entitled “Nasa climate scientists: We said 2014 was the warmest year on record… but we’re only 38% sure we were right” by David Rose to communicate with me as soon as possible. FYI – Here it is:
As I’m sure you must realise by now, unfortunately it includes some inaccurate and/or misleading statements which as far as I can ascertain have still not been publicly corrected.
Best wishes,
Jim Hunt
Post Script:
Bob Ward lodged a formal complaint with the Independent Press Standards Organisation about the Mail on Sunday article. Their conclusion?
The complaint was not upheld.
Remedial Action Required – N/A
Date complaint received: 13/02/2015
Date decision issued: 22/06/2015
Their “reasoning”?
The Committee noted that information about the margin of error had been made available by GISS, but that it was not in dispute that these details had been omitted from the press release. The article had made clear that this specifically was the basis for its criticism of Nasa, and the newspaper was entitled to present its view that this omission represented a failure on the part of the organisation. While the information had been released by Nasa, it had been released to a limited selection of people, in comparison to those who would have had access to the press release, and had not been publicised to the same level as the information in the release. The press briefing images referred to by the complainant were available on Nasa’s website, but were not signposted by the press release. In this context, it was not misleading to report that the information relating to the margin of error had emerged in circumstances where the position was not made clear in the press release. While these details of the margin of error may have been noted in a press briefing two days previously, rather than “yesterday”, as reported, this discrepancy did not represent a significant inaccuracy requiring correction under the terms of the Code.
Needless to say we are unimpressed by the following explanation:
Them:
The Danish Meteorological Institute shows a 63% increase in Arctic sea ice extent since the same date in 2012, and an increase of 76% since the 2012 summer minimum. Current extent is 4.4 million km², up from 2.7 million km² on August 28, 2012.
My methodology is similar numerically to DMI’s, I used maps from the Japan Aerospace Exploration Agency to generate the map below. Green shows ice gain since the same date in 2012, and red shows ice loss. My calculation shows a 64% increase in ice, almost identical to the calculations from DMI.
A favorite comment from alarmists is “the increase in ice extent is meaningless, because the ice is getting thinner“
They have it exactly backwards. The reason why ice extent is up, is because the ice is thicker.
Mind you I’m not the one proudly proclaiming “ice extent is up, because the ice is thicker.”. Steve/Tony is, but for some strange reason he provides visualisations of extent and age but not thickness!
Them:
Lets put it another way. Age of the ice is a proxy for ice thickness. But, if you don’t believe in proxies, just tell us.
Us:
Les – If you believe in proxies then PIOMAS Arctic sea ice volume for April 2014 was less than April 2012.
If instead you prefer the evidence of your own eyes then perhaps you can explain where all that red stuff in the Beaufort Sea in Steve/Tony’s animation has gone?
If “older, thicker ice is moving towards Alaska” then it looks like it’s melting there, not “accumulating”.
Them:
Mr. Hunt’s evidence…..
“NRL does not warrant or represent this INFORMATION is fit for any particular purpose,”
Us:
Anything/Gail/Sophie – Do you have any idea what this is?
Them:
Here’s a quick summary for people who aren’t following.
SG makes a post comparing 2012 and 2014. Jim argues with SG’s claim of thicker ice by comparing 2013 extent to 2014. When that gets called out, he shows the same silly 2014 plot that has no 2012 plot to compare to…still no valid comparison. After some back-and-forths and tangents, he brings up PIOMAS. When asked to compare thickness in PIOMAS 2012/2014, he avoids the question (twice).
Is there a single metric out there showing 2014 to be worse than 2012?
– Scott
Us:
Here’s a quick summary for you Scott:
Where’s all the “older, thicker ice in the western Arctic” that SG keeps referring to hiding?
Them:
Nice image, Jim. You have chosen a metric. So that’s half the story. Where’s the 2012 equivalent of that image so we can see if SG is wrong about 2014 vs 2012?
-Scott
Us:
Thank you for your kind words Scott.
I haven’t “chosen a metric”. I have nonetheless already shown you one comparison with 2013, using TH’s very own “metric”. To complete the story, and at the risk of repeating myself once again, perhaps you can explain where all the “older, thicker ice accumulating on the Pacific side” that TH keeps referring to is hiding?
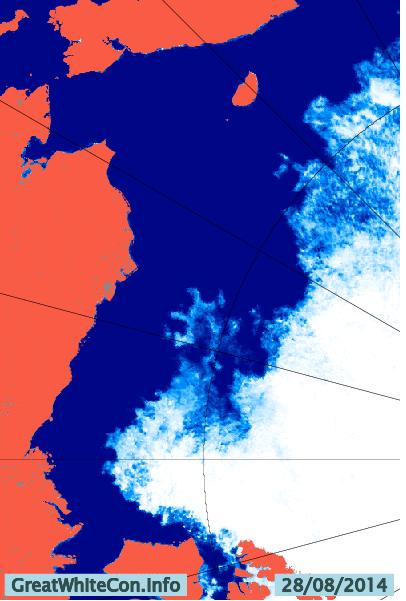
Our headline for today is only partially plagiarised from today’s “Arctic Shipping Update” article on “Steven Goddard’s” (un)Real Science blog. This morning Tony Heller posted the following ACNFS Arctic sea ice concentration visualisation:
Them:
Climate experts say that Northeast and Northwest Passages are open for business, but neither will open up this year.
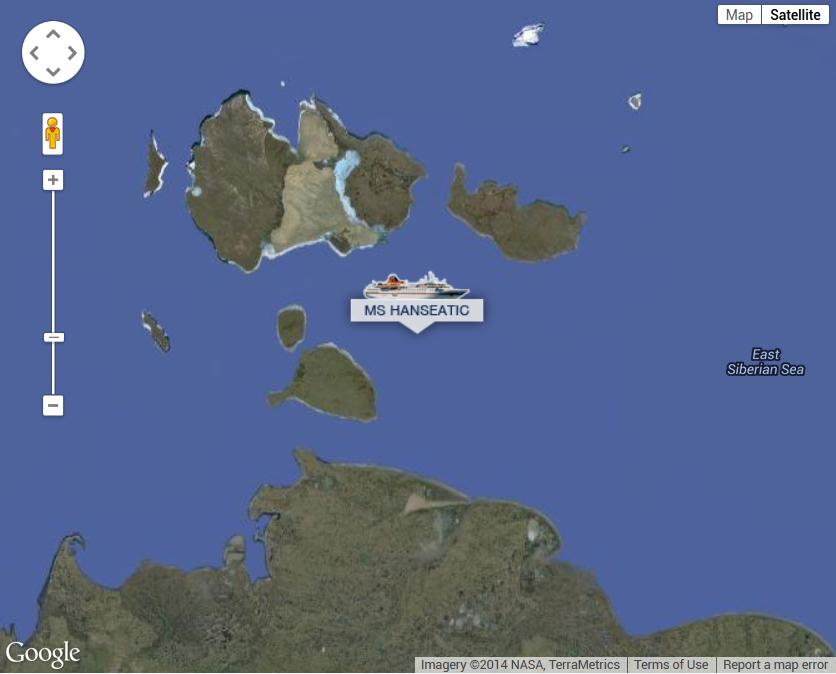
One of them is the Hapag-Lloyd cruise ship MS Hanseatic, which is currently wending its way through the New Siberian Islands:
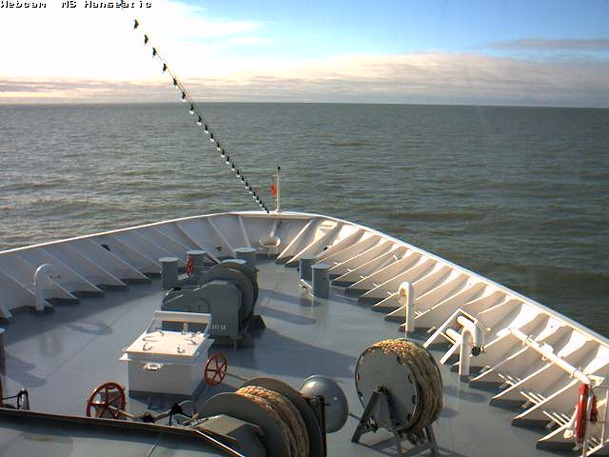
The Hanseatic also carries a webcam. Here’s what it reveals at the moment:
It’s currently pretty plain sailing on that section of the Northern Sea Route by the look of things!
Us:
By the morning of Sunday August 24th (UTC) my dissenting comment had been released from limbo, although it had remained there the previous evening. Them:
Somebody is telling a story aren’t they? Perhaps you’d like to tell us where the ship is. On the one hand I see a ship with the name Silver Explorer stuck in the ice, and then on the other I see your picture with green ice free waters. Everybody is going to be looking for this vessel now. Anybody with a satellite phone? Maybe they will wait it out till the ice thaws, like they did at the other pole. I will be saving that pretty picture of green, just in case you told us so.
Us:
Are you aware of the difference between the Northwest Passage and the Northern Sea Route, which is sometimes referred to as “the Northeast Passage”? That “pretty picture of green” is of the latter. Here’s the current position of the cruise ship MS Hanseatic in the Laptev Sea, coloured green on the map above:
You will note that my comment above was “stuck in Steve’s moderation queue” for many hours, which does rather spoil the flow of the conversation!
Them:
We’ll keep you posted!
This website uses cookies to improve your experience. We'll assume you're ok with this, but you can opt-out if you wish. Cookie settingsACCEPT
Privacy & Cookies Policy
Privacy Overview
This website uses cookies to improve your experience while you navigate through the website. Out of these, the cookies that are categorized as necessary are stored on your browser as they are essential for the working of basic functionalities of the website. We also use third-party cookies that help us analyze and understand how you use this website. These cookies will be stored in your browser only with your consent. You also have the option to opt-out of these cookies. But opting out of some of these cookies may affect your browsing experience.
Necessary cookies are absolutely essential for the website to function properly. This category only includes cookies that ensures basic functionalities and security features of the website. These cookies do not store any personal information.
Any cookies that may not be particularly necessary for the website to function and is used specifically to collect user personal data via analytics, ads, other embedded contents are termed as non-necessary cookies. It is mandatory to procure user consent prior to running these cookies on your website.