It’s May Day 2021, and just for a change we’re going to start the month off with a pretty picture!
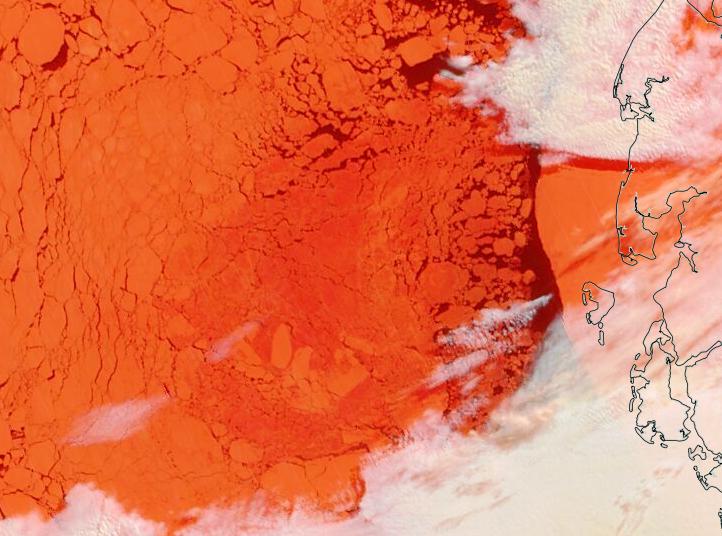
Parts of the Laptev Sea are starting to look distinctly “warm” in the infra-red. Here’s a “false colour” image taken by the Terra satellite during a gap in the clouds:
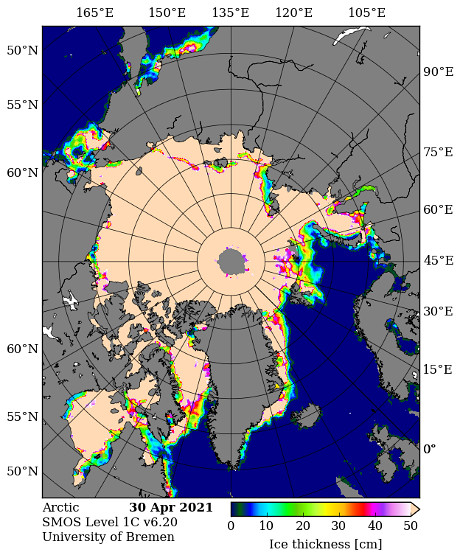
We have reached the time of year when the SMOS “thin ice thickness” readings start being affected by surface melt, but let’s take a look anyway:
That area of the Laptev certainly appears to be either thin or melting.
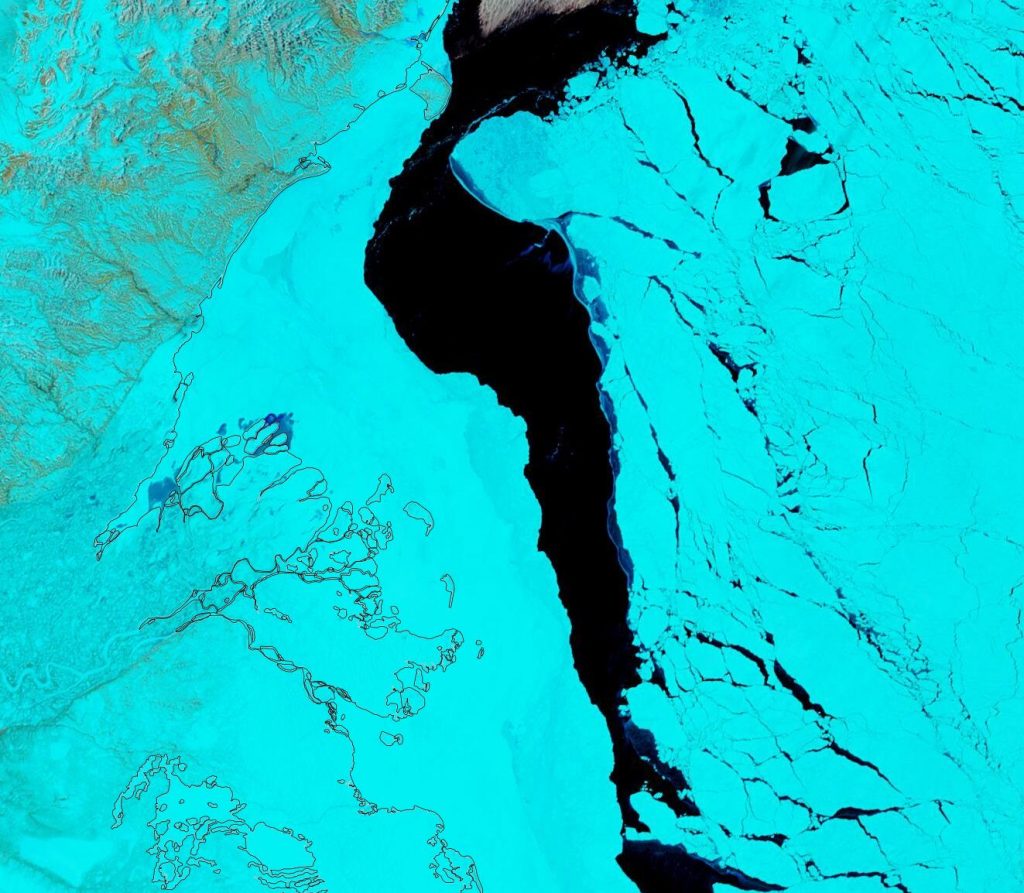
Meanwhile on the Canadian side of the Arctic the fast ice off the Mackenzie Delta is starting to get damp, even though the river itself still looks to be fairly well frozen:
It will also be interesting to follow the progress of this large floe as it heads towards oblivion through the Fram Strait:
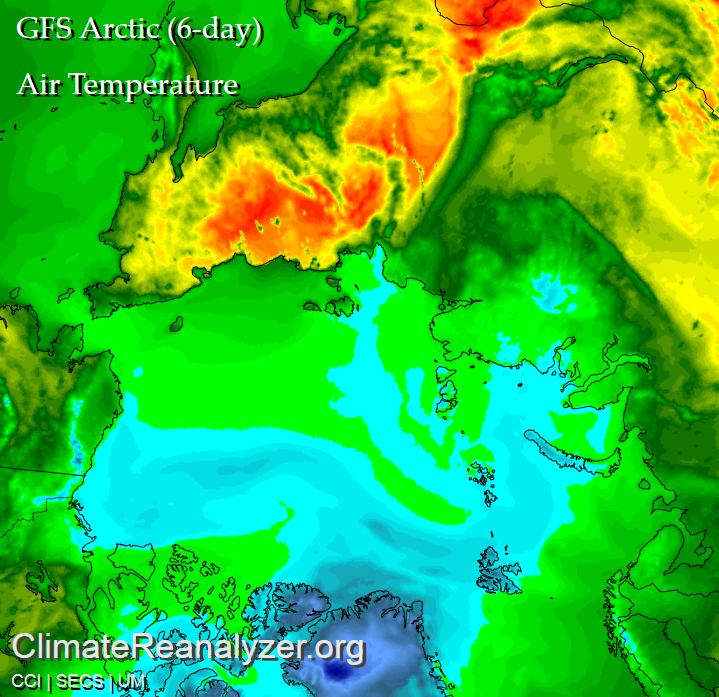
June has arrived, and according to the Great White Con Arctic sea ice calendar that means the summer surface melting season has started. Once July arrives bottom melt should have started in earnest too, but for now let’s stick to the surface. Here’s the Climate Reanalyzer map of Arctic surface air temperatures at 06:00 UTC this morning:
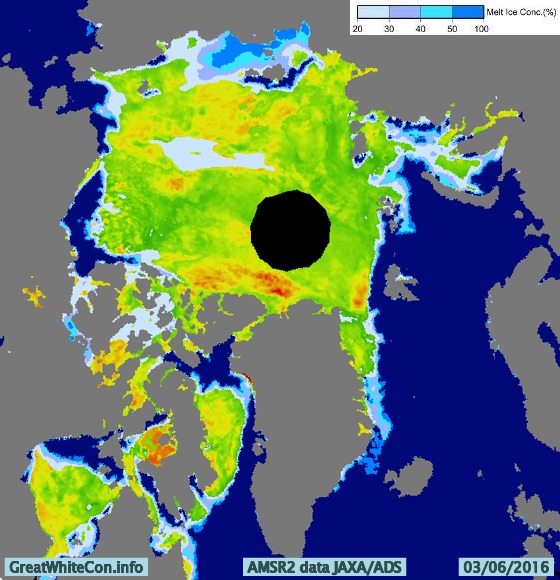
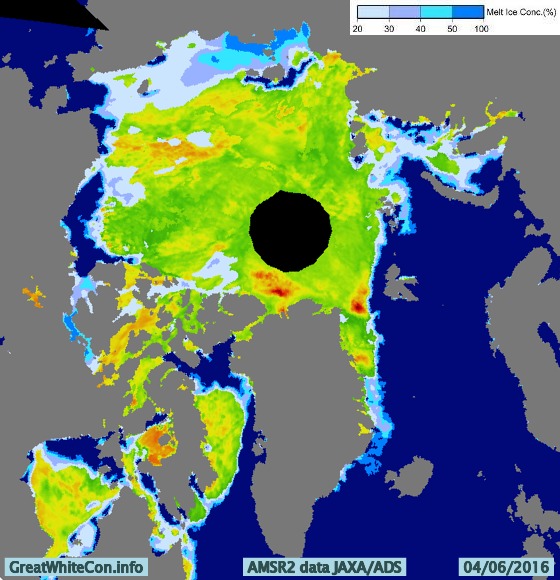
Green areas are above 0 degrees Celsius, and bear in mind that the melting point of sea ice is at around -1.8 degrees Celsius. The red areas near the East Siberian Sea coast are 25-30 degrees Celsius. Given those sort of temperatures you might well think that some snow and/or ice in that area would be melting, and you would be correct! Here is the Japan Aerospace Exploration Agency’s current map of Arctic surface melting:
The assorted shades of blue/grey show the areas where surface melting is already underway. Whilst this melting is taking place you may possibly read in some quarters of the cryodenialosphere that “There is almost no melting going on in the Arctic“. The authors of such nonsense evidently don’t know their proverbial Arctic arse from their elbow.
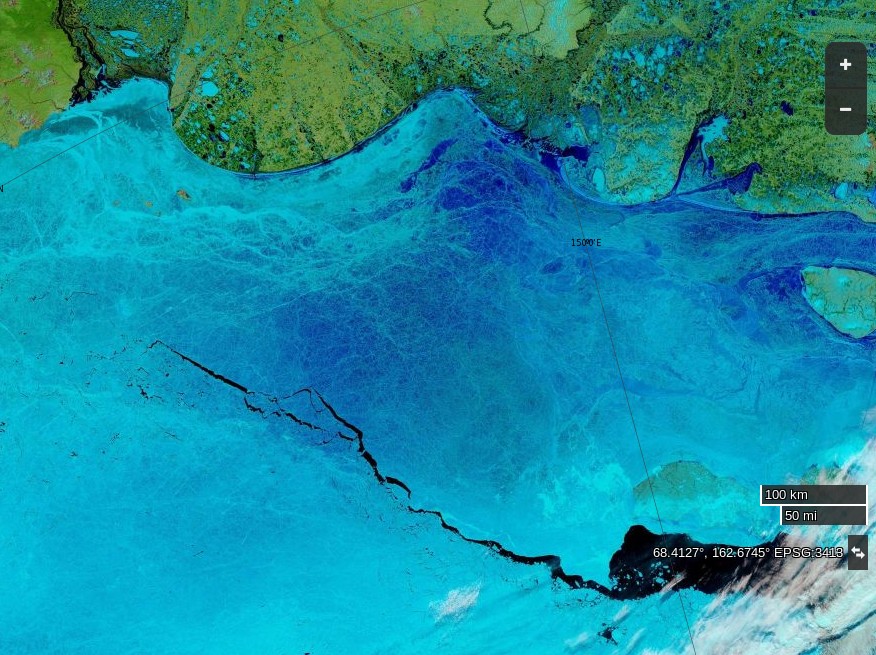
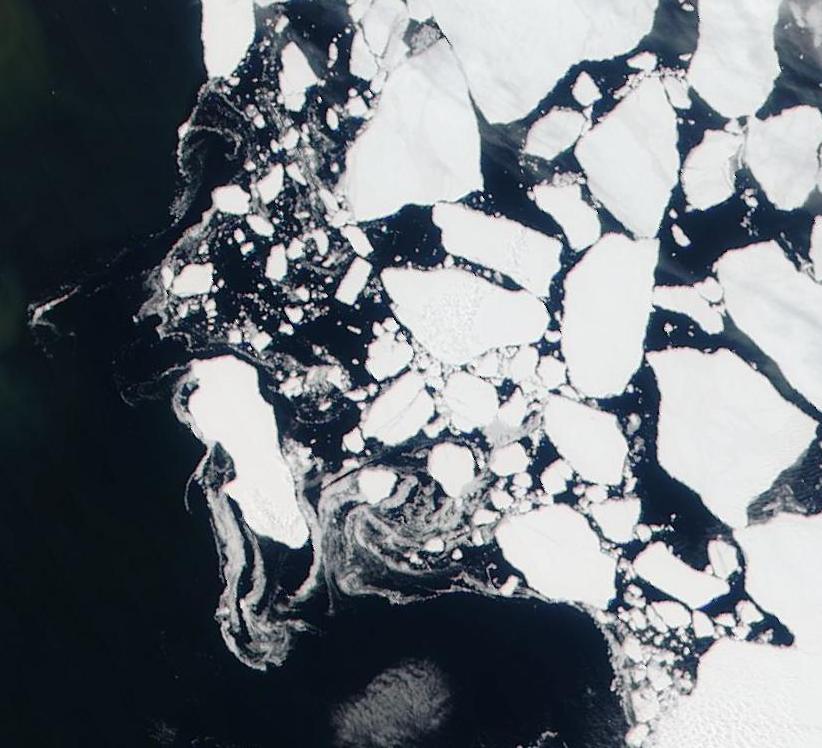
Here’s how today’s surface melting in the East Siberian Sea looks from space:
NASA Worldview “false-color” image of the East Siberian Sea on June 4th 2016, derived from the MODIS sensor on the Terra satellite
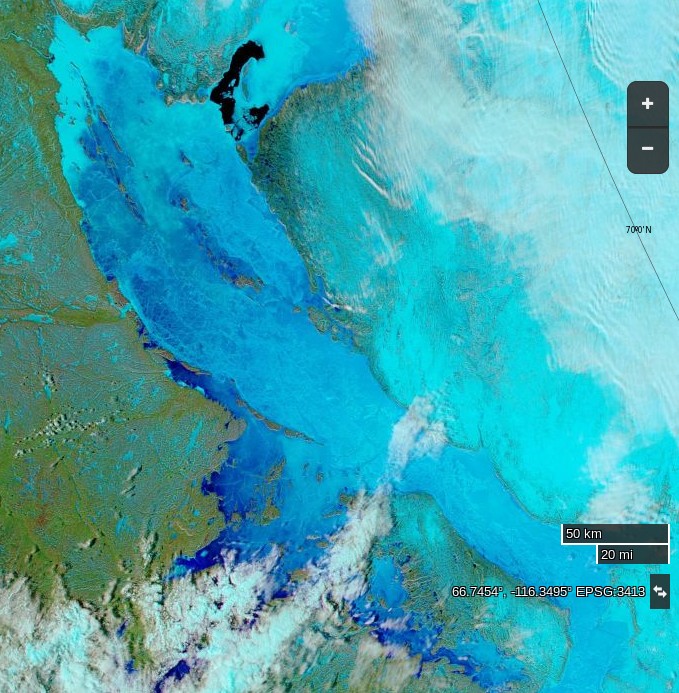
Meanwhile over on the other side of the Arctic, here’s yesterday’s surface melting on “Amundsen’s Route” through the Northwest Passage:
NASA Worldview “false-color” image of the Northwest Passage on June 3rd 2016, derived from the MODIS sensor on the Aqua satellite
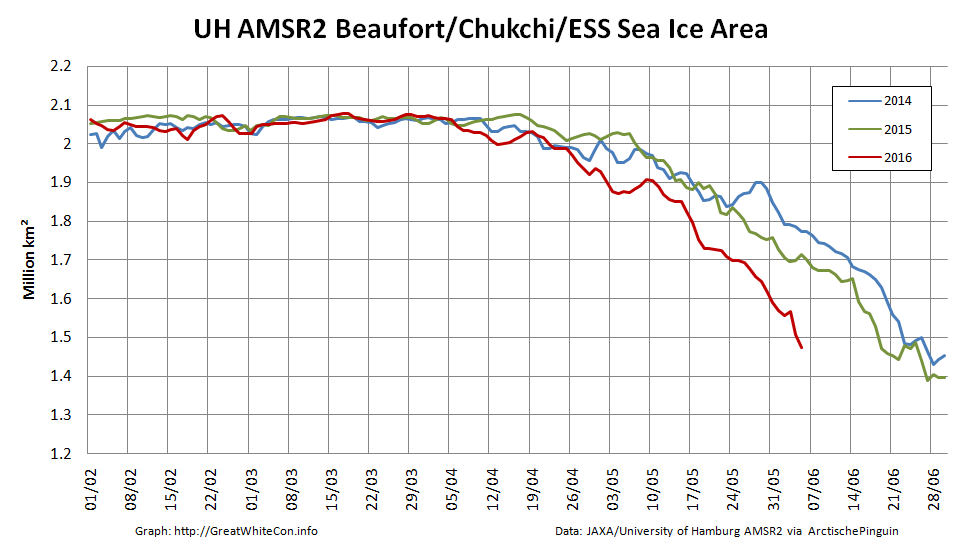
By way of further illustration of the fact that Arctic sea ice is and has been melting, here is a graph of the current area of sea ice in the all important central area of the Arctic Basin, courtesy of “Wipneus” at Arctische Pinguin:
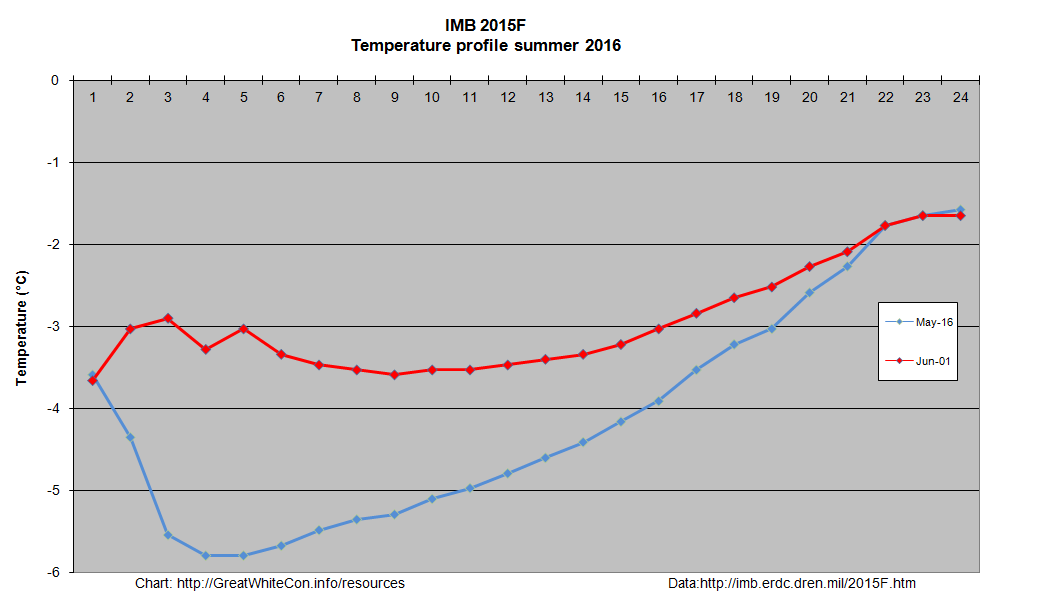
The areas included are the Central Arctic Basin, plus the Beaufort, Chukchi, East Siberian and Laptev Seas. The above zero temperatures are forecast to spread across the Central Arctic Basin early next week, whereupon it will be very interesting to discover what happens to the snow around the single ice mass balance buoy currently transmitting near real time data. Here is the current temperature profile for the sea ice underneath IMB buoy 2015F:
The current conditions there are summarised this morning as:
Pos: 82.00 N, 147.45 W
Air Temp: -3.74 C
Air Pres: 1007.42 mb
Snow depth: 21 cm
Ice thickness: 202 cm
Normally by now there would also be a number of webcams beaming back pictures from across the sea ice in the Arctic Basin. However according to NOAA:
Due to funding constraints, it was not possible to deploy new Web Cams in Spring 2016, but deployments in Spring 2017 are planned.
Three of the camera carrying O-Buoys also seem to have failed over the winter, which leaves us with only O-Buoy 14 to reveal the forthcoming melt to us:
O-Buoy 14 image from June 2nd 2016
O-Buoy 14 is currently colocated with Ice Tethered Profiler 89, the yellow object in the foreground, at 77.49° N, 153.92° W, to the north of the Beaufort Sea. ITP 89 measures the temperature and salinity of the water beneath the sea ice and revealed this the last time it managed to take a measurement, a month or so ago:
If you examine the extreme right hand edge of the charts carefully you will no doubt note that the water underneath the ice has recently become both warmer and saltier.
Watch this space!
[Edit – June 5th 2016]
The latest JAXA/ADS map shows that the area of sea ice undergoing surface melting has increased since yesterday, particularly over the Chukchi Sea:
The recent clouds over the Beaufort Sea cleared yesterday. Here’s a close up view of the open water between the big floes from the Suomi satellite:
This website uses cookies to improve your experience. We'll assume you're ok with this, but you can opt-out if you wish. Cookie settingsACCEPT
Privacy & Cookies Policy
Privacy Overview
This website uses cookies to improve your experience while you navigate through the website. Out of these, the cookies that are categorized as necessary are stored on your browser as they are essential for the working of basic functionalities of the website. We also use third-party cookies that help us analyze and understand how you use this website. These cookies will be stored in your browser only with your consent. You also have the option to opt-out of these cookies. But opting out of some of these cookies may affect your browsing experience.
Necessary cookies are absolutely essential for the website to function properly. This category only includes cookies that ensures basic functionalities and security features of the website. These cookies do not store any personal information.
Any cookies that may not be particularly necessary for the website to function and is used specifically to collect user personal data via analytics, ads, other embedded contents are termed as non-necessary cookies. It is mandatory to procure user consent prior to running these cookies on your website.