Here are some relevant Arctic sea ice metrics. We will continue to update them as the latest figures arrive throughout the rest of today:
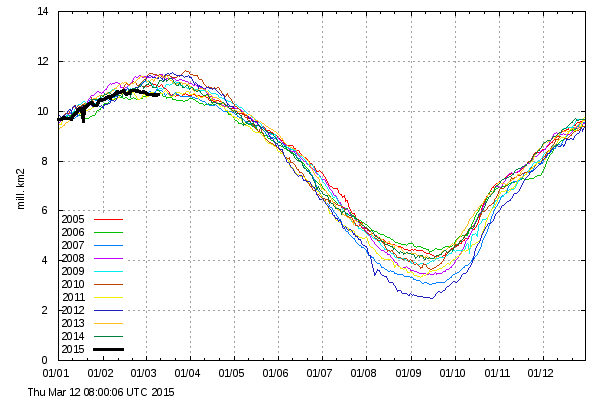
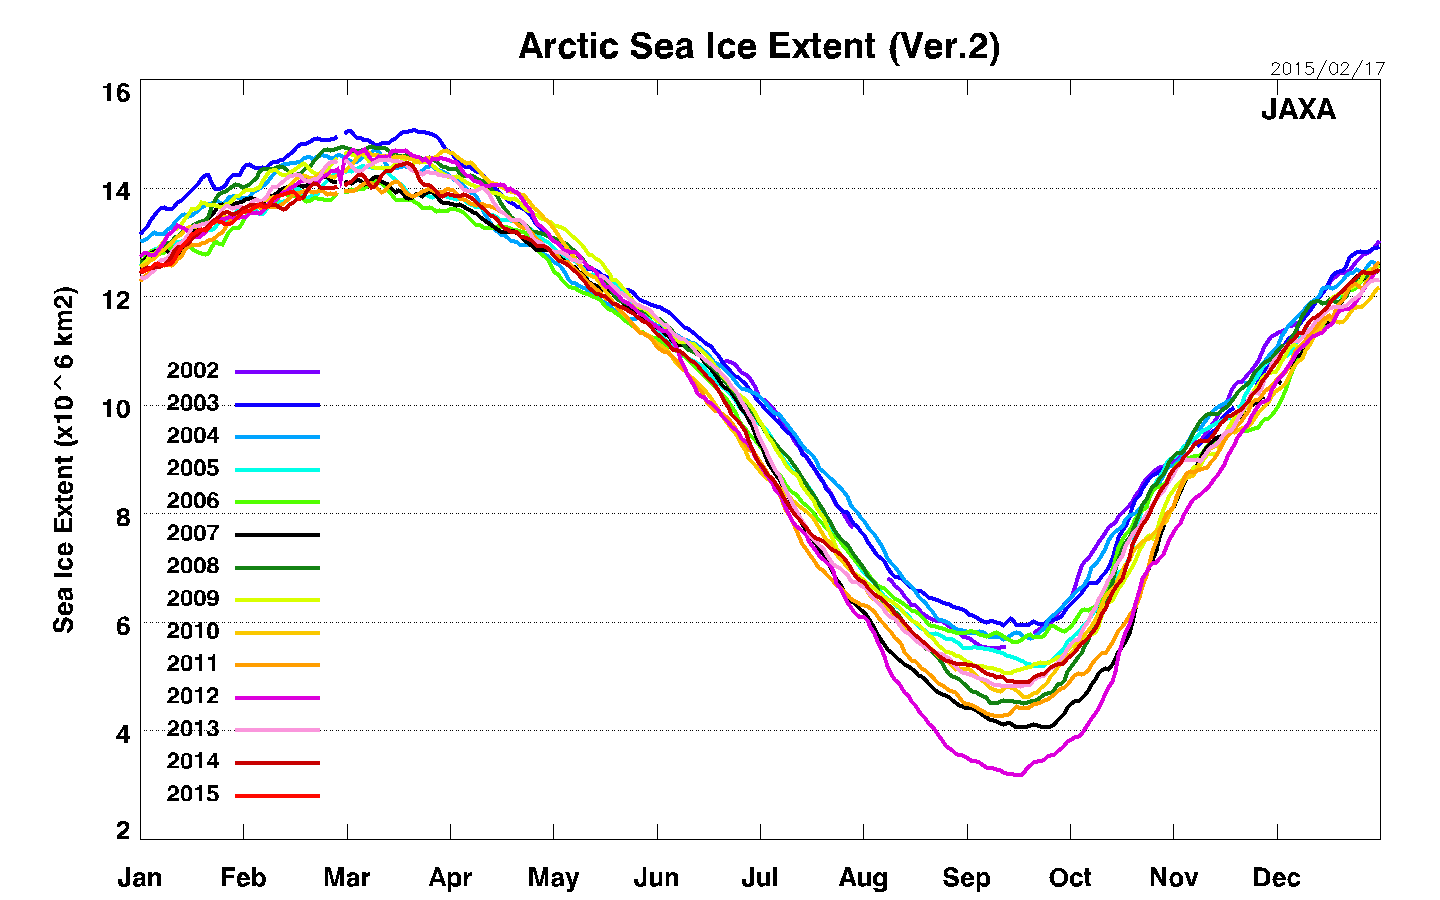
IJIS/JAXA daily extent: 13,648,280 km² – Lowest ever level for the date in records going back to 2003
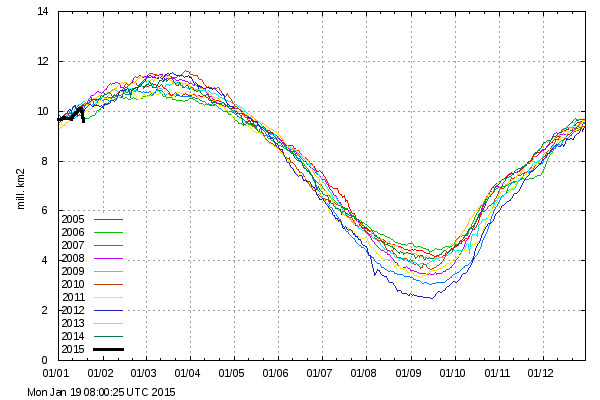
DMI “30%” daily extent: 10,676,900 km² – Lowest ever level for the date in records going back to 2005
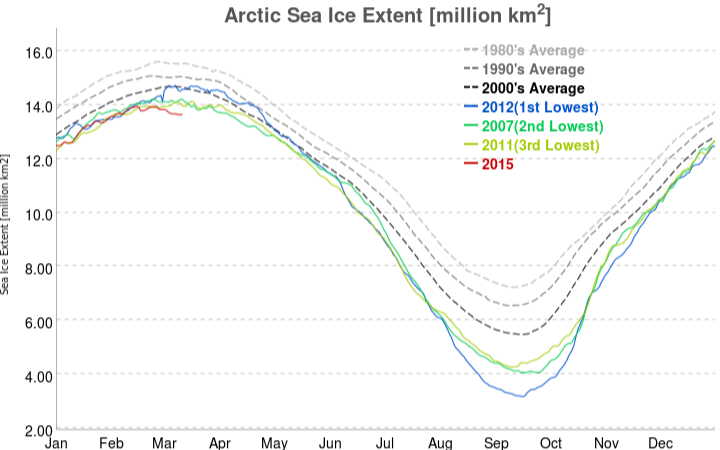
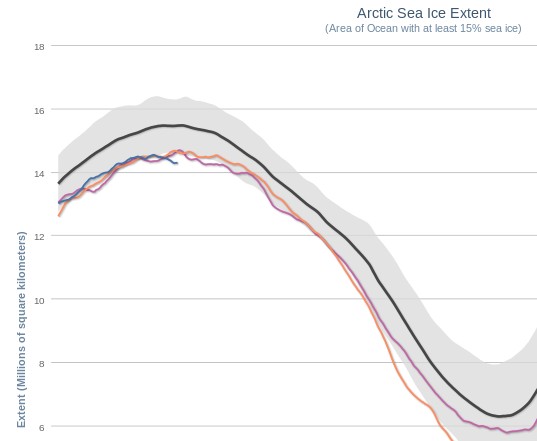
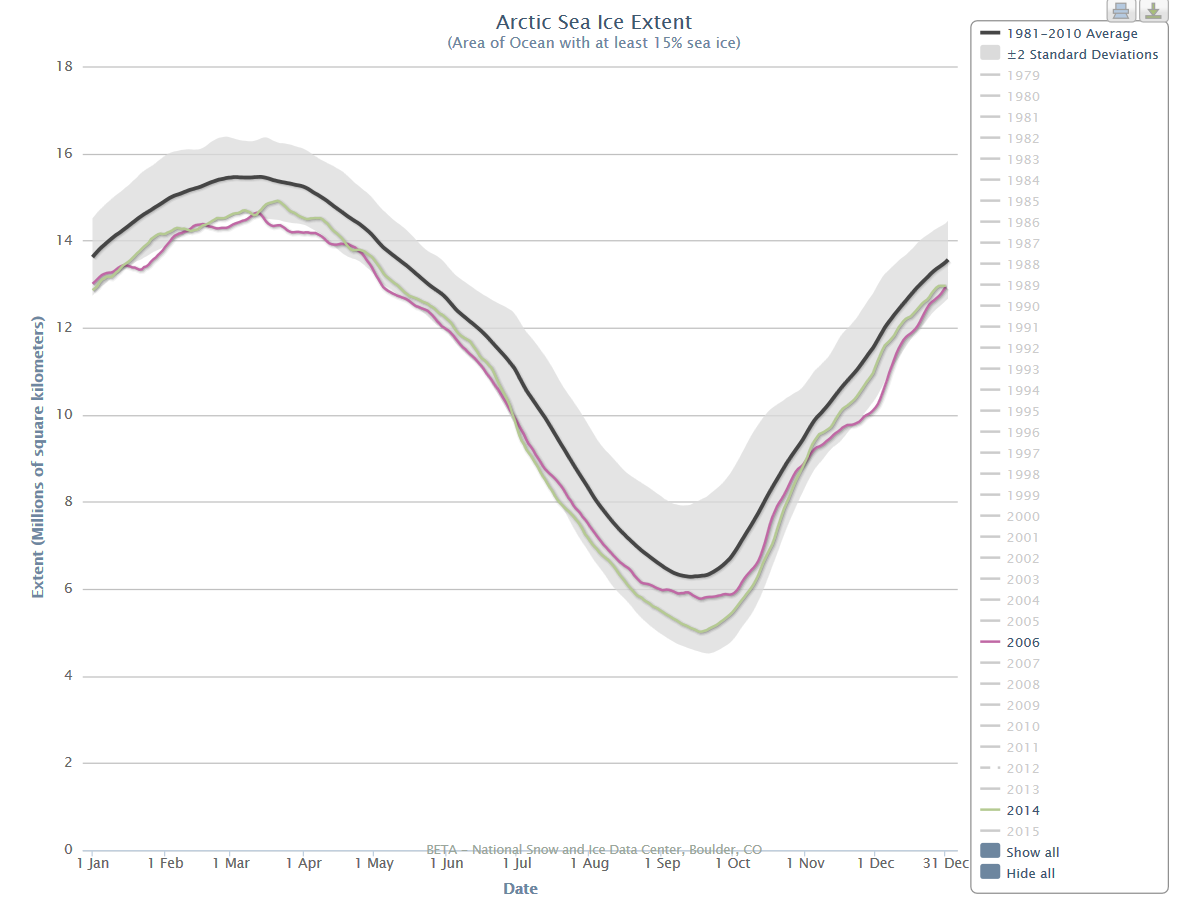
NSIDC daily extent: 14,330,000 km² – Lowest ever level for the date
NSIDC 5 day average extent: 14,280,000 km² – Lowest ever level for the date in records going back to 1979
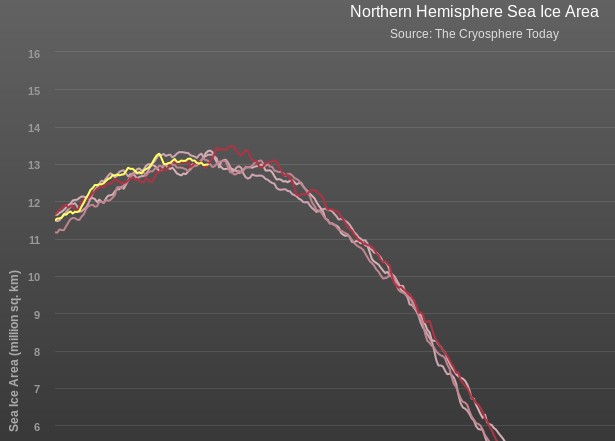
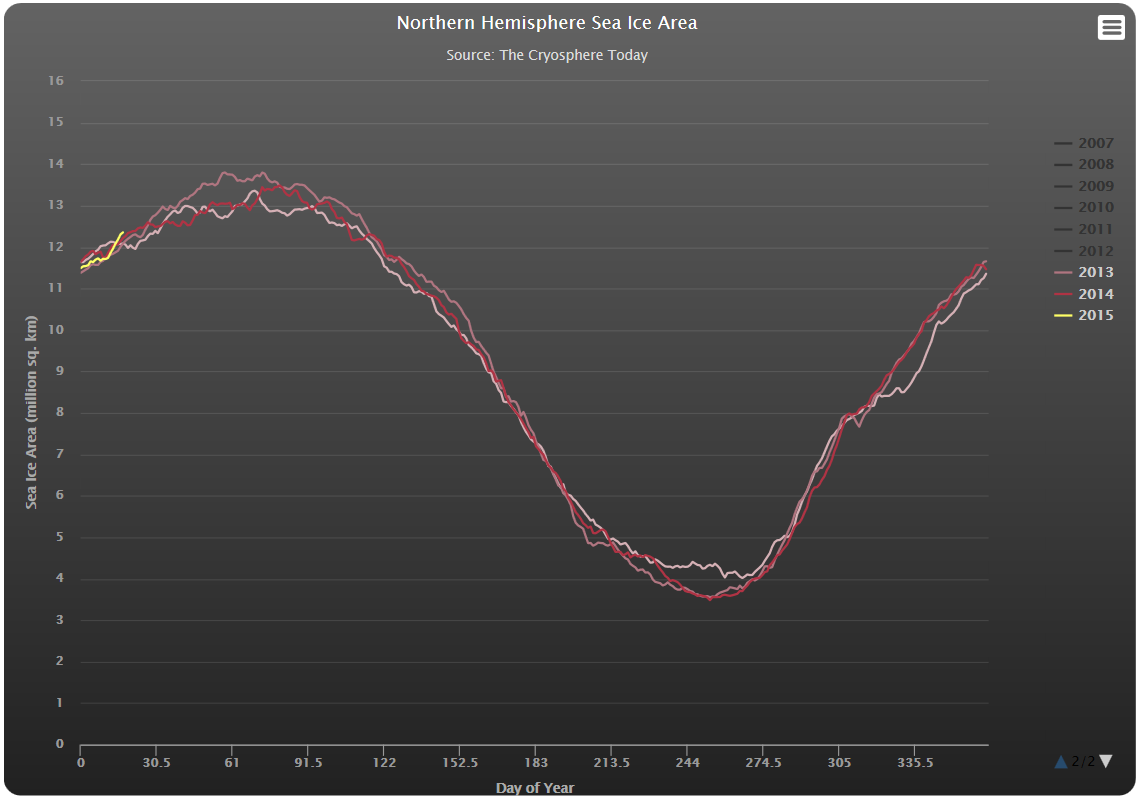
Cryosphere Today daily area: 12,984,410 km² – Lowest ever level for the date in records going back to 1979
You can of course argue that this is mere cherry picking on our part, not to mention the slight economy with the truth in our necessarily punchy headline today. Nonetheless it is an actual fact that the IARC-JAXA Information System AMSR2 Arctic sea ice extent metric for February 17th 2015 reads 13,770,330 km² which is the lowest ever for the day of the year in a record going back to 2003. This follows a remarkably large fall (for the time of year) of 113,505 km² from yesterday’s reading of 13,883,835 km². Here’s our evidence:
If you prefer to look at numbers instead of pictures then by all means try here instead for proof of the latest shock news from the Arctic.
If instead you prefer moving pictures, here’s an animation based on high resolution AMSR2 data from the University of Hamburg that may provide a few clues about how all this came about:
Can you see how the recent storms in the North Atlantic have “pulled” and then “pushed” the sea ice to thisese new record lows?
Please also note this warning message on the IJIS “Arctic Sea Ice Monitor” web page:
Thank you for visiting our website.
This site will be closed on February 22, and might be unstable from February 15, 2015.
New sea ice monitor website will be coming soon. Stay tuned.
Meanwhile, almost equivalent information can be available at:
Further to the cessation of the brief hiatus in my continuing discussions with “Steve Goddard” about “global warming”, the debate has turned to predictions concerning Arctic sea ice metrics during the 2014 melting season.
Firstly here’s a few charts of assorted Arctic sea ice metrics, hot off the virtual presses:
Chart from Cryosphere Today – http://arctic.atmos.uiuc.edu/cryosphere/arctic.sea.ice.interactive.htmlChart from IJIS – http://www.ijis.iarc.uaf.edu/en/home/seaice_extent.htmChart from DMI – http://ocean.dmi.dk/arctic/icecover.uk.phpChart from DMI – http://ocean.dmi.dk/arctic/old_icecover.uk.php
Here’s a table of the minimum value of some of those metrics for a selection of years:
In brief “Al Gore never ‘predicted’ that the Arctic would be ice-free by now!”
Them:
Well, he didn’t say ’22 years from now’, did he? No, he emphasized the most alarmist position he could find.
You can weasel out of this by stating that Gore did not make the prediction ,but he sure as Hell quoted and emphasized it, over any and all other predictions. And in front of the Nobel committee and entire world at that!
So have you confronted Gore over the failed prediction he parroted in Oslo? When you do, you will have a modicum of credibility. Get busy.
Us:
At the risk of repeating myself, “for the benefit of those who seem unable to understand either English or Mathematics a ‘projection’ is not the same thing as a ‘prediction’”
Getting back to Tony’s predictions, and using the NSIDC daily extent numbers for the moment, would you say that 4.98339 is “exactly” 5.74877? How about “close”?
Them:
Actually, no, your chart is less clear. Steve’s has all the years and it is clear his prediction is correct. Yours does not. Nor does yours have a legible legend. Another snow white lie.
Us:
Have you by any chance tried clicking on my chart? Does that help at all?
At the risk of repeating myself, would you say that 4.98339 is “exactly” 5.74877? How about “close”?
Them:
What bearing does 2013’s minimum have on goddard’s prediction for 2014? Are you a half-wit in addition to being a mentally ill stalker & transvestite?
Us:
What bearing does 2014’s maximum have on 2014’s minimum?
Are you blind?
Them:
You seem to think that some random number you came up with has some bearing on the subject at hand. Hint: it’s why we think you’re mentally ill.
Us:
Of course they’re not random numbers. To save you the bother of doing your own research please feel free to take a look at:
Stark, it’s not about random numbers, it’s about random harassment. This clown takes no issue with ridiculous ‘projections’ delivered by alarmist zealots on a world stage, instead he haunts this site moaning about near misses.
But you are right about the mentally ill bit.
Us:
The conversation about the non-random Arctic numbers has at last taken a statistical turn over at:
I note that you are still dodging the question there too.
Them:
We’ll keep you posted!
This website uses cookies to improve your experience. We'll assume you're ok with this, but you can opt-out if you wish. Cookie settingsACCEPT
Privacy & Cookies Policy
Privacy Overview
This website uses cookies to improve your experience while you navigate through the website. Out of these, the cookies that are categorized as necessary are stored on your browser as they are essential for the working of basic functionalities of the website. We also use third-party cookies that help us analyze and understand how you use this website. These cookies will be stored in your browser only with your consent. You also have the option to opt-out of these cookies. But opting out of some of these cookies may affect your browsing experience.
Necessary cookies are absolutely essential for the website to function properly. This category only includes cookies that ensures basic functionalities and security features of the website. These cookies do not store any personal information.
Any cookies that may not be particularly necessary for the website to function and is used specifically to collect user personal data via analytics, ads, other embedded contents are termed as non-necessary cookies. It is mandatory to procure user consent prior to running these cookies on your website.