Tag Archives: ICESat-2

The 2023 Arctic Report Card

The 2023 Arctic Report Card has been published by the US National Oceanic and Atmospheric Administration (NOAA). All sorts of things are discussed in the report, but sticking to Snow White’s speciality of sea ice here’s an extract:

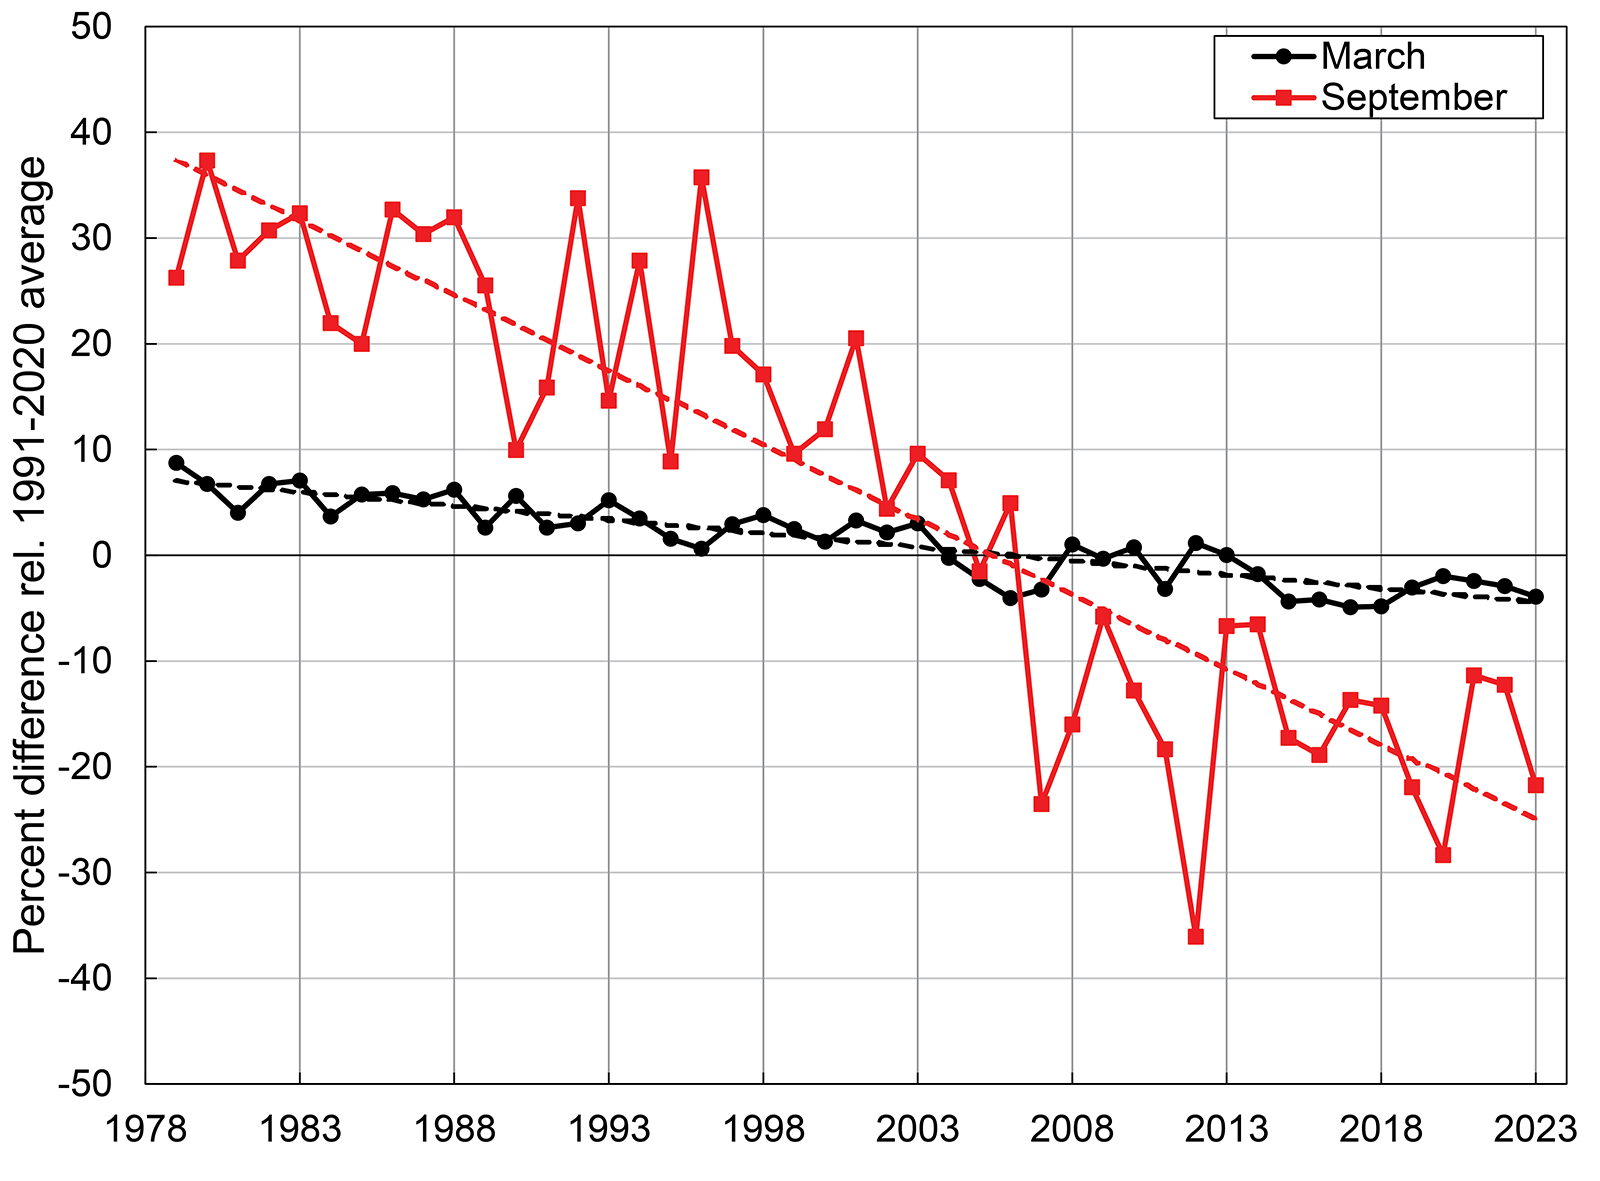
This satellite record tracks long-term trends, variability, and seasonal changes from the annual extent maximum in late February or March and the annual extent minimum in September. Extents in recent years are ~50% lower than values in the 1980s. In 2023, March and September extents were lower than other recent years, and though not a new record low, they continue the long-term downward trends:

March 2023 was marked by low sea ice extent around most of the perimeter of the sea ice edge, with the exception of the East Greenland Sea where extent was near normal. At the beginning of the melt season, ice retreat was initially fairly slow through April. In May and June, retreat increased to a near-average rate, and then accelerated further through July and August. By mid-July, the ice had retreated from much of the Alaskan and eastern Siberian coast and Hudson Bay had nearly melted out completely. In August, sea ice retreat was particularly pronounced on the Pacific side, opening up vast areas of the Beaufort, Chukchi, and East Siberian Seas. Summer extent remained closer to average on the Atlantic side, in the Laptev, Kara, and Barents Seas

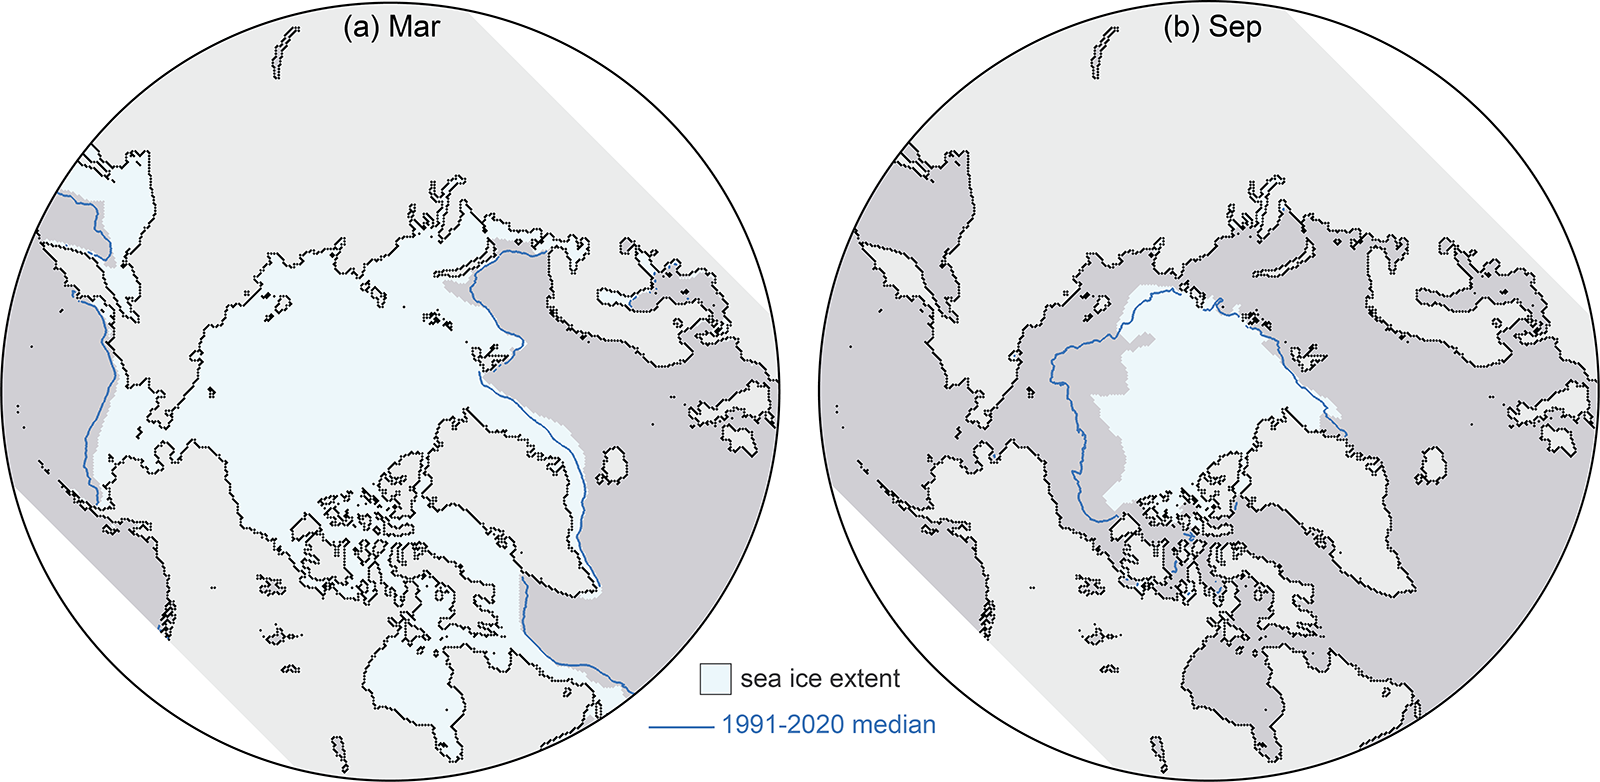
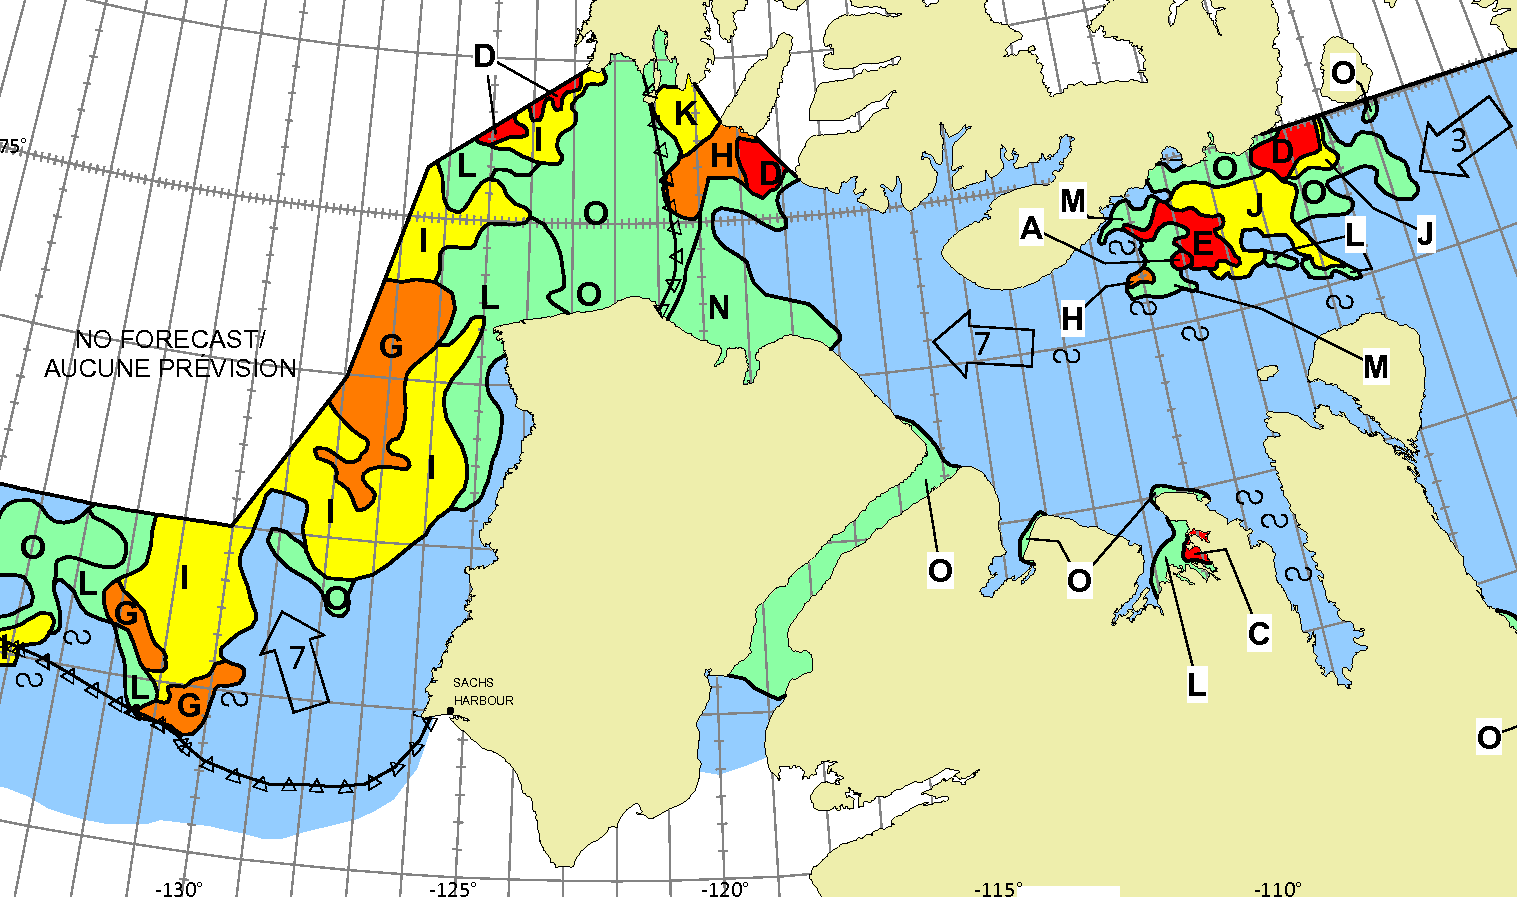
The Northern Sea Route, along the northern Russian coast, was relatively slow to open as sea ice extended to the coast in the eastern Kara Sea and the East Siberian Sea, but by late August, open water was found along the coast through the entire route. The Northwest Passage through the Canadian Archipelago became relatively clear of ice, though ice continued to largely block the western end of the northern route through M’Clure Strait through the melt season. Nonetheless, summer 2023 extent in the Passage was among the lowest observed in the satellite record, based on Canadian Ice Service ice charts.

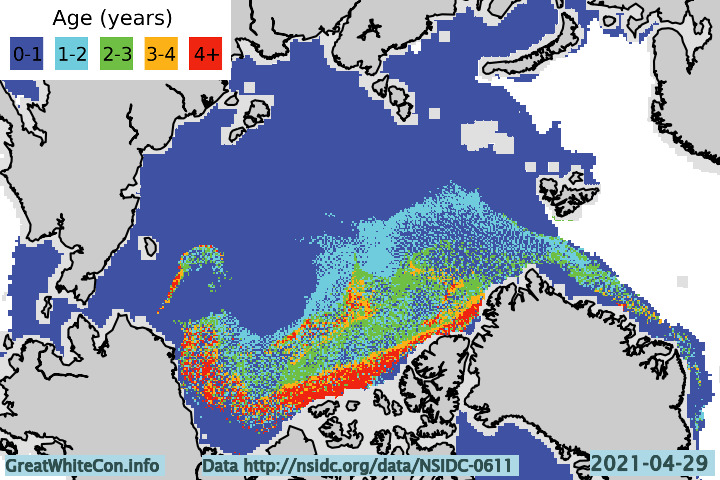
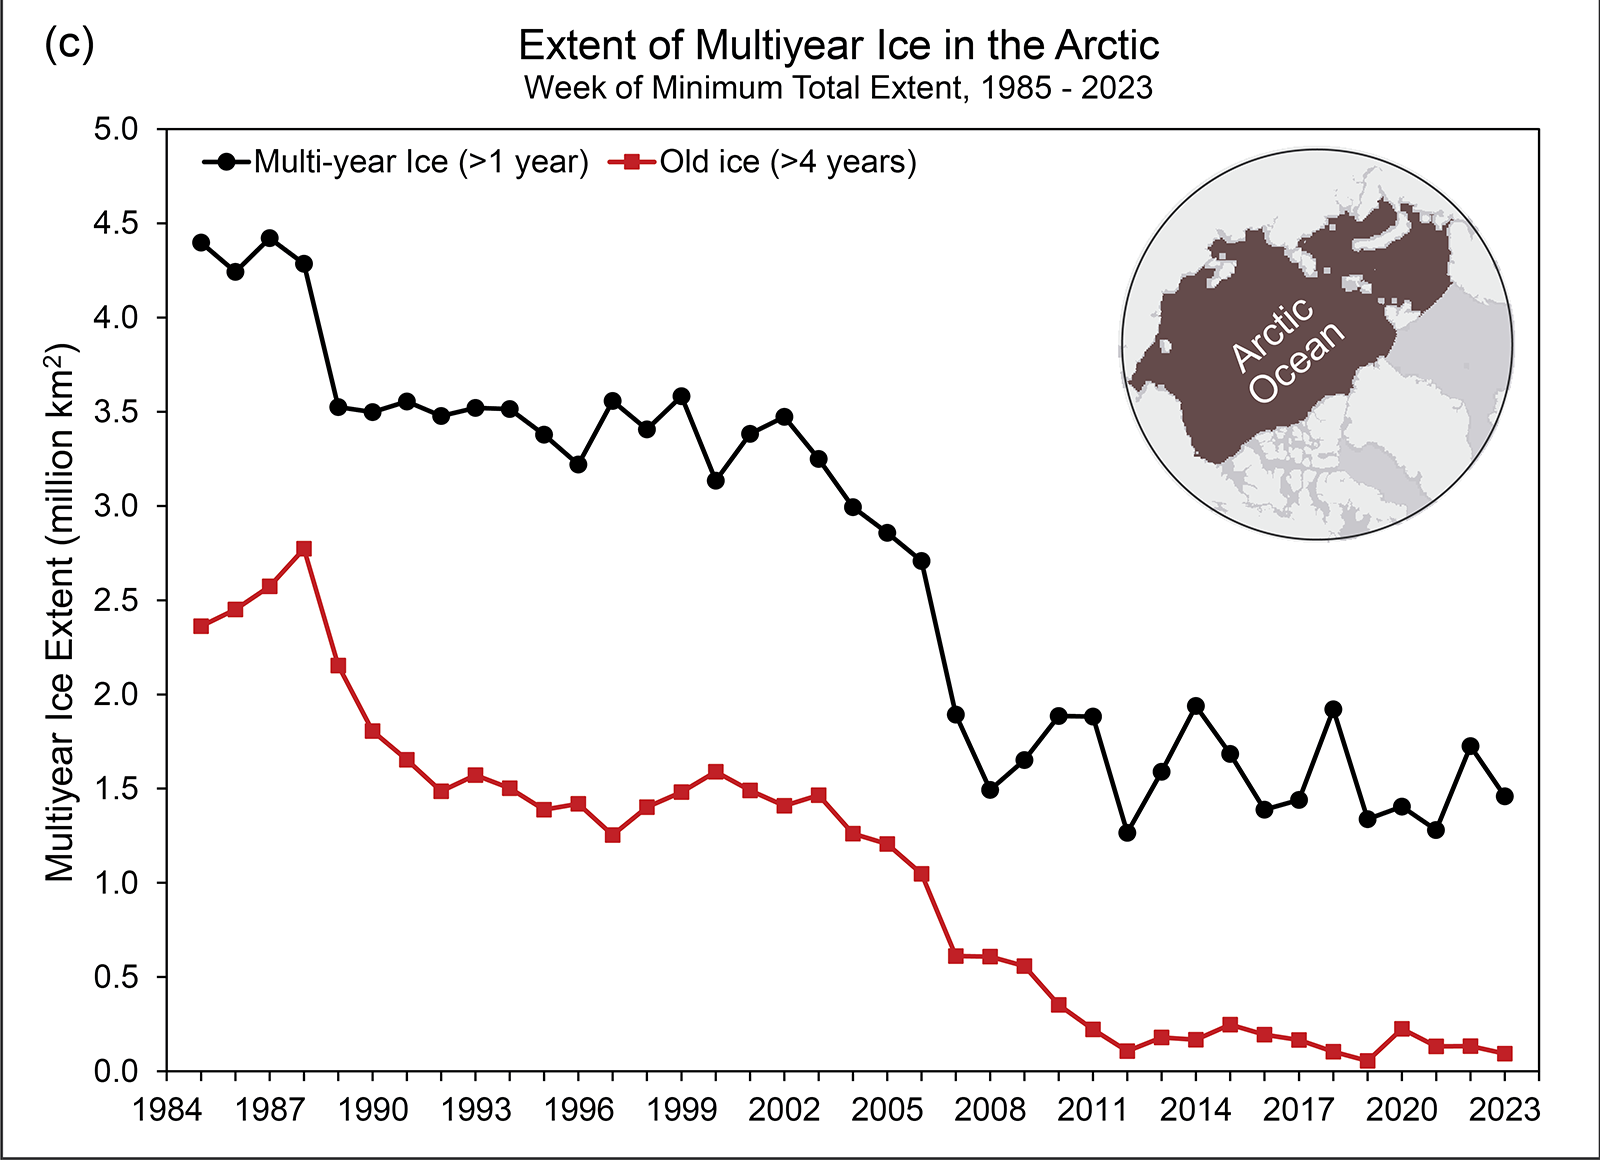
Tracking the motion of ice in passive microwave imagery using feature tracking algorithms can be used to infer sea ice age. Age is a proxy for ice thickness because multiyear ice generally grows thicker through successive winter periods. Multiyear ice extent has shown interannual oscillations but no clear trend since 2007, reflecting variability in the summer sea ice melt and export out of the Arctic. After a year when substantial multiyear ice is lost, a much larger area of first-year ice generally takes its place. Some of this first-year ice can persist through the following summer, contributing to the replenishment of the multiyear ice extent:

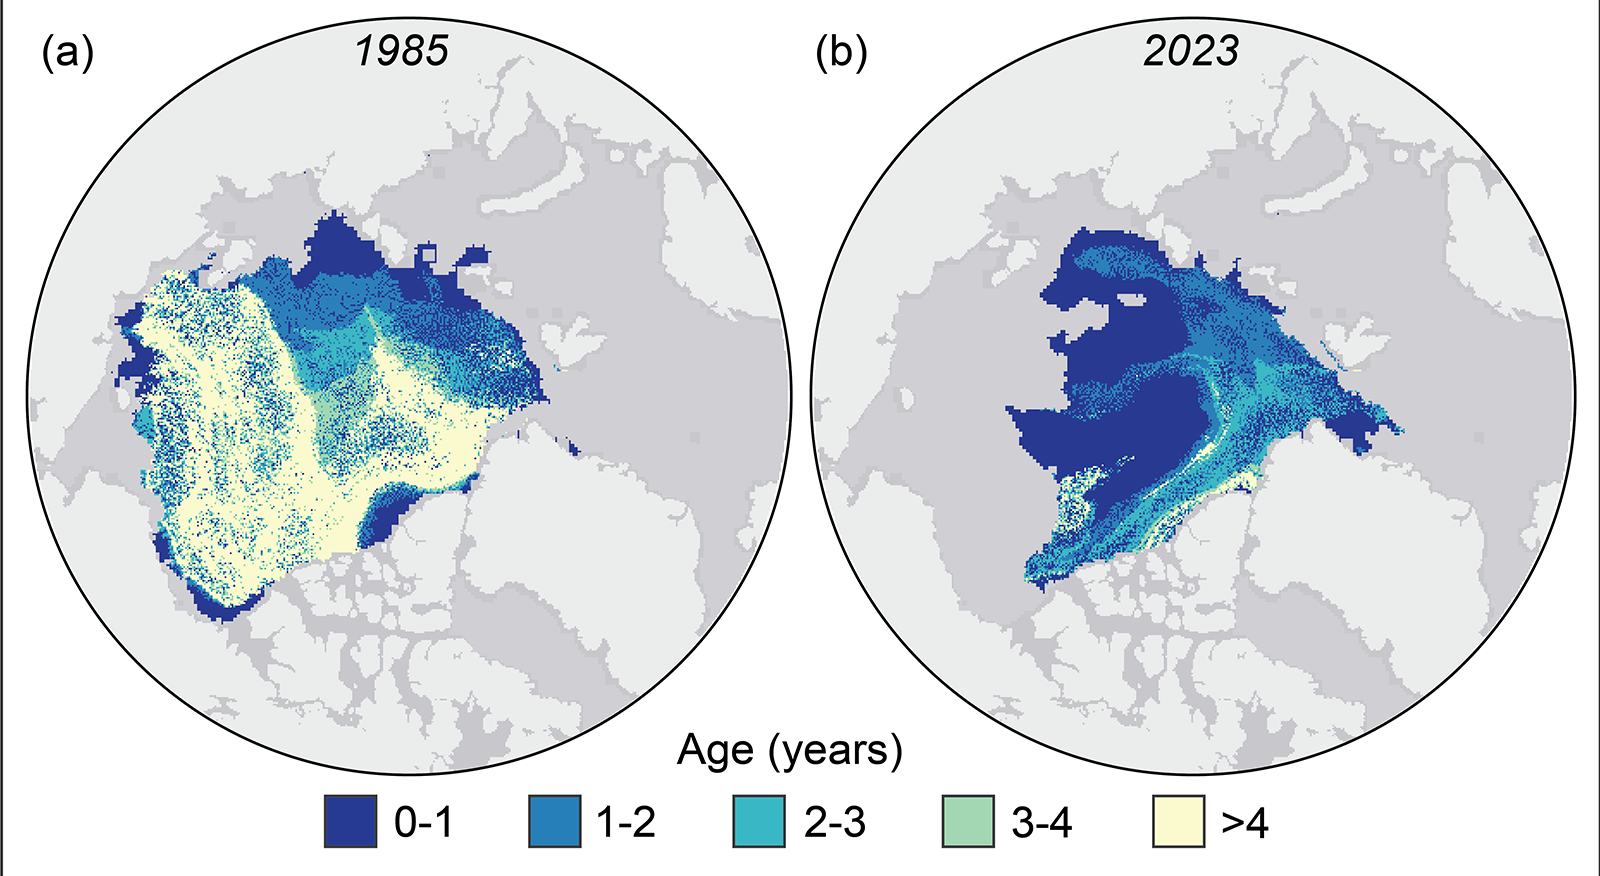
However, old ice (here defined as >4 years old) has remained consistently low since 2012. Thus, unlike in earlier decades, multiyear ice does not remain in the Arctic for many years. At the end of the summer 2023 melt season, multiyear ice extent was similar to 2022 values, far below multiyear extents in the 1980s and 1990s:

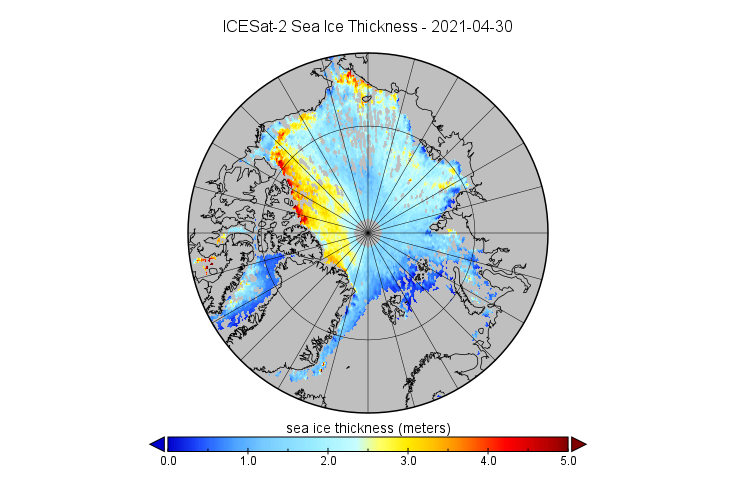
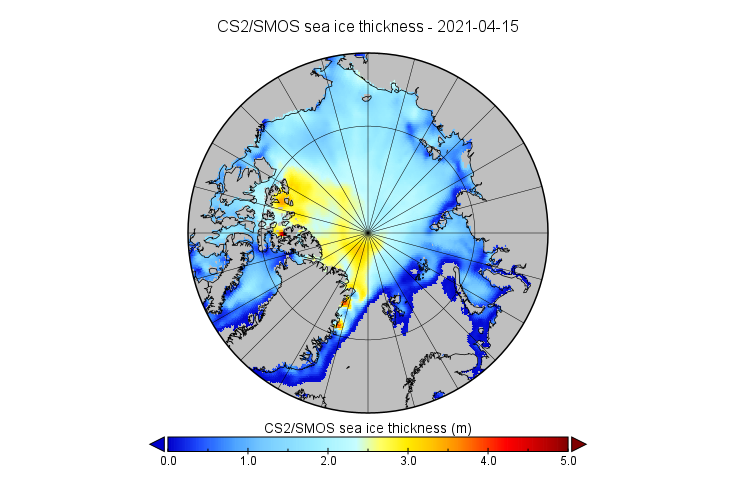
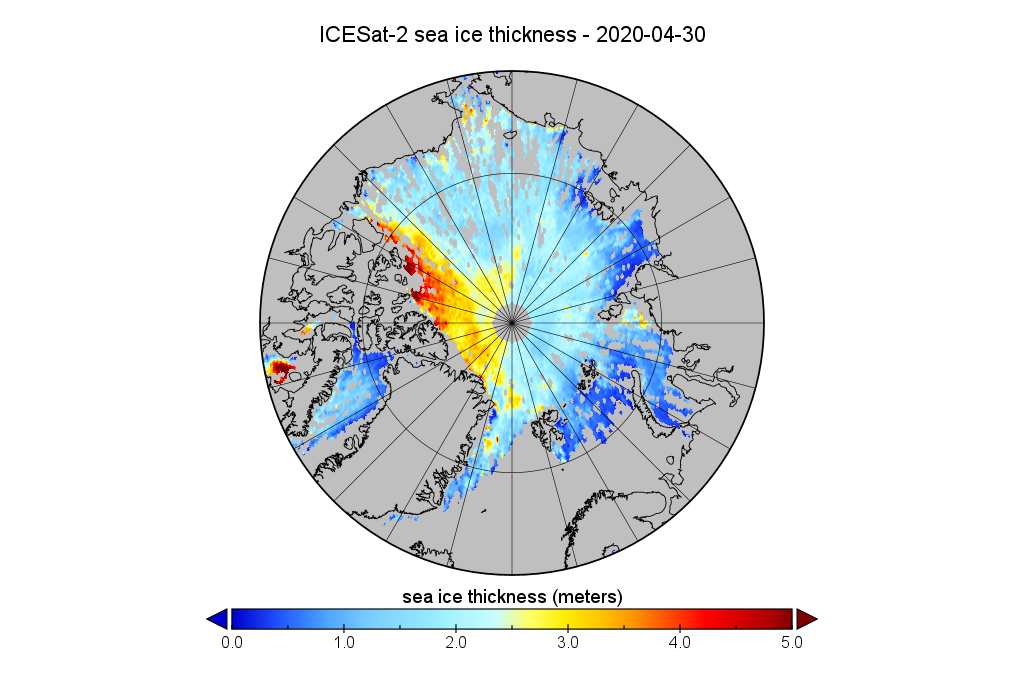
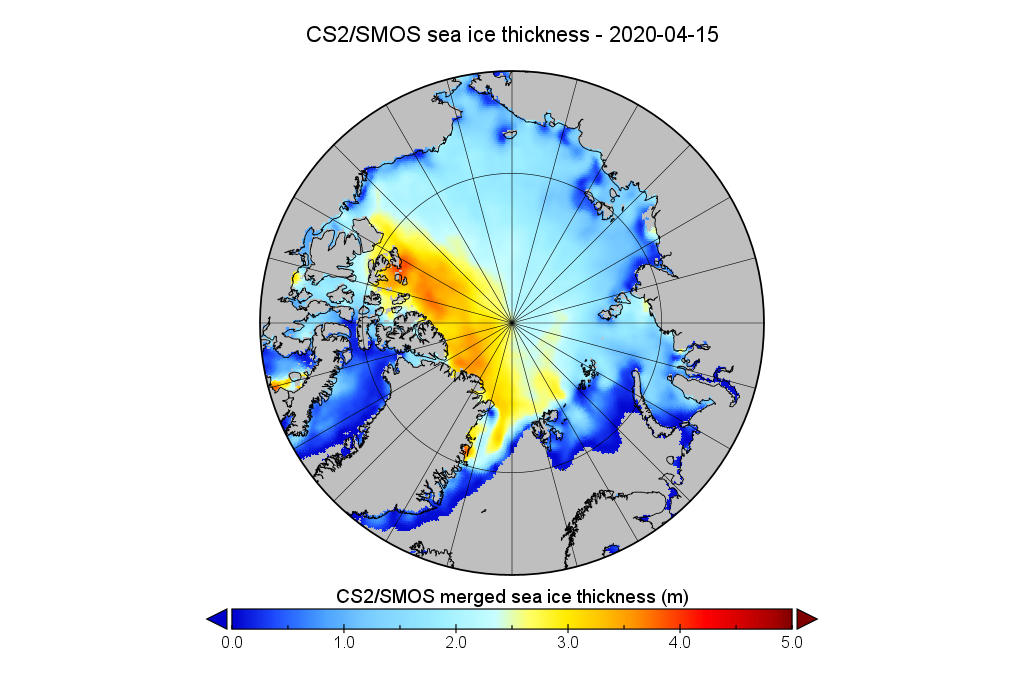
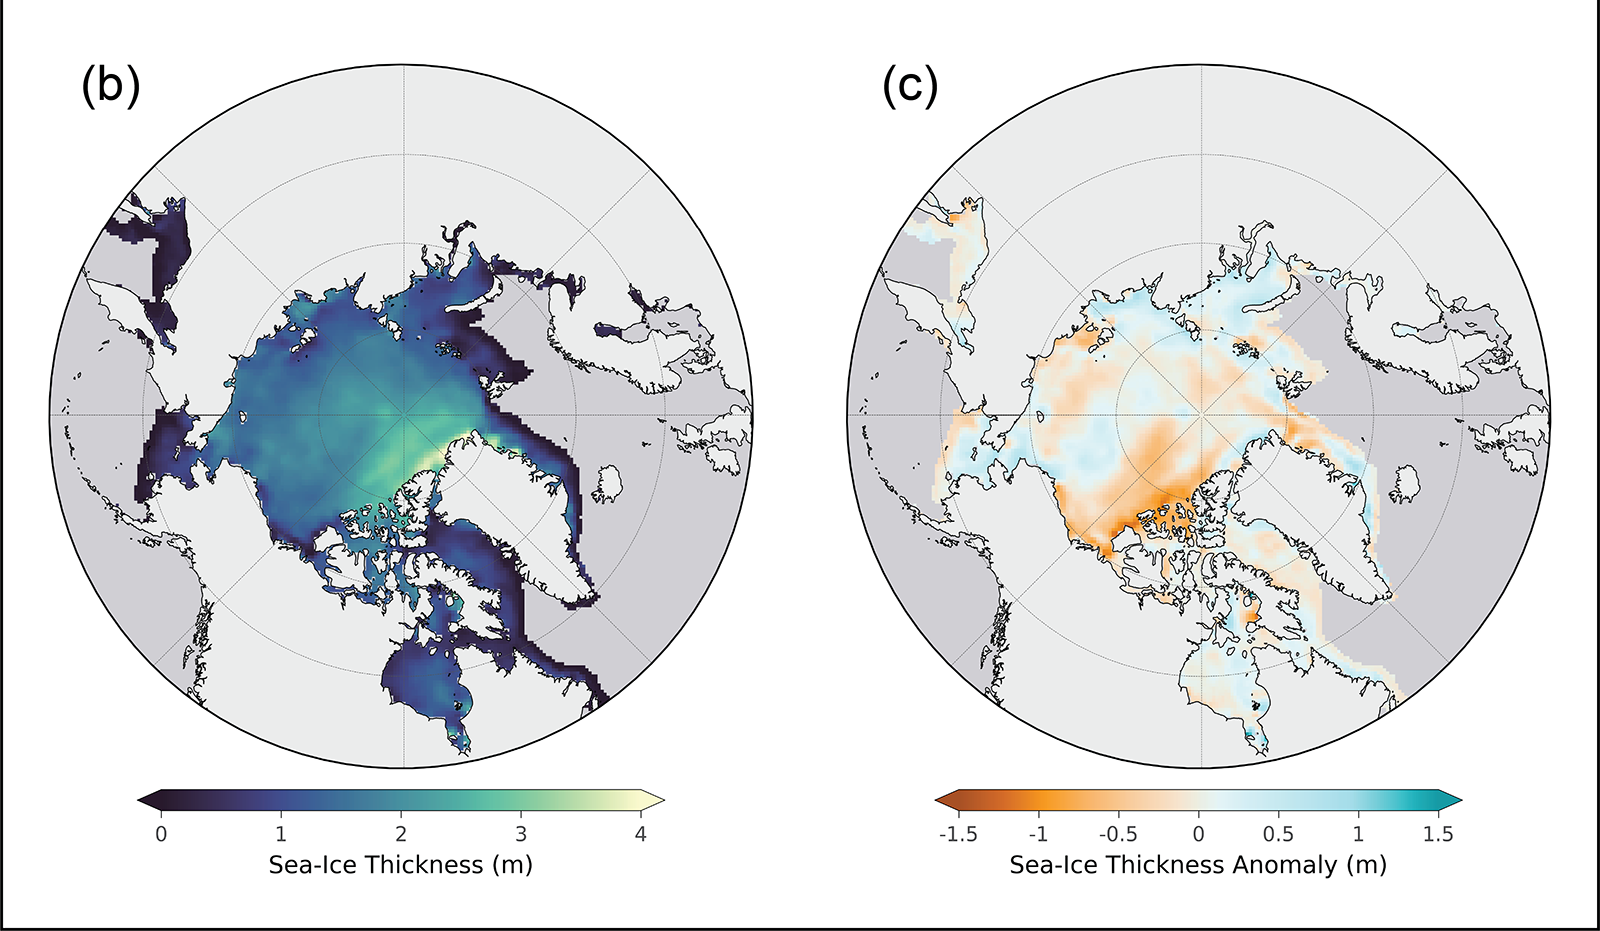
Estimates of sea ice thickness from satellite altimetry can be used to more directly track this important metric of sea ice conditions, although the data record is shorter than for extent and ice age. Data from ICESat-2 and CryoSat-2/SMOS satellite products tracking the seasonal October to April winter ice growth over the past four years (when all missions have been in operation) show a mean thickness generally thinner than the 2021/22 winter but with seasonal growth typical of recent winters:

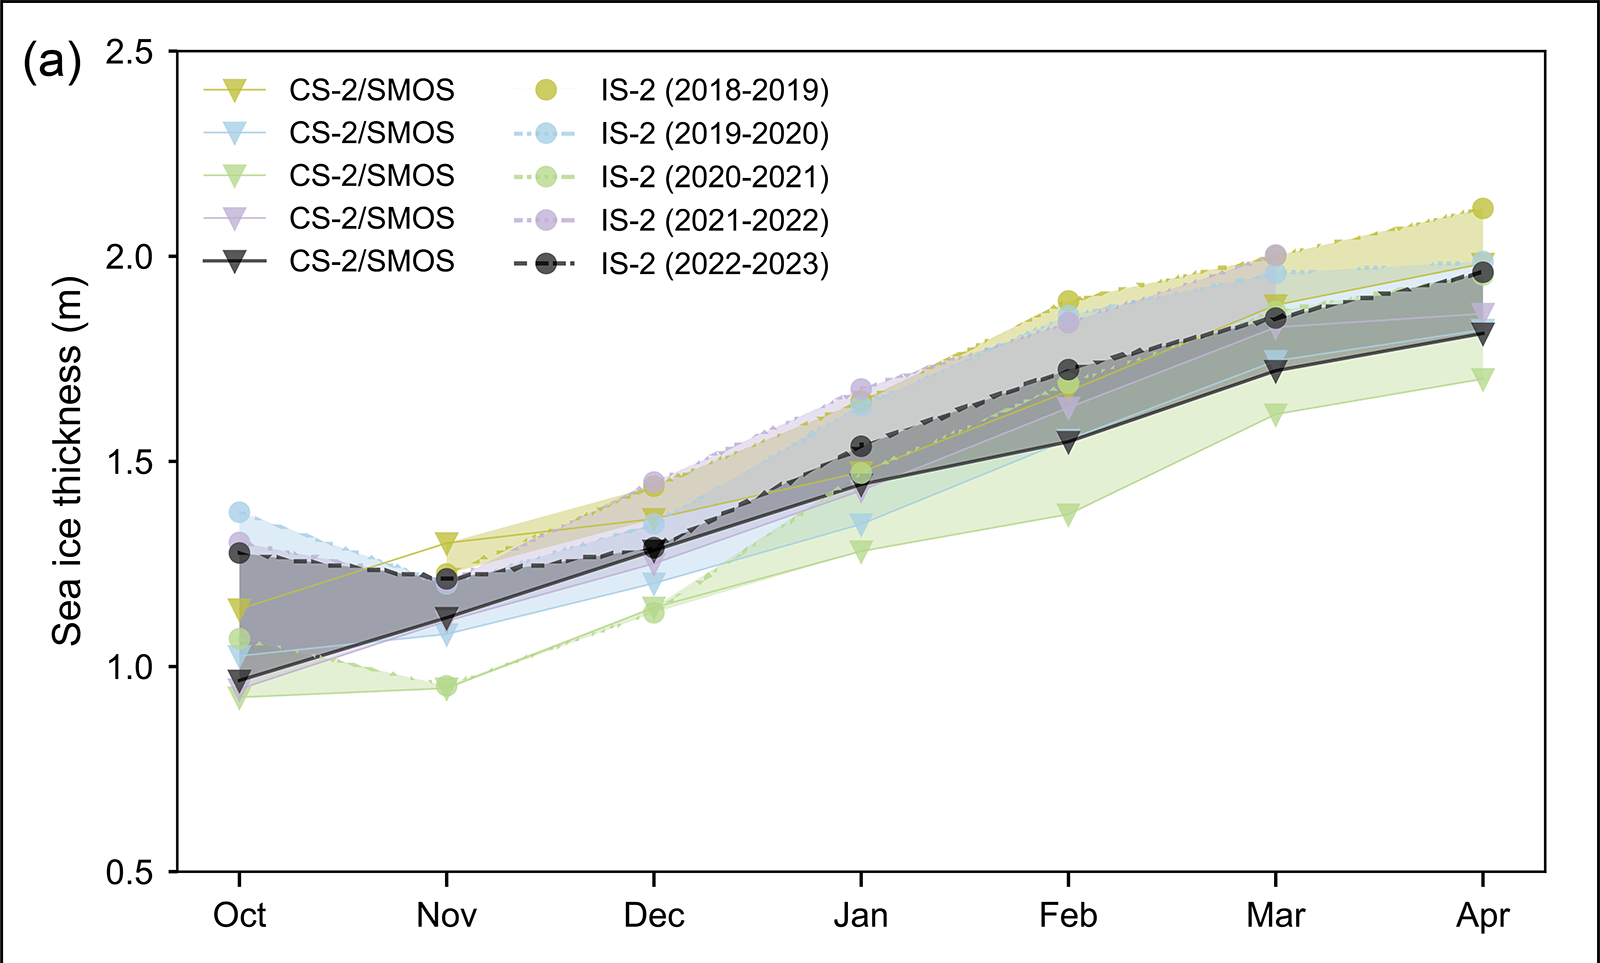
April 2023 thickness from CryoSat-2/SMOS relative to the 2011-22 April mean shows that the eastern Beaufort Sea and the East Siberian Sea had relatively thinner sea ice than the 2011-22 mean, particularly near the Canadian Archipelago. Thickness was higher than average in much of the Laptev and Kara Seas and along the west and northwest coast of Alaska, extending northward toward the pole. The East Greenland Sea had a mixture of thicker and thinner than average ice:

An excellent analysis (IMHO!), but I do have one quibble. I was following events in the Northwest Passage very closely last summer, and according to the Canadian Ice Service on September 1st:

ICESat-2 2021 Sea Ice Thickness

We reported on the first ICESat-2 sea ice thickness data to be released back in May. We are now very pleased to be able to reveal that the data up to April 2021 is now available for download from the NSIDC web site. Here’s a visualisation of April’s data:

For comparison purposes here’s the CryoSat-2/SMOS equivalent:

ICESat-2 looks to have captured the arm of thicker ice extending across the Beaufort Sea suggested by sea ice age data better than CryoSat-2:

However thickness data is totally absent where leads are absent, in land-fast ice for example. It seems that near real time ICESat-2 processing isn’t available as yet, but we await the release of the data for October with barely bated breath!

Watch this space!

Steven Koonin’s Unsettled Greenland Ice Sheet Science

For our latest review of Steven E. Koonin’s new book, “Unsettled”, we’re moving from the ice covering the Arctic seas on to land. Greenland to be specific. Unlike Arctic sea ice the Greenland Ice Sheet does merit a mention in the book. In fact it’s one of the bullet points Steve leads with on page 2:

Here are three more [climate facts] that might surprise you, drawn directly from recent published research or the latest assessments of climate science published by the US government and the UN:

  • Humans have had no detectable impact on hurricanes over the past century.
  • ​Greenland’s ice sheet isn’t shrinking any more rapidly today than it was eighty years ago.
  • The net economic impact of human-induced climate change will be minimal through at least the end of this century.

So what gives?

A very good question Steve, because if we stick with the Arctic land ice referred to in the middle bullet, Professor Koonin makes no reference at this juncture to any “recent published research or latest assessment of climate science” to justify his assertion.

Which is a bit of a shame since in the Climate Feedback critique of Professor Koonin’s statement which was mentioned in our introductory article, Twila Moon from the United States’ National Snow and Ice Data Center points out that:

This statement is untrue. In fact, the Greenland Ice Sheet lost more mass during 2003-2010 than during all of 1900-2003 combined. This is evident in the following figure from Kjeldsen et al. (2015)

This image has an empty alt attribute; its file name is Greenland-Kjeldsen-2015-1024x713.png
Surface elevation change rates in Greenland during 1900-1983 (a), 1983-2003 (b), and 2003-2010 (c). The numbers listed below each panel are the integrated Greenland-wide mass balance estimates expressed as gigatonnes per year and as millimetre per year GMSL (global mean sea level) equivalents.

If we look in more detail at changes over 1972-2018, we can further see that the ice sheet was mostly in balance (gain about the same amount of snow/ice in winter as is lost in summer) during the 1970s and 1980s [Mouginot and Rignot et al. (2019)]. It was only in the mid-1990s that Greenland ice loss began to increase more substantially.

Over the last 20 years, ice loss has been rapid and large, creating measurable sea level rise, which we experience as increases in coastal erosion, flooding, problems with water and sewer systems at the coasts, and saltwater inundation of freshwater sources.

So how is it possible for Steve Koonin to have got his facts so wrong? For his attempt at justification we have to wait until chapter 8 of “Unsettled” on the subject of “Sea Level Scares”. On page 160 of my Kindle edition Steve writes:

So future global sea level rise is uncertain not only because of all of the model uncertainties in the global temperature rise discussed in Chapter 4, but also because the dynamics of the Greenland and Antarctic ice sheets are quite uncertain. The IPCC summarizes the situation (SMB is the Surface Mass Balance, measuring the net change in ice due to atmospheric processes): . . .

“For periods prior to 1970, significant discrepancies between climate models and observations arise from the inability of climate models to reproduce some observed regional changes in glacier and GIS [Greenland Ice Sheet] SMB around the southern tip of Greenland. It is not clear whether this bias in climate models is due to the internal variability of the climate system or deficiencies in climate models. For this reason, there is still medium confidence in the ability of climate models to simulate past and future changes in glaciers mass loss and Greenland SMB.”

The reference for this quotation is given as “IPCC SROCC Section 4.2.2.2.6“, which on inspection is entitled “Budget of global mean sea level change”. The immediate question that springs to my mind is “Why didn’t Steve refer to SROCC Section 1.4.2?”. That section is entitled “Observed and Projected Changes in the Cryosphere”, and skipping over the Arctic sea ice section for the moment it states:

AR5 assessed that the annual mean loss from the Greenland ice sheet very likely substantially increased from 34 (-6–74) Gt yr–1 (billion tonnes yr–1) over the period 1992–2001, to 215 (157–274) Gt yr–1 over the period 2002–2011.

Or Steve might have quoted from Section 4.2.2.2.4 “Greenland and Antarctic ice sheets”, but for some reason he didn’t:

Frequent observations of ice sheet mass changes have only been available since the advent of space observations (see Section 3.3.1). In the pre-satellite era, mass balance was geodetically reconstructed only for the GIS (Kjeldsen et al., 2015)

op. cit., or as suggested there he could even have quoted from Section 3.3.1 “Ice Sheet Changes”, but once again he didn’t:

The GIS was close to balance in the early years of the 1990s (Hanna et al., 2013; Khan et al., 2015), the interior above 2000 m altitude gained mass from 1961 to 1990 (Colgan et al., 2015) and both coastal and ice sheet sites experienced an increasing precipitation trend from 1890 to 2012 and 1890 to 2000 respectively (Mernild et al., 2015), but since the early 1990s multiple observations and modelling studies show strong warming and an increase in runoff (very high confidence).

Personally I have very high confidence that Professor Koonin had great difficulty cherry picking a Greenland Ice Sheet quote from the IPCC that could be “spun” into supporting his case. Frankly his “southern tip of Greenland” effort smacks of desperation.

Unsettling, is it not?

[Edit – June 12th]

Here’s a long thread on Twitter from Helen Fricker, explaining the genesis of the IPCC’s Special Report on the Ocean and Cryosphere in a Changing Climate. Essential reading for Steve Koonin, since he is apparently unaware of any of this!

Helen refers to her recent op-ed for The Hill which goes into slightly more detail:

The upcoming sixth IPCC report in 2022 will contain updated projections of future sea level rise based on tens of different simulations provided by research groups around the world. These groups all worked together in a community-led effort, involving ice sheet, ocean and atmosphere modeling and observational teams.

We have come a long way, but even after all this we are still playing “catch-up,” and there are still gaps in our understanding. We do know, however, that the ocean is warming and that both Antarctica and Greenland are vulnerable to this warming. The same goes for the atmosphere. We worry that the biggest portion of Antarctica, East Antarctica — which we still think of as a sleepy giant since it is so thick and vast, making it harder for warming ocean waters and increasing air temperatures to reach it — is starting to show signs of change. We also worry that there may be mechanisms, that we have not been able to witness in the modern record and hence that are not in the models, that may amplify the ice loss. Scientists are using paleo-reconstructions to figure out whether these may be important.

Still, we can say with confidence that sea level will continue to rise (faster) in the future and that our projections are conservative estimates. Indeed, satellite observations that measure the changing height (altimetry) and changing mass (gravimetry) of ice sheets are tracking the worst-case predictions from IPCC’s fifth report.

As we gather more data, both on and around the ice sheets using all available tools, including satellites, our observational record gets longer and our understanding improves. As our understanding improves, our models get better. Long-term measurements, sometimes acquired by launching new satellites (such as NASA’s ICESat-2 and other follow-on missions), coordinated modeling and international collaboration are key to delivering more accurate predictions, so that coastal communities can make informed decisions to protect infrastructure and citizens and manage resources.

ICESat-2 Gridded Sea Ice Thickness

It’s been a long wait since NASA launched the ICESat-2 satellite in September 2018:

However some good news has arrived at long last! ICESat-2 level 4 monthly gridded Arctic sea ice thickness data is now available for download via the NSIDC:

https://nsidc.org/data/IS2SITMOGR4

Now for the bad news. Currently it’s only available from 1 November 2018 to 30 April 2020 . There also seems to be an absence of data in summer, just like CryoSat-2.

Here is my first visualisation of the most recent data, for April 2020:

Here is the equivalent from AWI’s CryoSat-2/SMOS gridded thickness product for comparison purposes: