Dr Harrison [was] asked about climate skeptics and he goes on to say that they are not worth debating their viewpoint as it’s “like mud wrestling with pigs. Firstly you get covered in mud and secondly, the pig loves it” he then goes on to say he won’t debate skeptics because geographers don’t debate with people who think the world is flat and biologists don’t debate with people who think evolution isn’t happening or that the world is only 6000 years old.
Us:
Fresh from indulging in some “mud wrestling” with Anthony Watts myself, I felt compelled to contribute my own two new pence worth to the ongoing “debate”:
I don’t know if this counts as “mud wrestling with pigs” but here at WUWT seems to be no place to “engage in a fair public debate”. By way of example see:
I don’t like it when an anonymous moderator snips a comment without a good reason. In your case it was done improperly. I am sorry about that.
Sincerely,
Us:
Thanks for your note. I previously hadn’t the faintest inkling that you are one of the moderators at WUWT, let alone a senior one. It did however seem to me that your comment on the “Mud wrestling” thread deserved to be balanced by recounting my own recent experience on the “Study” thread.
That said, my riposte to GreggB’s long list of wholly unjustified accusations remains “snipped”, and my request for Anthony to reveal his sources remains unanswered, so I remain an unhappy bunny!
Stung by some unusually constructive criticism from Anthony Watts we have (somewhat hurriedly) added several new pages to the Great White Con “Resources” section of this web site. They contain the sort of information that is rather tricky to update automatically on a daily basis, and concentrate on resources that help the interested searcher after truth get a handle on the thickness and hence volume of the sea ice in the Arctic, on a regional as well as pan Arctic scale.
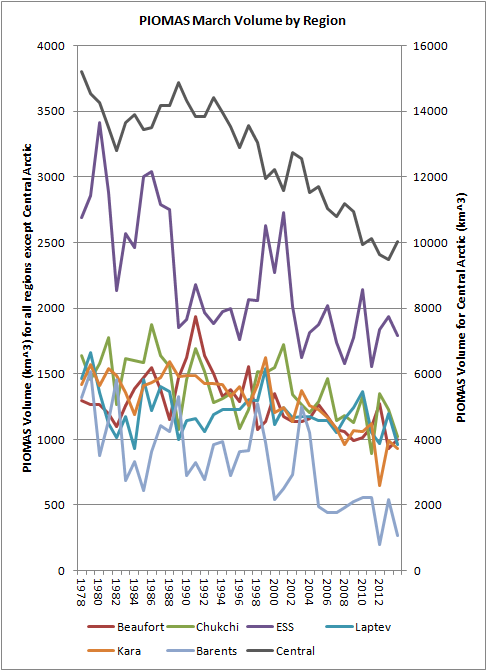
The first section is entitled “Arctic Sea Ice Graphs“, and here’s an example of one graph which reveals the ice volume in various regions of the Arctic, based on the output of the PIOMAS model:
The second section is entitled “Ice Mass Balance Buoys“. As the name hopefully suggests, this section displays data reported by the Cold Regions Research and Engineering Laboratory’s currently active ice mass balance buoys in a variety of novel formats. These buoys are deployed on a regular basis at selected locations across the Arctic, and report on a number of different parameters including snow depth, ice thickness and temperature. By way of example here’s a couple of reports from IMB 2013F, which was originally deployed last August on what was then classified as “first year” ice in the Beaufort Sea. First of all here’s the Google Maps/Earth view that reveals how the buoy has moved around the Arctic since then, and shows how clicking on one of the “pushpins” reveals the values of a variety of interesting metrics on a daily basis:
Google map of the movement of IMB 2013F
As you can see, last August the thickness of the ice floe that the buoy is located upon was 1.4 metres thick. If you click through to the live map and experiment you will discover, amongst a variety of other things, that the ice under the buoy is now 1.68 meters thick, with an additional 49 cm of snow on top of that.
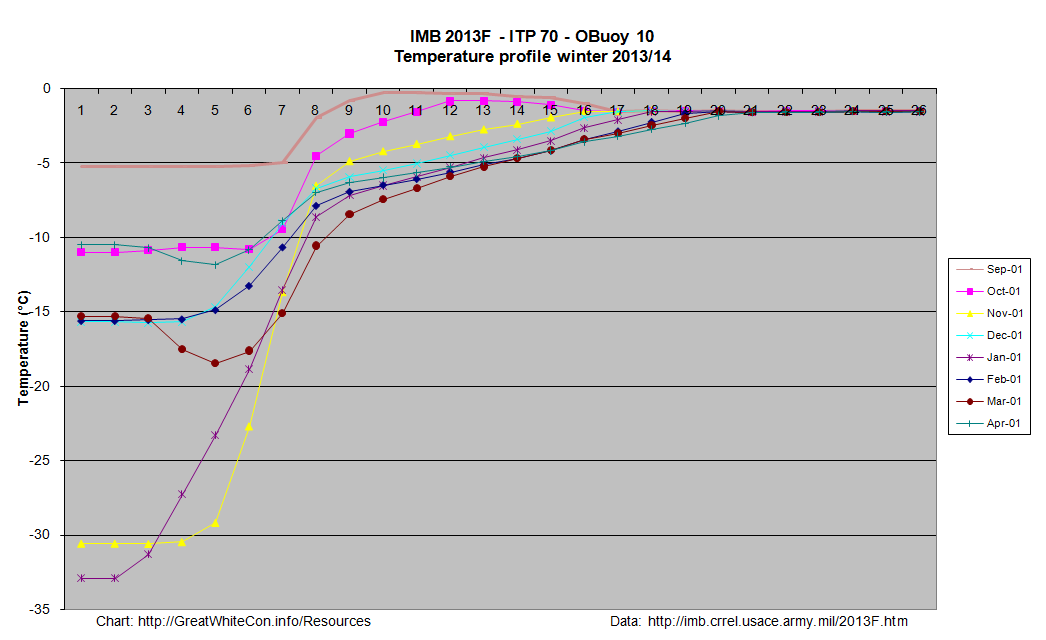
A second set of images shows graphs revealing the temperature above, below and within the ice, currently on a monthly basis:
Click on the graph to view a larger version. This one requires a certain amount of interpretation, but the first thing to note is that the numbers across the top represent the position of thermistors spaced 10 cm apart on a pole that is mounted vertically through the ice floe. Number 1 is in the air above the floe, the rightmost side of the graph (number 26 in this case) is in the water below the ice floe, and somewhere in between those extremes the temperature sensors can also be in the midst of either ice or snow.
At the end of March the interface between ice and snow in this case was somewhere between sensors 8 and 9, and hence at a temperature of around – 7 degrees Celsius, by which time the buoy had moved from the Canadian waters where it started into the area of the Beaufort Sea north of Alaska.
For further discussion about the interpretation of our new resources please use the comment section on the “About Our Arctic Sea Ice Resources” page. For technical observations and suggestions for improvements feel free to comment below!
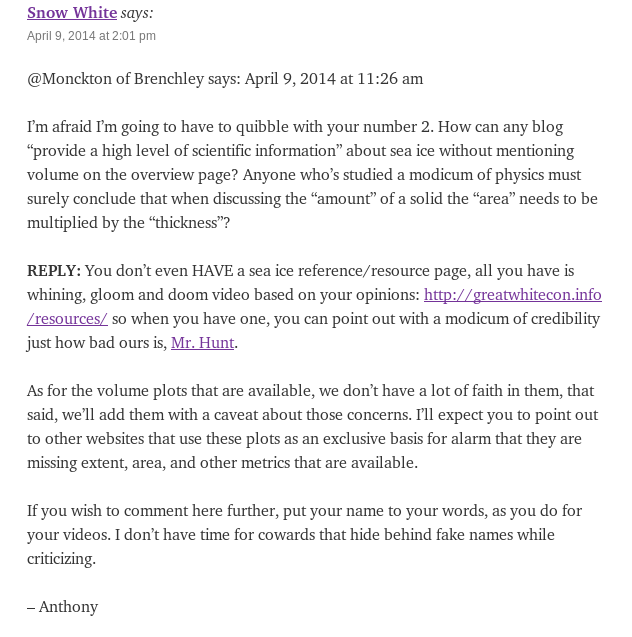
In order to avoid the malicious “spammer” label attached to me by Steven Goddard of “Real Science” fame many moons ago I have been using the nom de guerre “Snow White” in skeptical circles for a while. Unfortunately my pseudonimity didn’t stand a chance against the laser sharp investigative skills of Anthony Watts. My embarrassment is now archived in the public record, plain for all to see:
An extract from the “WUWT near the center of the climate blogosphere” thread on the “Watts Up With That” blog on April 9, 2014 at 2:01 pm
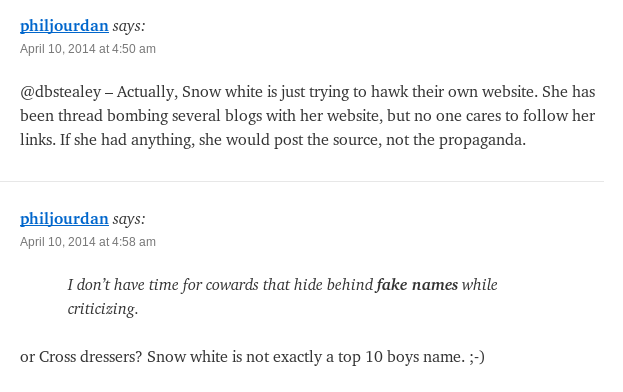
A commenter at “Watts Up With That” then piled on the scorn:
“Snow White” is revealed as a “Cowardly cross dresser”, for all the world to see.
The thing is though, that in the process of so skilfully “outing” Snow White Anthony kindly pointed his loyal readers in the direction of our humble “Resources” section and our videos, so I suppose we’ll have to tart them all up a bit now!
The percentage of the Arctic Ocean consisting of ice at least five years or older remains at only 7%, half of what it was in February 2007. Moreover, a large area of the multiyear ice has drifted to the southern Beaufort Sea and East Siberian Sea (north of Alaska and the Lena River delta), where warm conditions are likely to exist later in the year.
We thought we’d point out to any interested WUWTers that actually warm conditions have existed in the southern Beaufort Sea and East Siberian Sea for quite some time now. However it appears as if the powers that be in WattsLand had other ideas:
Them:
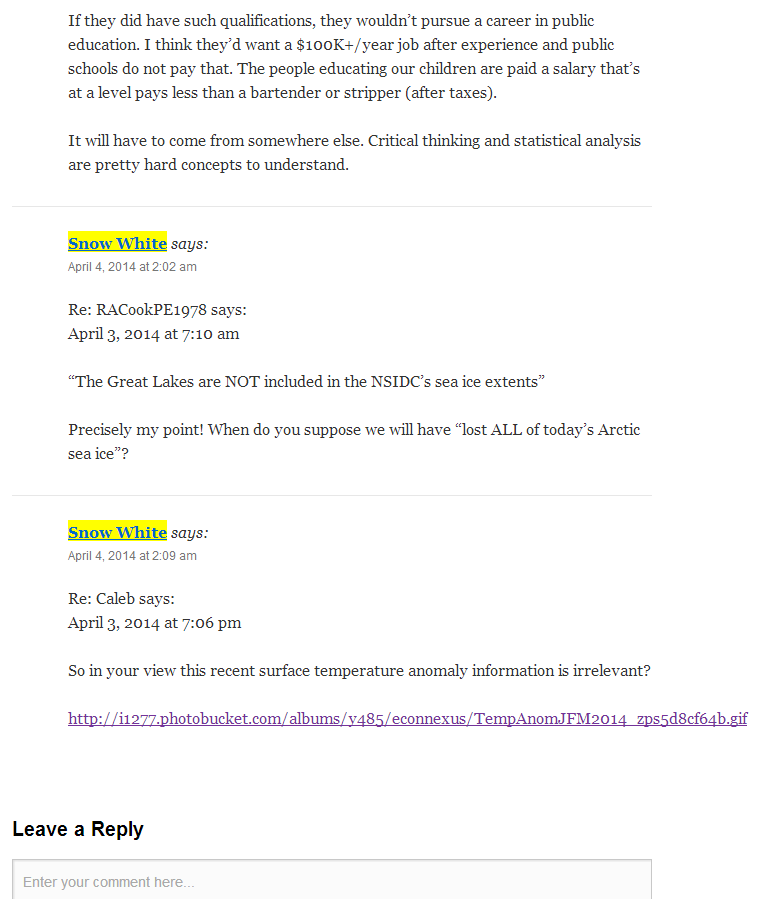
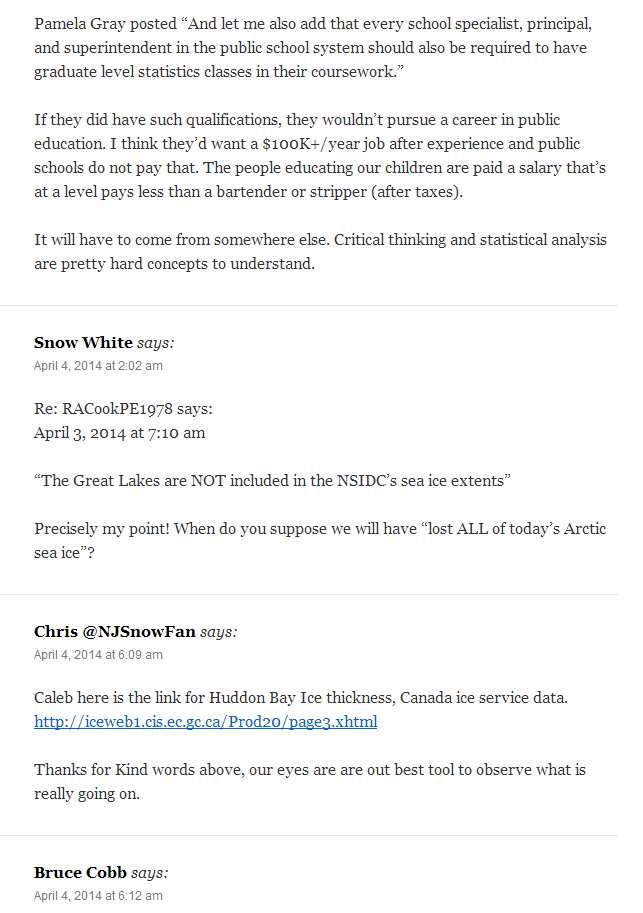
Caleb says:
April 3, 2014 at 7:06 pm
RE: Tom in Denver says:
April 3, 2014 at 9:12 am
I think we need to pay less attention to 2 meter surface temperatures, and more attention to the temperature of the sea. Any time a polynya forms the sea is getting severely cooled by churning winds. Also the ice that has been moved south is going somewhere. In the case of Baffin Bay it was surging south right along the coast of Labrador and out into the Atlantic, creating above-average ice-extents in an area adjacent to the Gulf Stream.
Us:
Surface air temperature anomaly plot for January to March 2014
The self proclaimed “world’s most viewed site on global warming and climate change”, otherwise known as the “Watts Up With That?” blog, recently published an article entitled “Arctic Sea Ice Appears to Have Reached Maximum And Other Ice Observations”. Since I’ve been speculating about the date of the 2014 maximum Arctic sea ice extent myself I avidly read the article but found myself ultimately somewhat perplexed. There were lots of graphs and charts displayed, but there was no sight or mention of what seems to me the most relevant one of all. The long term trend. Here is an expurgated version of my attempts to bring this oversight to the attention of the Watts Up With Thatters:
Us:
A “dull” comment about Arctic sea ice trends
Them:
Re: Michael Jennings says:
March 26, 2014 at 7:07 am
[snip . . this is dull. Put some content into your contributions or you are just trolling . . mod]
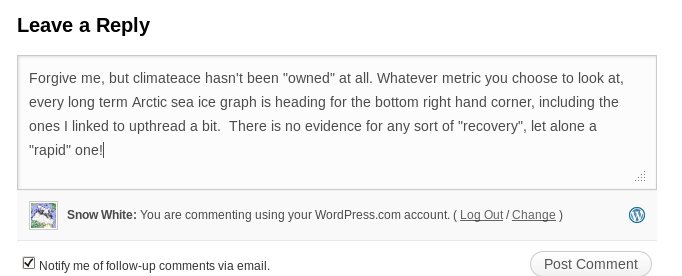
Us:
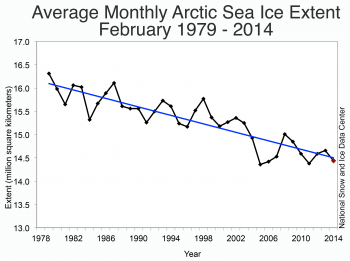
At the risk of repeating myself, here’s the latest dull content out of NSIDC:
Do you see the blue line heading for the bottom right?
Snow White needs to get up to speed on the Scientific Method: skeptics have nothing to prove.
Rather, the onus is on the alarmist crowd to provide scientific evidence showing that their CO2/cAGW conjecture is true. They have failed miserably.
But there is no scientific evidence supporting their belief in manmade global warming. None at all. Every last climate model has failed. They were all wrong.
The alarmist crowd is fixated on Arctic ice, instead of on global ice cover. Why? Because that is their last forlorn hope; every other climate scare has been debunked. Well, it’s time to debunk the ‘disappearing Arctic ice’ scare, too:
Global sea ice is at it’s 30-year average [the red graph – click in chart to embiggen]. We already know about the polar see-saw, in which the NH and SH poles balance each other out. That effect can be clearly seen in the global ice chart above.
There is nothing either unusual or unprecedented happening. What we observe now has happened before, repeatedly, and to a much greater degree. Rational folks understand that. It is called the climate Null Hypothesis, and it has never been falsified. The Null Hypothesis is a corollary of the Scientific Method. So is the fact that the onus is on those who produce the catastrophic CO2/AGW conjecture, to suport their belief with scientific evidence.
But there is no evidence proving that Arctic ice is in unprecedented decline. None at all. There is no evidence to prove that the current Arctic ice fluctuation is anything other than natural climate variability. Occam’s Razor says that natural variability is by far the most likely explanation.
The Arctic ice scare is just the same as all the other climate scares. It is promoted by religious True Believers, who expect everyone to share in their Chicken Little panic.
But that only works on those who are ruled by emotion, and fright is an emotion. Scientific skeptics, OTOH, are logical, and therefore they are unaffected by the silly ‘Arctic ice’ scare.
Us:
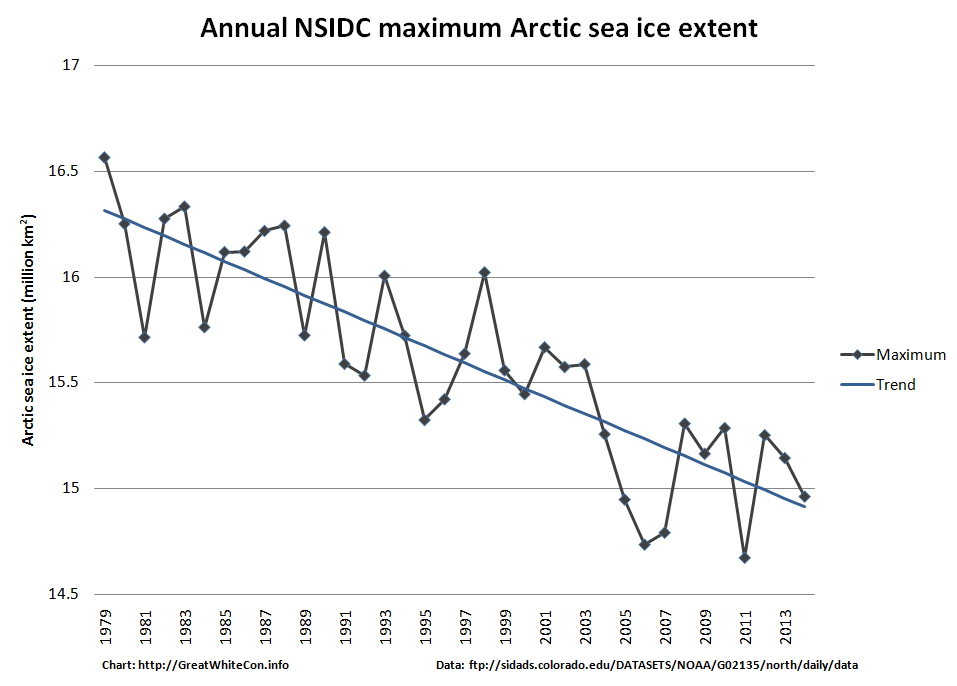
So to summarise, you cannot muster a single chart to refute my assertion about Arctic sea ice decline, let alone “hundreds”.
For your edification, and for that of the writer of the original article who for some strange reason neglected to include a graph showing the long term trend in Arctic sea ice maximum extent, here is one I prepared earlier:
Provisional NSIDC annual maximum Arctic sea ice extent graph for 1979 – 2014
I’m sorry Snow White (or Mr Hunt, if you prefer), but I think that a little courtesy would be in order. I’ve read every word on the link you’ve provided, and the central theme of your original post was that “there was no sight or mention of what seems to me the most relevant one of all. The long term trend [of Arctic sea ice]“. You described more than one attempt to bring this deficit to the attention of WUWT.
Given that Michael D posted on your page at April 9, 2014 at 4:01 pm, politely pointing out that the WUWT sea ice page has just such data presented, it would seem a basic courtesy to either acknowledge his assistance (in this blog or yours) and either thank him, or explain why graph does not answer your criticisms.
I acknowledge that your arguments seem to have moved on to volume now, but they have been addressed by others, and better than I could have done. As an aside, I suppose I could run a blog with limited data about Antarctic sea ice coverage and volumes. I’m sure that I would be criticised, with comments explaining that I was looking at the mural through a microscope, and that the Antarctic buildup cannot be considered in isolation. I think that such criticism would be valid – your thoughts?
Us:
As you can see from the historical record, I asked on more than one occasion for someone to supply a link to “A long term (let’s say 30 years or more) graph for any measure of Arctic sea ice “quantity” showing anything other than a trend in the direction of the bottom right hand corner.” Nobody did. Nobody suggested looking at the WUWT sea ice page either, presumably because no graphs fitting my description can be found on there.
Q.E.D. ?
Them:
We’ll keep you posted!
This website uses cookies to improve your experience. We'll assume you're ok with this, but you can opt-out if you wish. Cookie settingsACCEPT
Privacy & Cookies Policy
Privacy Overview
This website uses cookies to improve your experience while you navigate through the website. Out of these, the cookies that are categorized as necessary are stored on your browser as they are essential for the working of basic functionalities of the website. We also use third-party cookies that help us analyze and understand how you use this website. These cookies will be stored in your browser only with your consent. You also have the option to opt-out of these cookies. But opting out of some of these cookies may affect your browsing experience.
Necessary cookies are absolutely essential for the website to function properly. This category only includes cookies that ensures basic functionalities and security features of the website. These cookies do not store any personal information.
Any cookies that may not be particularly necessary for the website to function and is used specifically to collect user personal data via analytics, ads, other embedded contents are termed as non-necessary cookies. It is mandatory to procure user consent prior to running these cookies on your website.