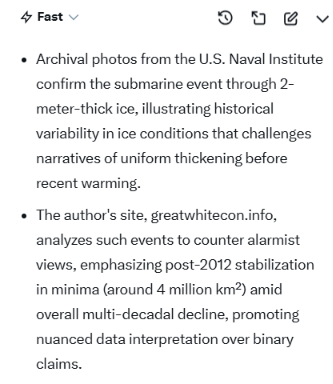
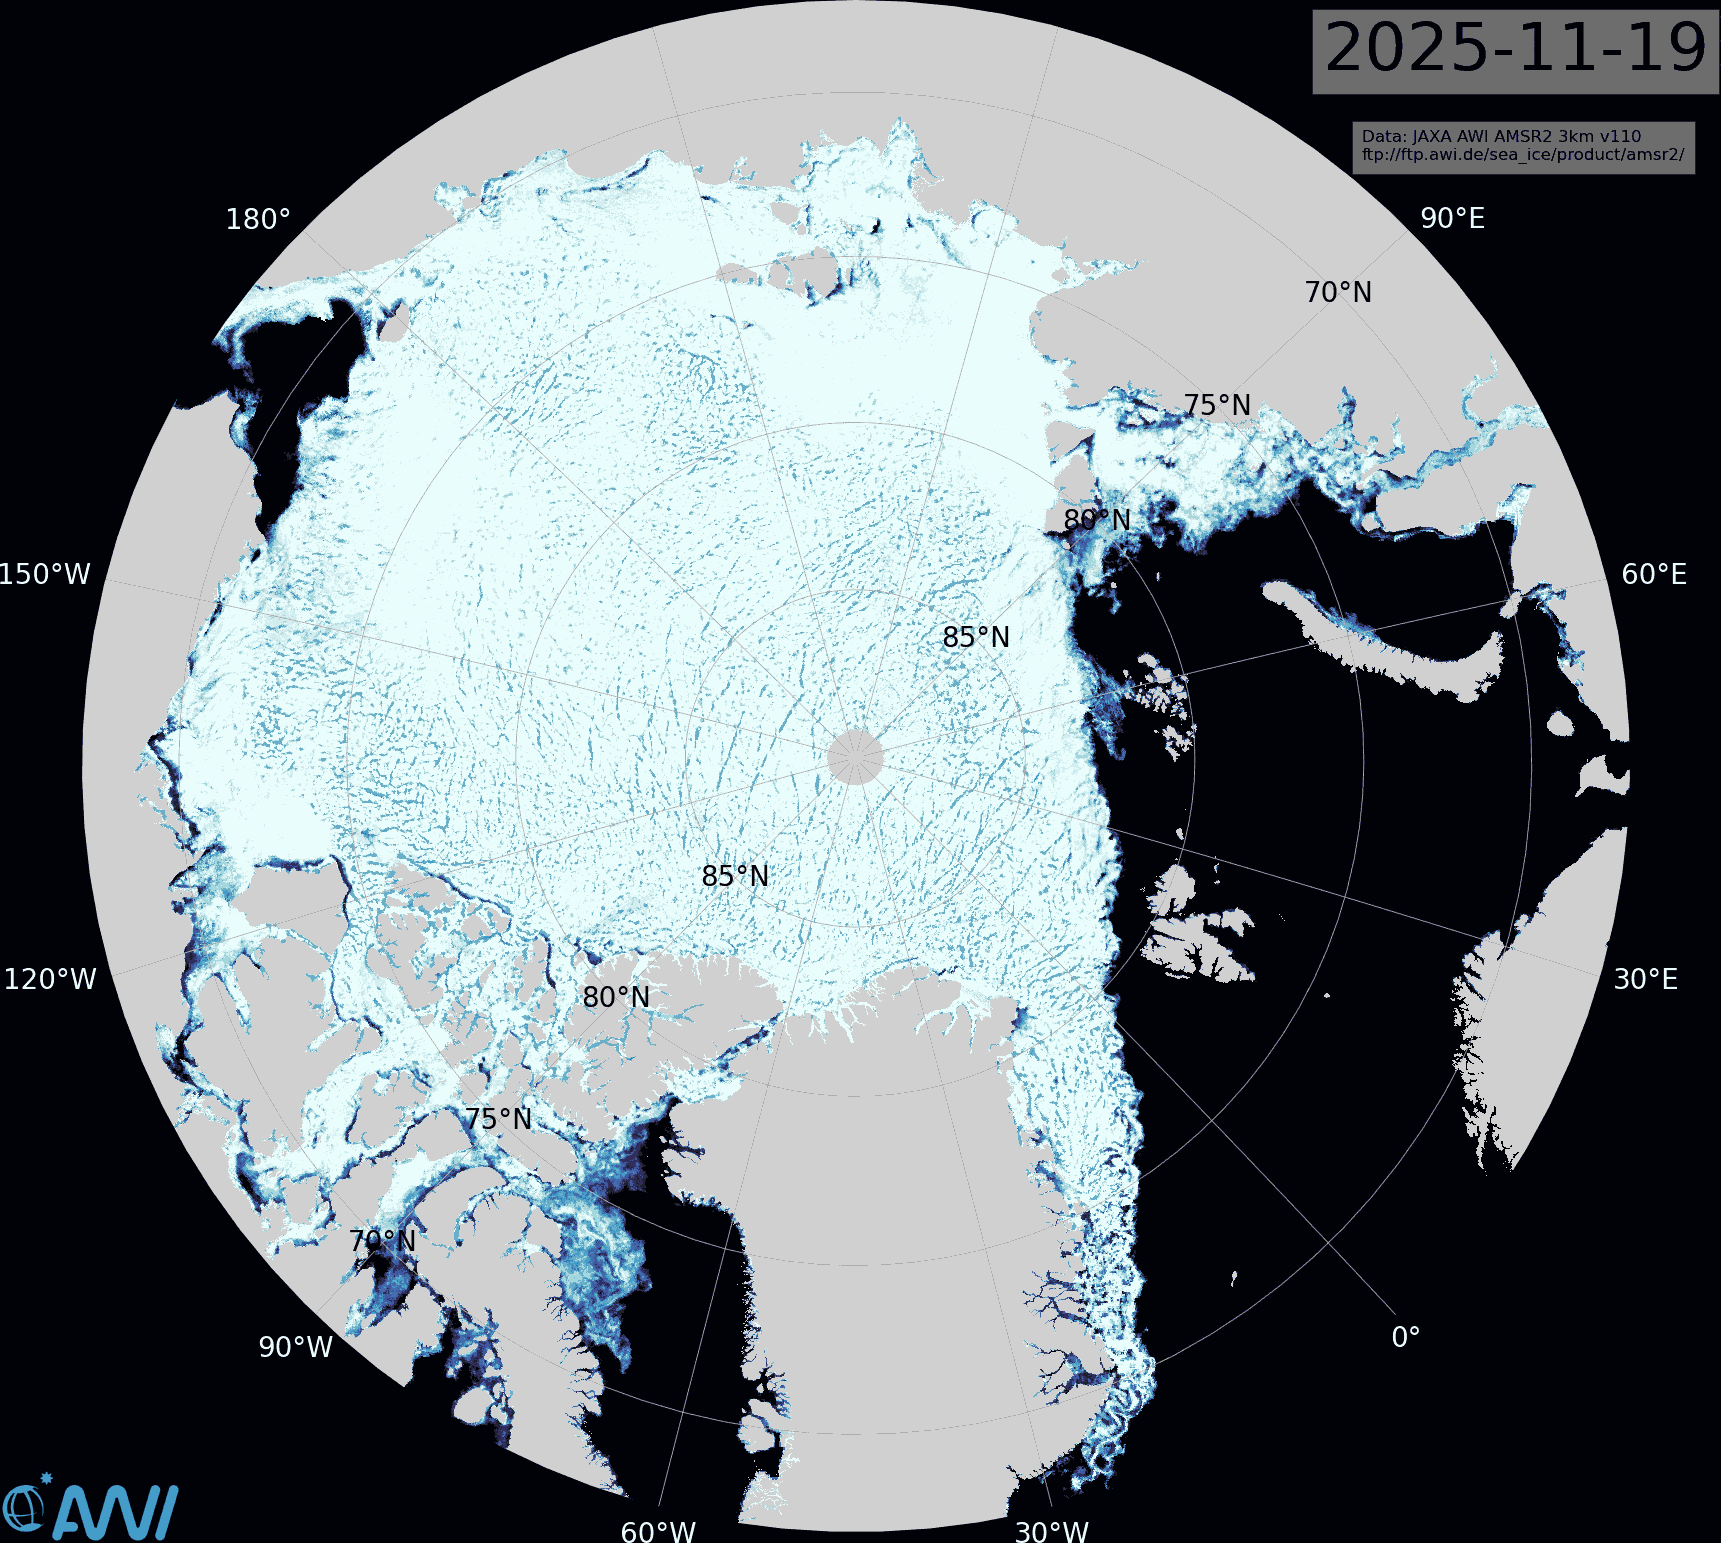
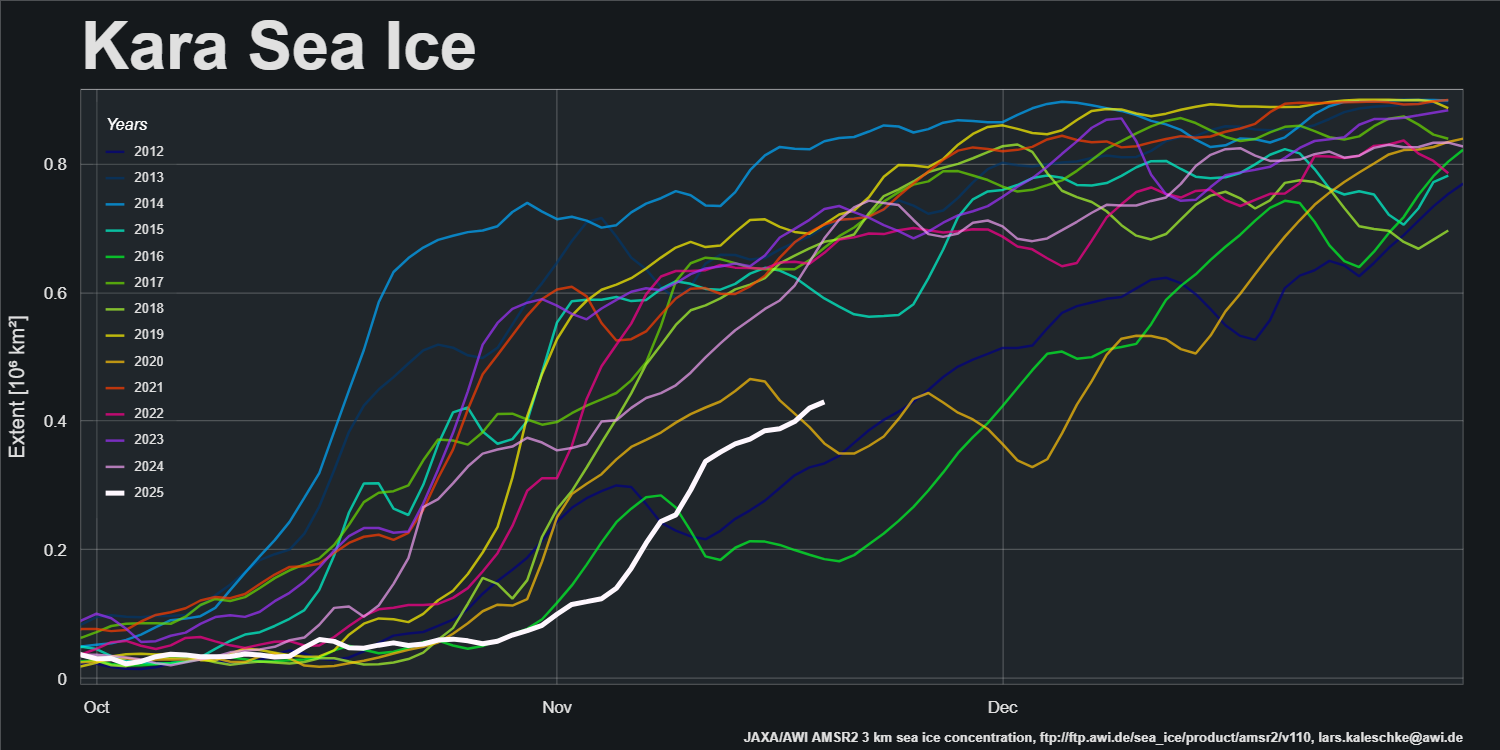
The latest Alfred Wegener Institute sea ice concentration map shows the East Siberian and Laptev Seas almost completely refrozen. However, refreeze of the Kara Sea has barely begun:
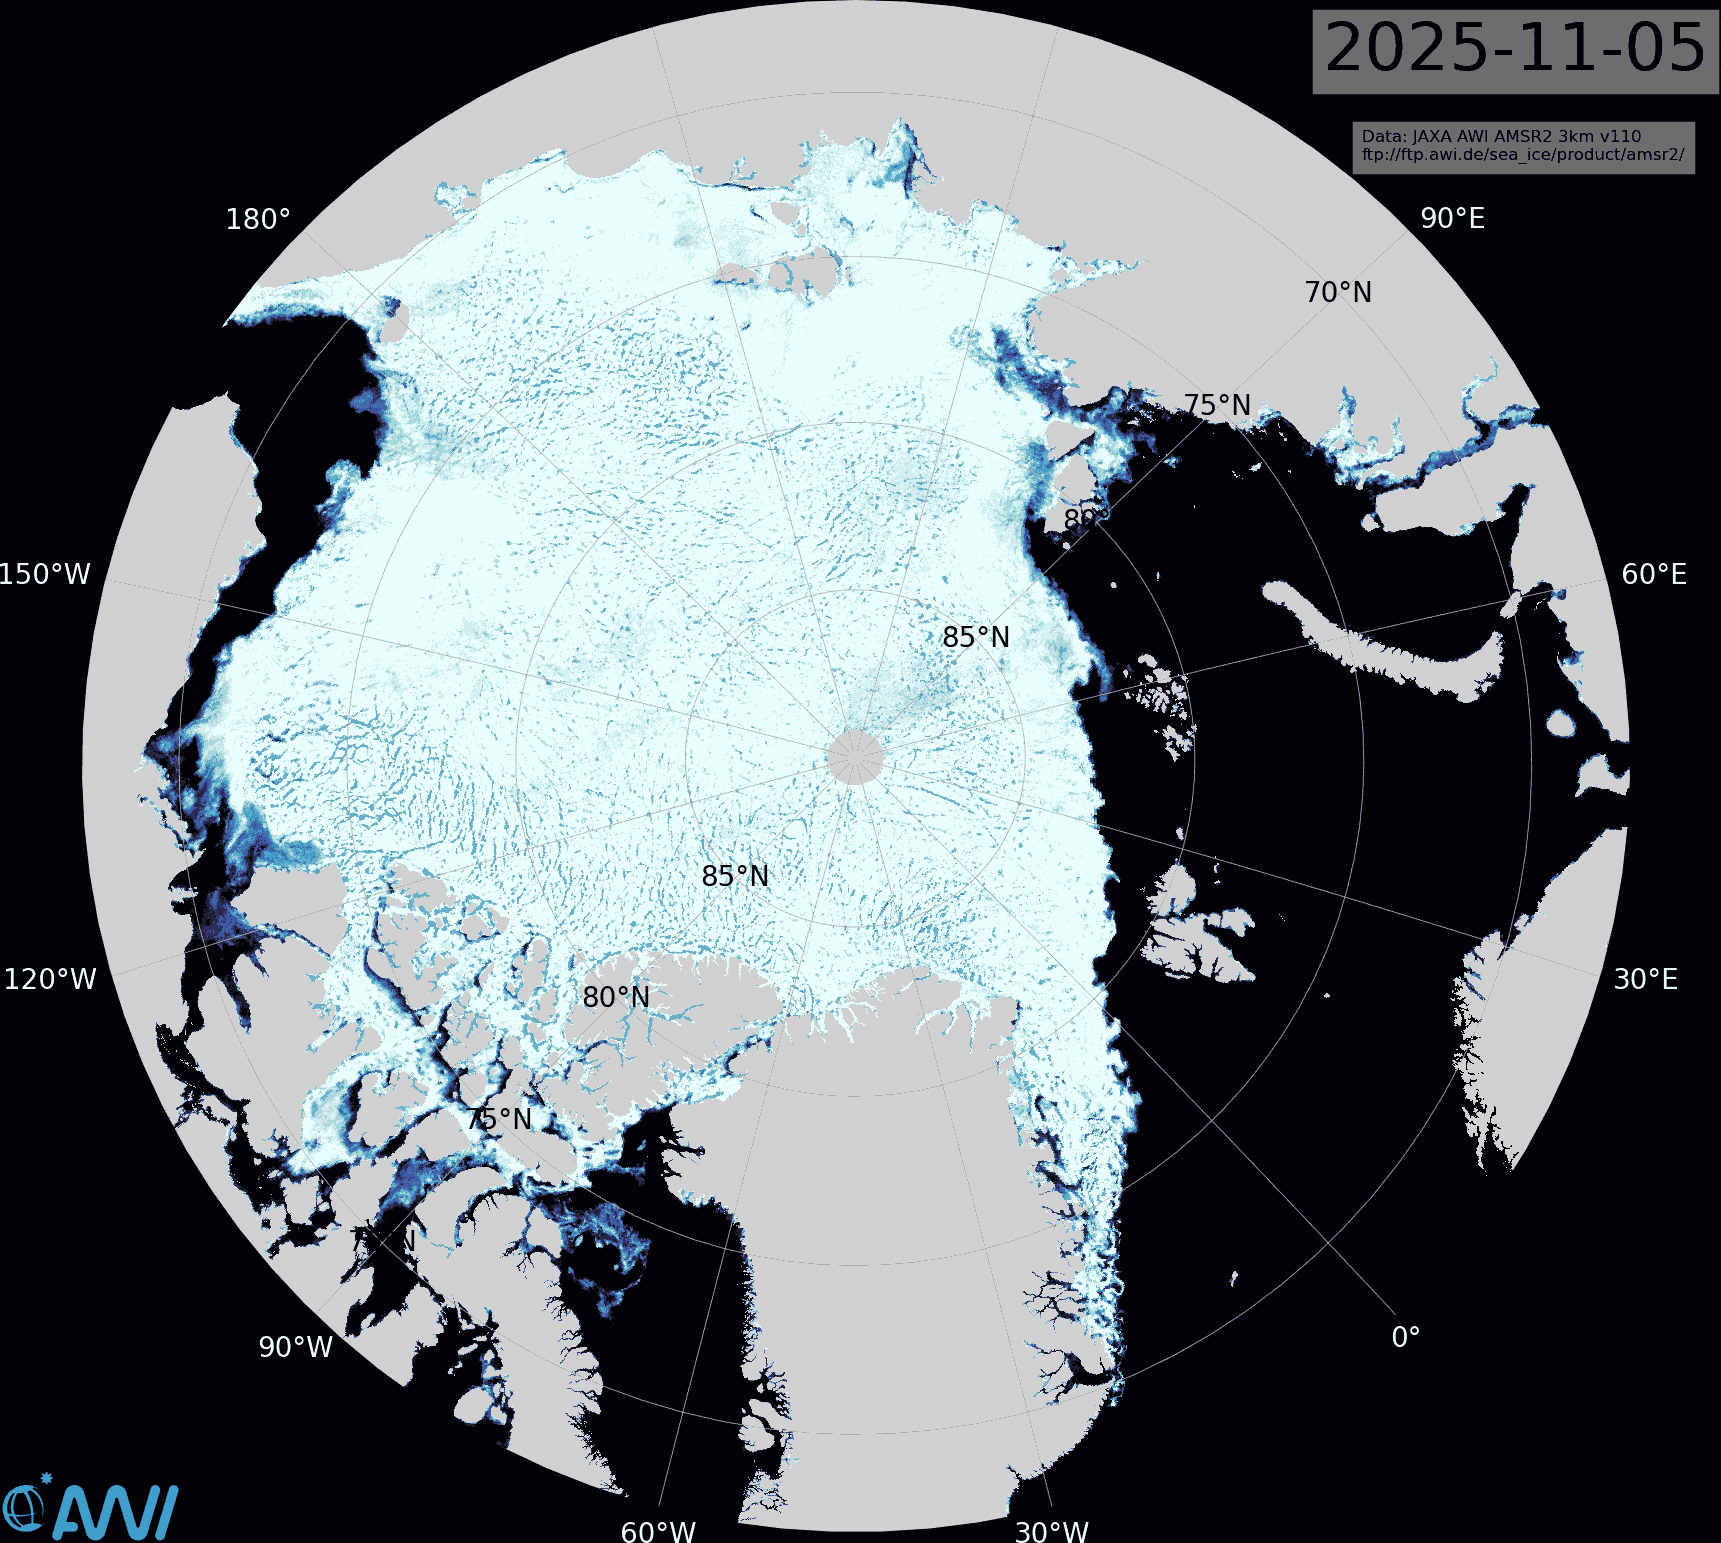
Across the Arctic as a whole the refreeze has slowed significantly, and JAXA/ViSHOP extent is now 2nd lowest in the satellite era:
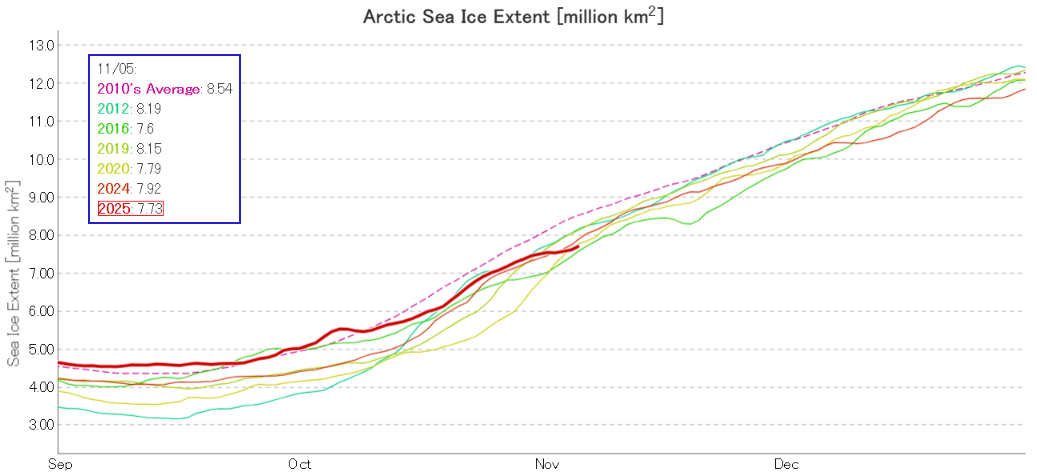
However, average NSIDC extent for the month of October was higher than last year and above the linear trend:
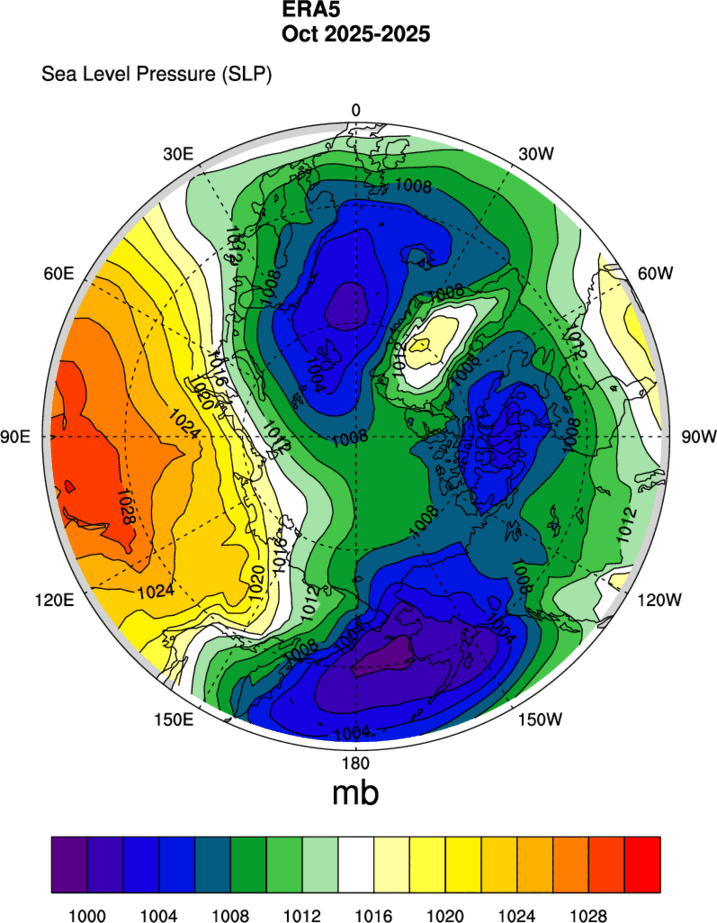
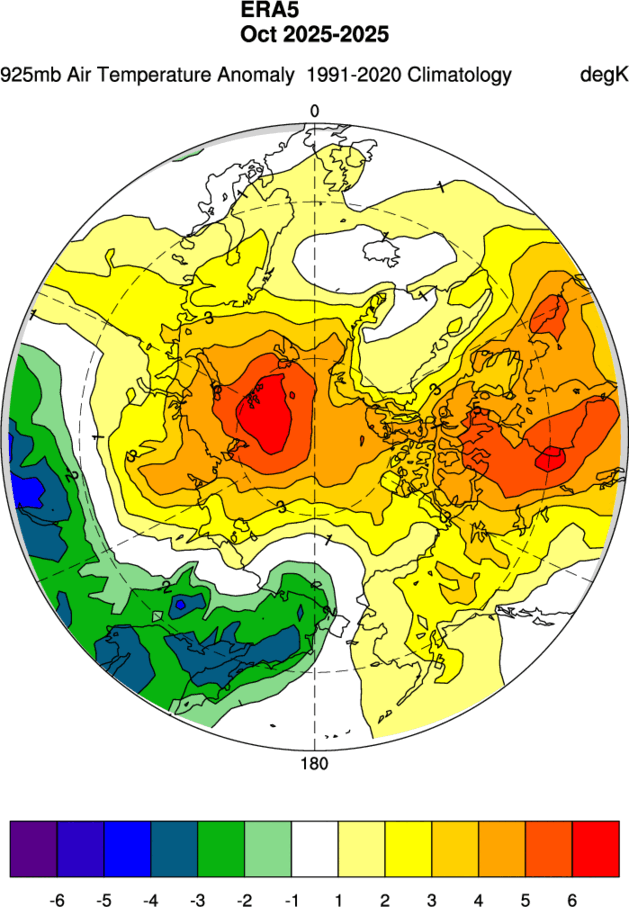
The ERA5 MSLP map for October shows high pressure over Siberia, associated with lower than normal air temperatures at 925 hPa across the region. However, temperatures across almost the entire Arctic Ocean were above normal:
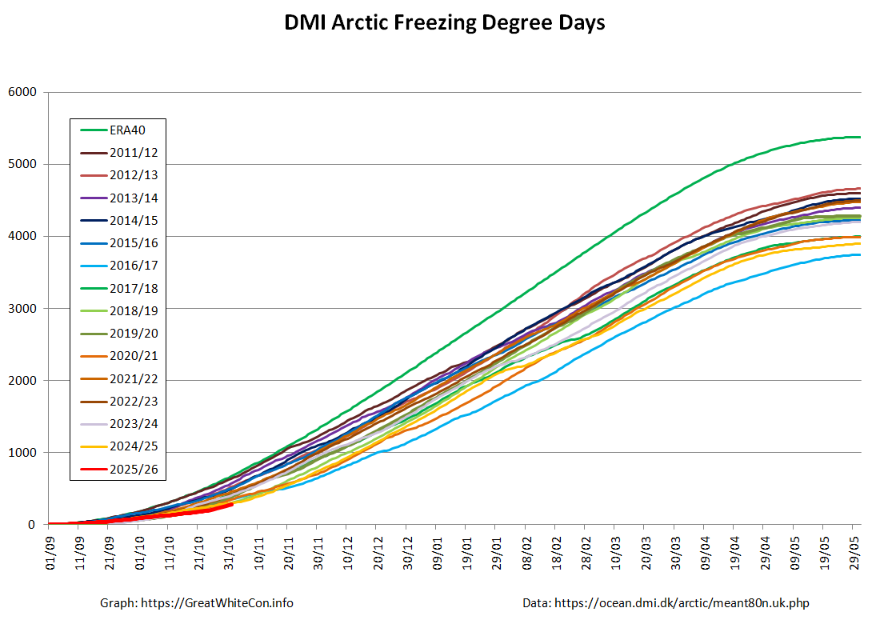
High Arctic freezing degree days based on DMI >80N data were lowest for the date at the beginning of November:
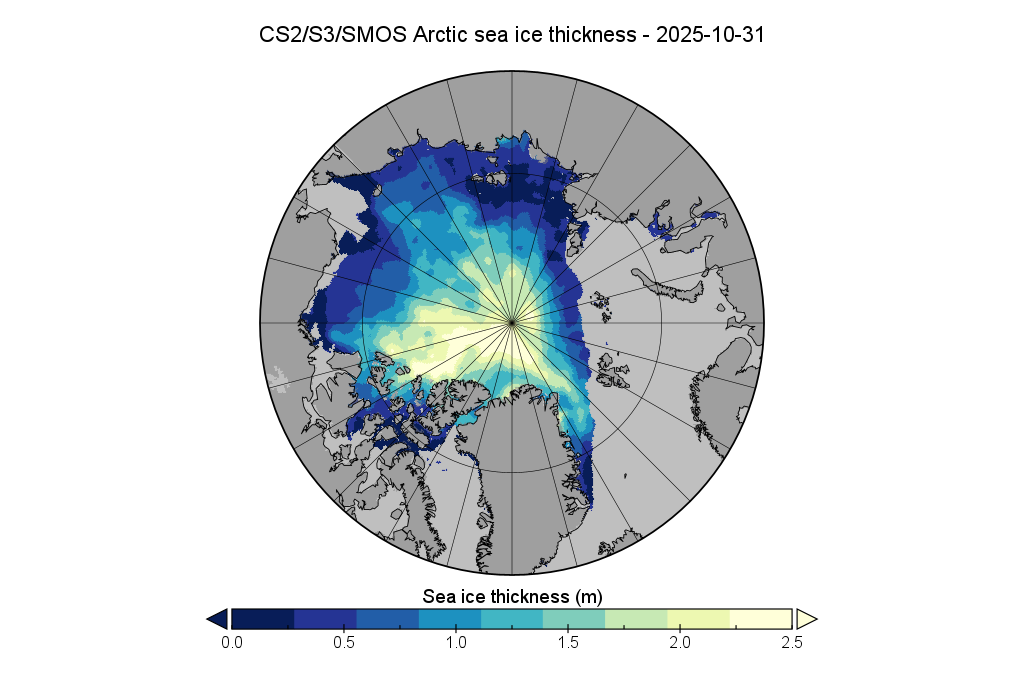
Here is the Alfred Wegener Institute’s CryoSat-2/Sentinel 3/SMOS Arctic sea ice thickness map at the end of October:
Here too is the associated sea ice volume graph:
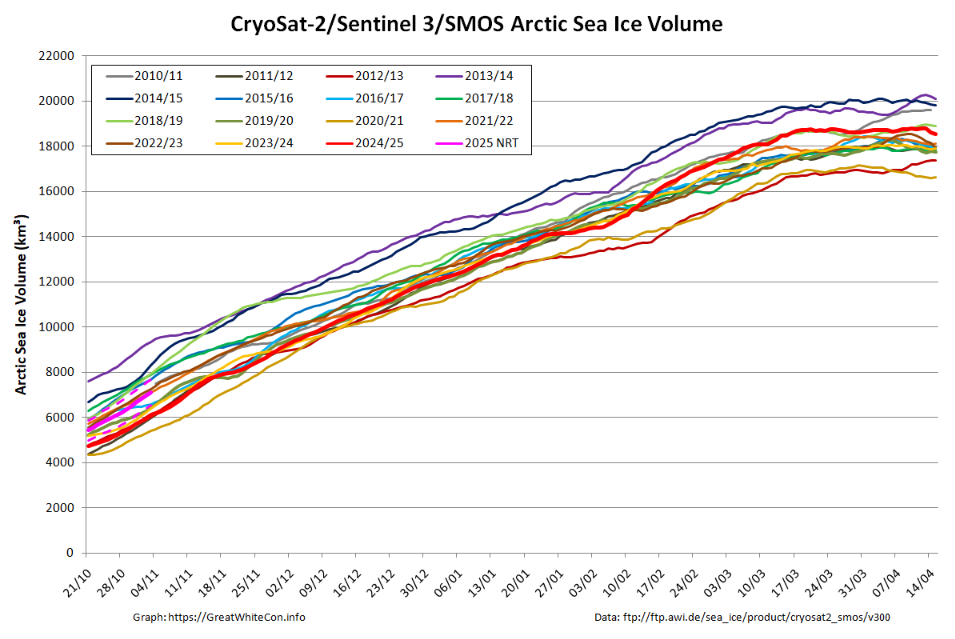
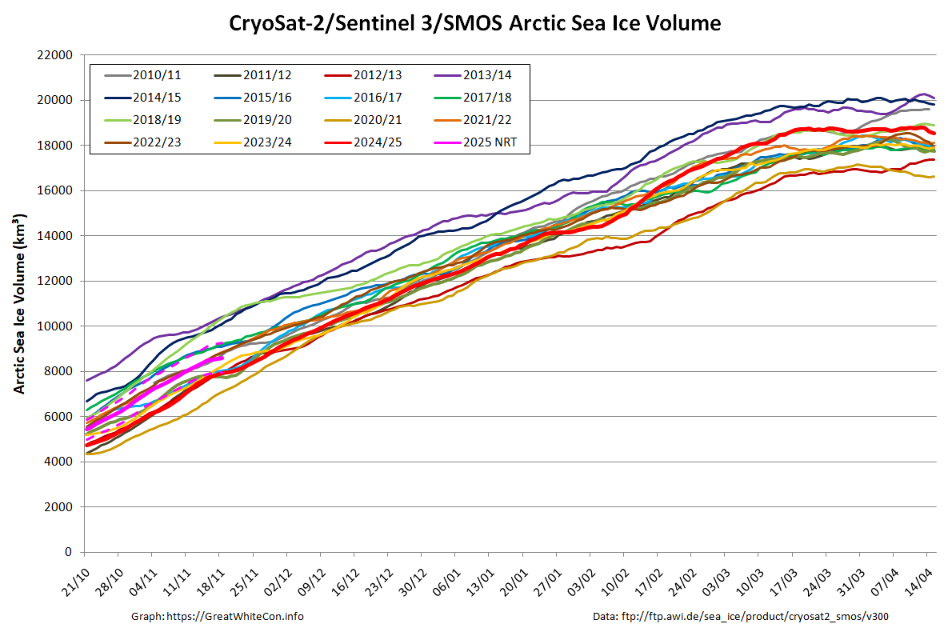
Bear in mind the caveats about the current lack of reliable SMOS data on the Atlantic side of the Arctic, and that Sentinel 3 data is only incorporated from Autumn 2023.
[Update – November 20th]Refreeze of the Beaufort Sea is complete, and refreeze of the Kara Sea has started in earnest:
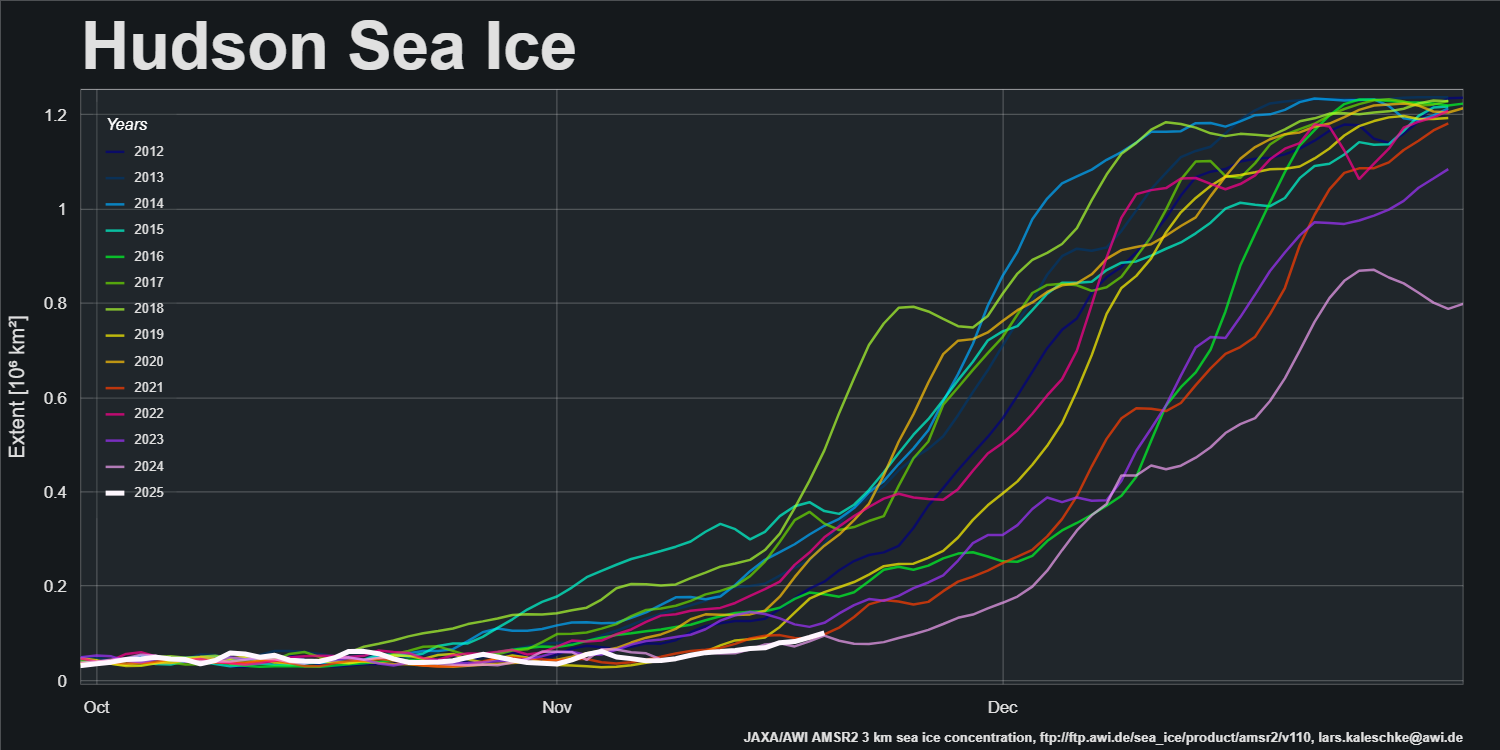
However, the Barents Sea is still sea ice free and refreeze of Hudson Bay has barely begun:
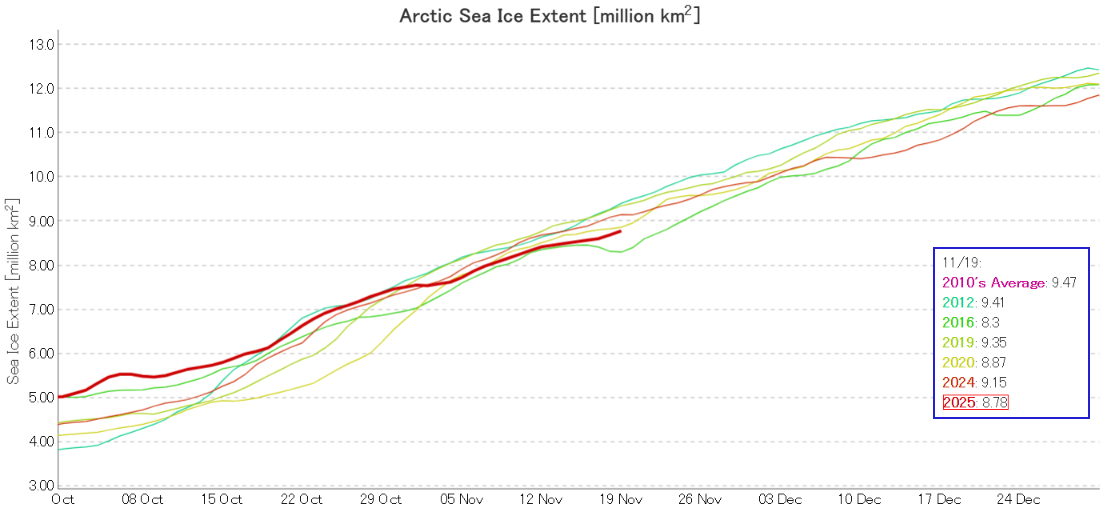
JAXA extent is still second lowest for the date:
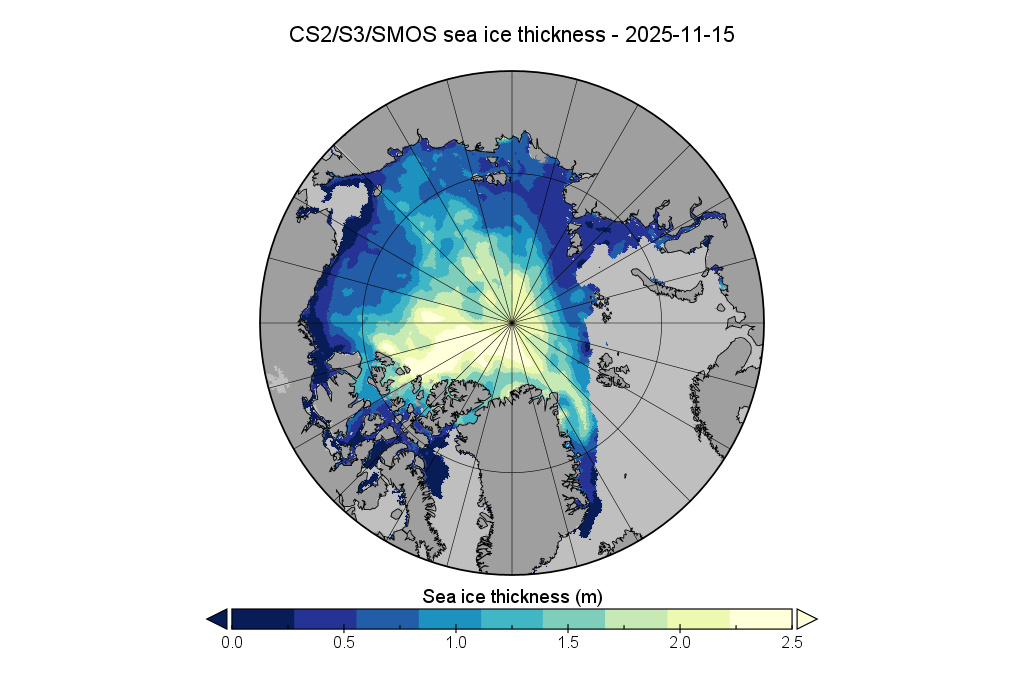
The PIOMAS gridded thickness data for October has yet to be corrected, but here is the mid month thickness map from AWI:
Here too is the associated volume graph:
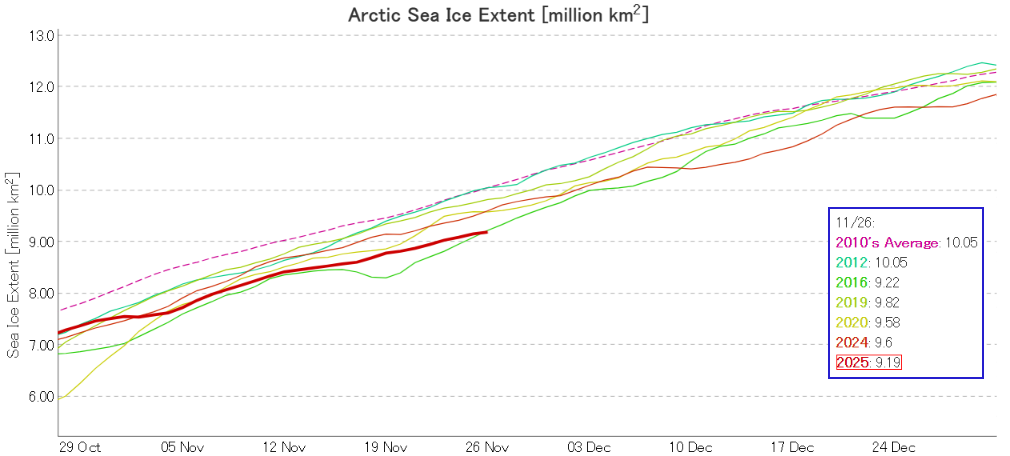
JAXA/ViSHOP extent is now lowest for the date in their record going back to 1978:
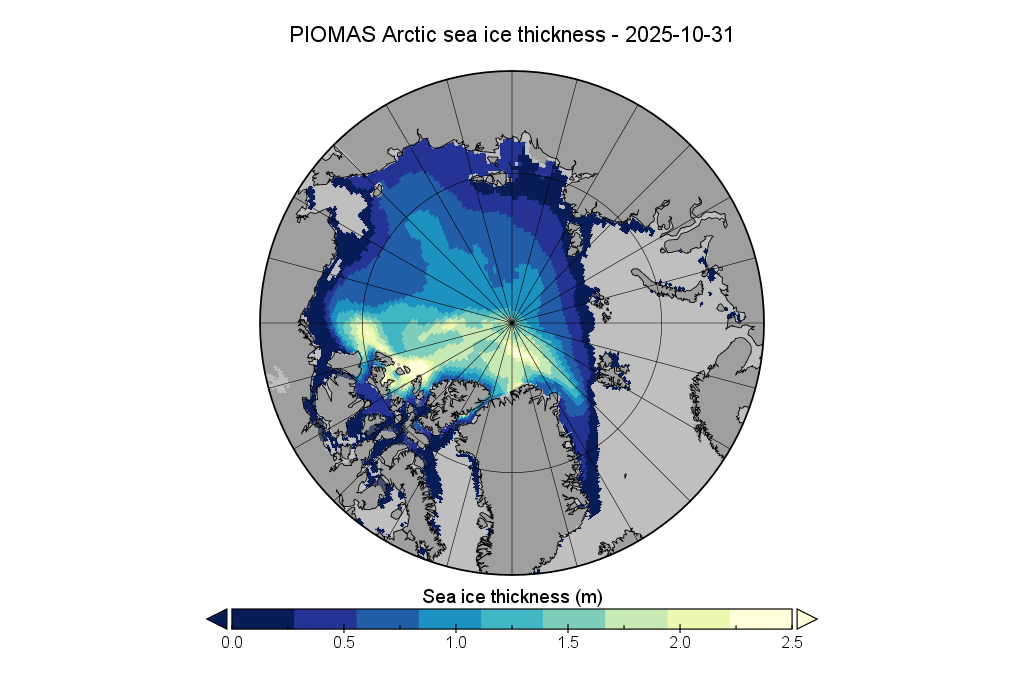
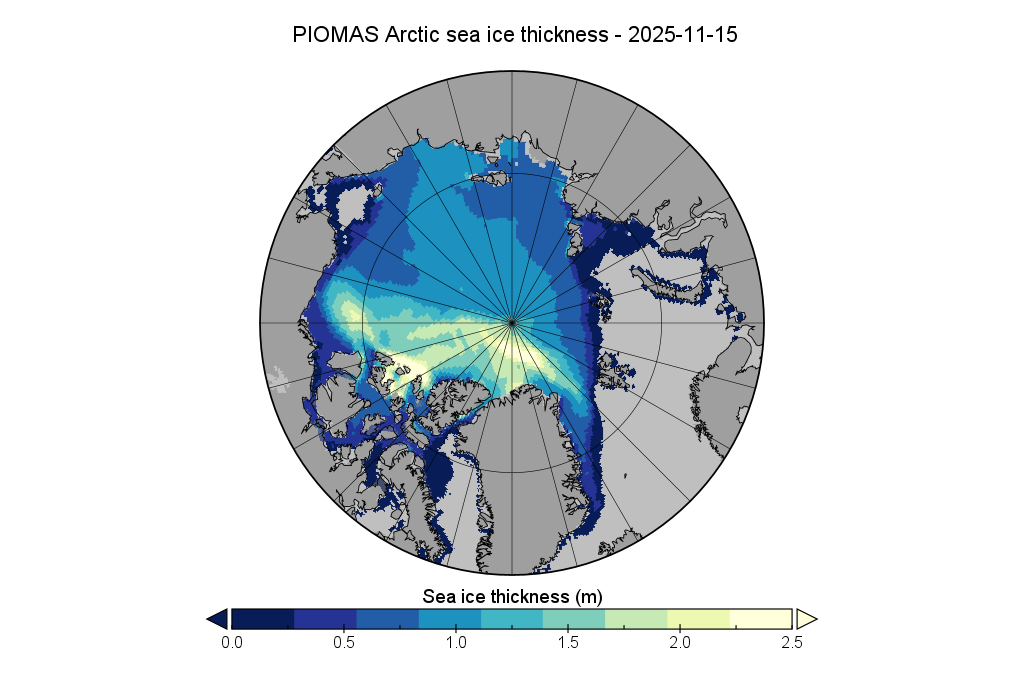
The PIOMAS team have finally published gridded thickness data for October and November, so here are the October 31st and November 15th thickness maps:
The conversation continues over on the December open thread, including the latest PIOMAS data.