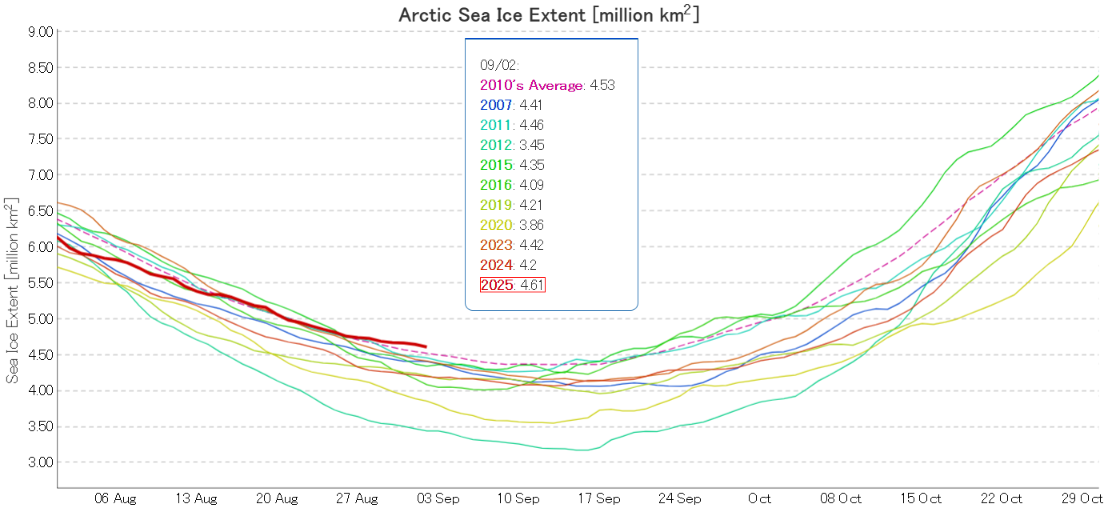
At the beginning of last month JAXA/ViSHOP extent was third lowest for the date in the satellite era. With the date of the 2025 minimum extent rapidly approaching that is no longer the case:
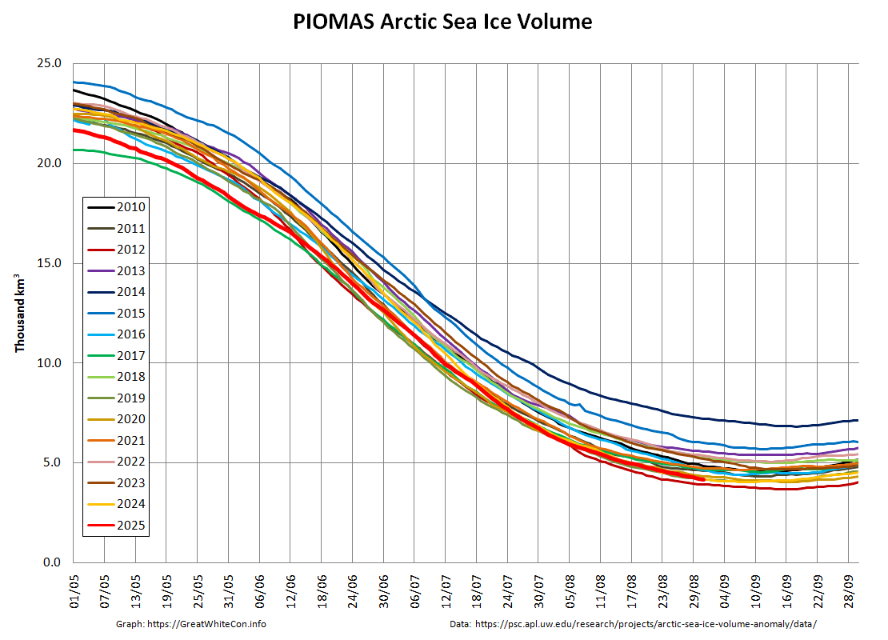
Whilst JAXA extent is now 10th lowest, PIOMAS volume remains second lowest for the date:
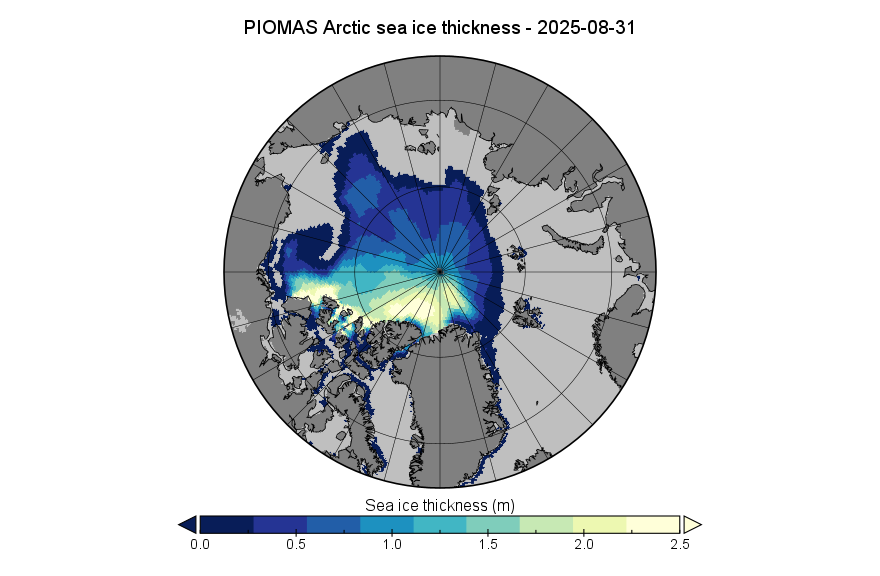
Here’s the associated thickness map. Note the change of scale from last month
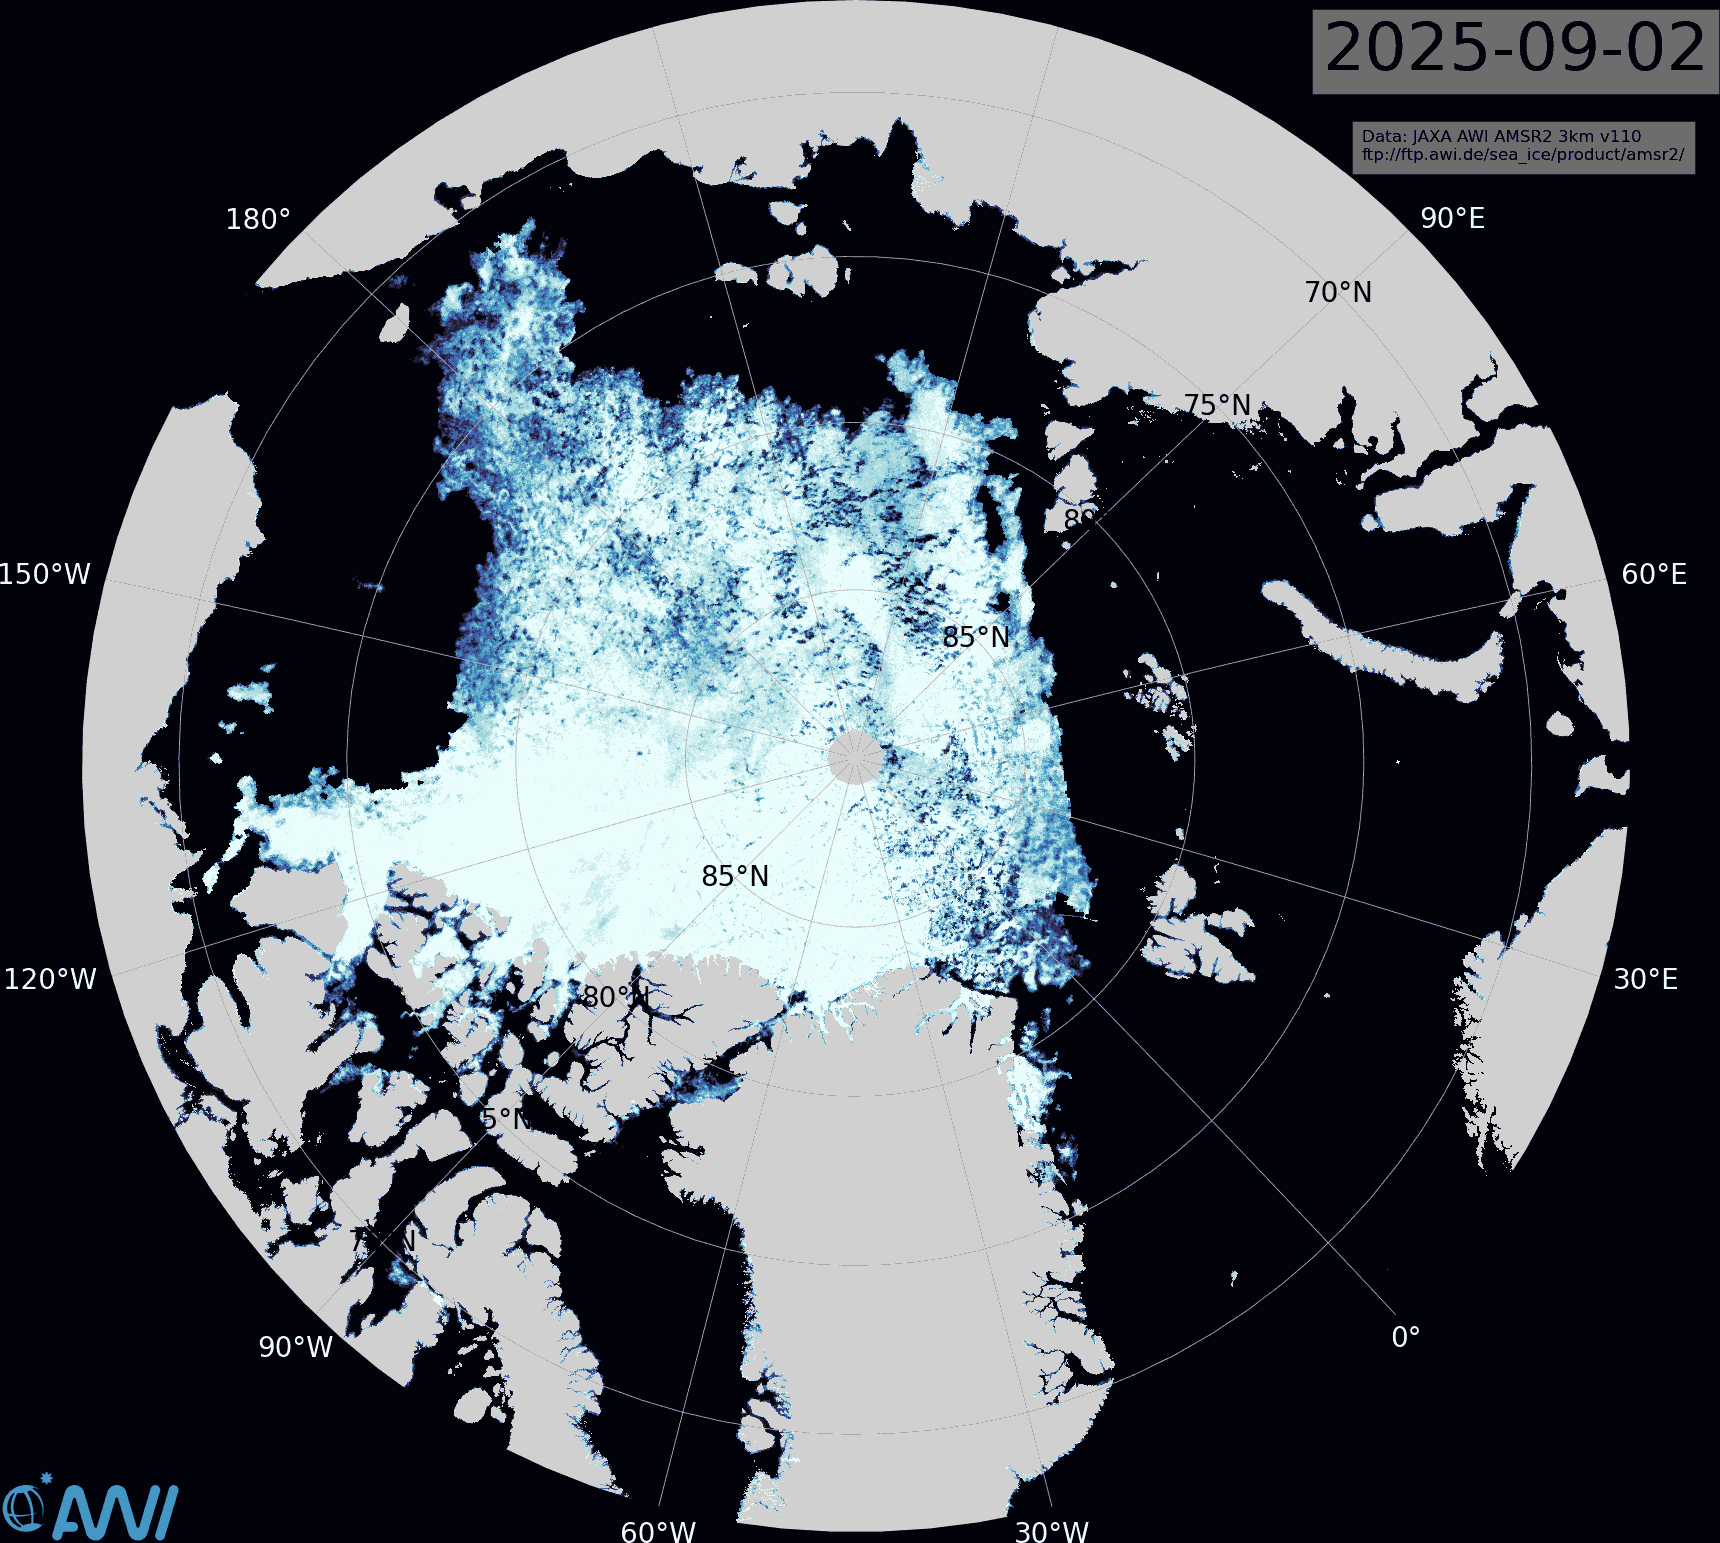
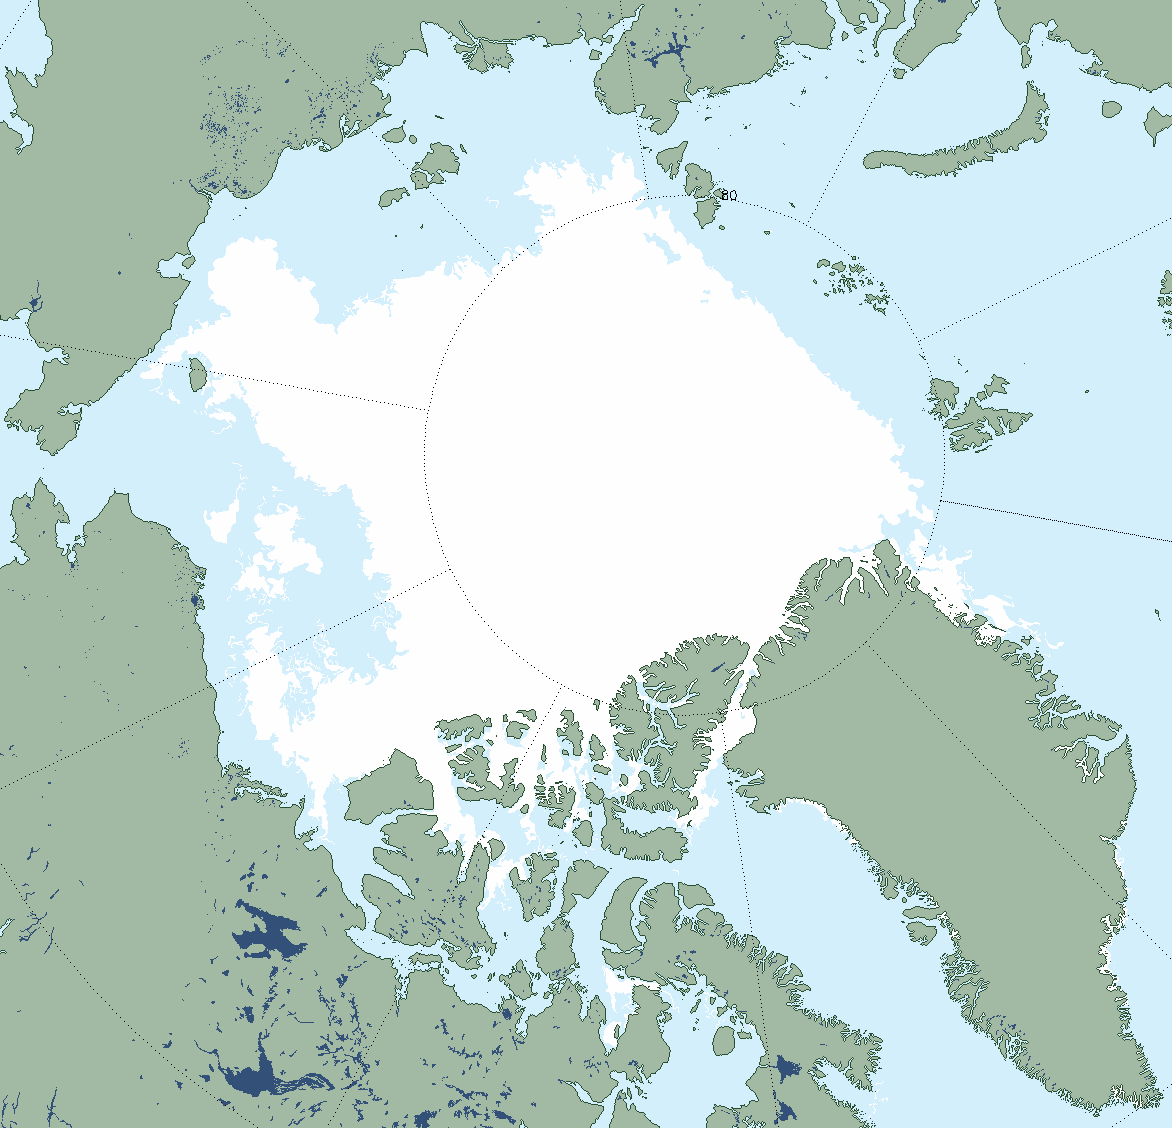
Compare and contrast that map with the AWI’s sea ice concentration map, particularly in the Beaufort Sea area:
Also compare those two with the NSIDC’s MASIE extent map:
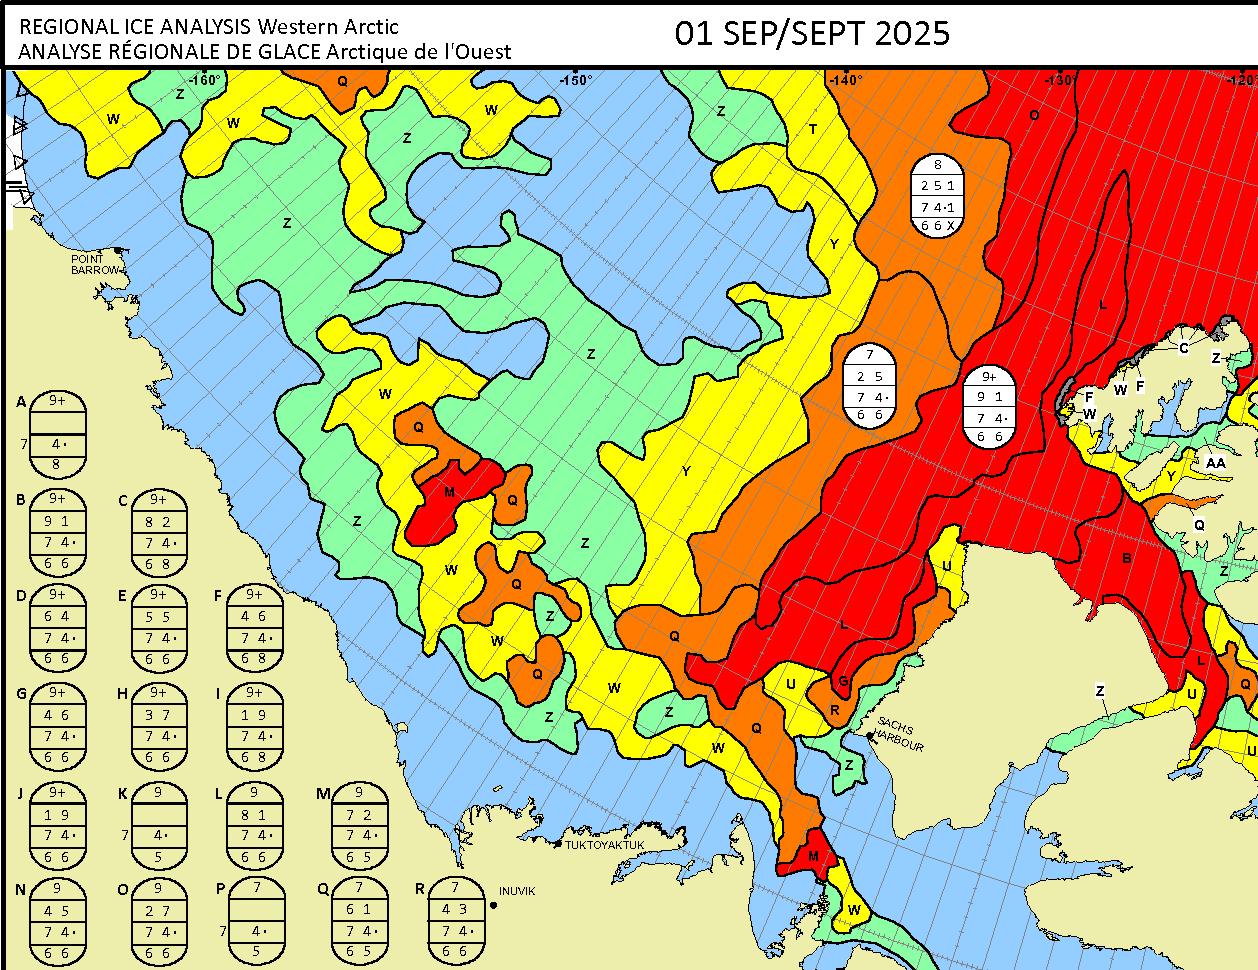
For a fourth opinion on where sea ice cover remains in the Beaufort Sea, see also the the Canadian Ice Service‘s latest concentration chart:
Evidently the choice of satellite sensors and data processing algorithms can result in a big difference in the calculated sea ice extent!
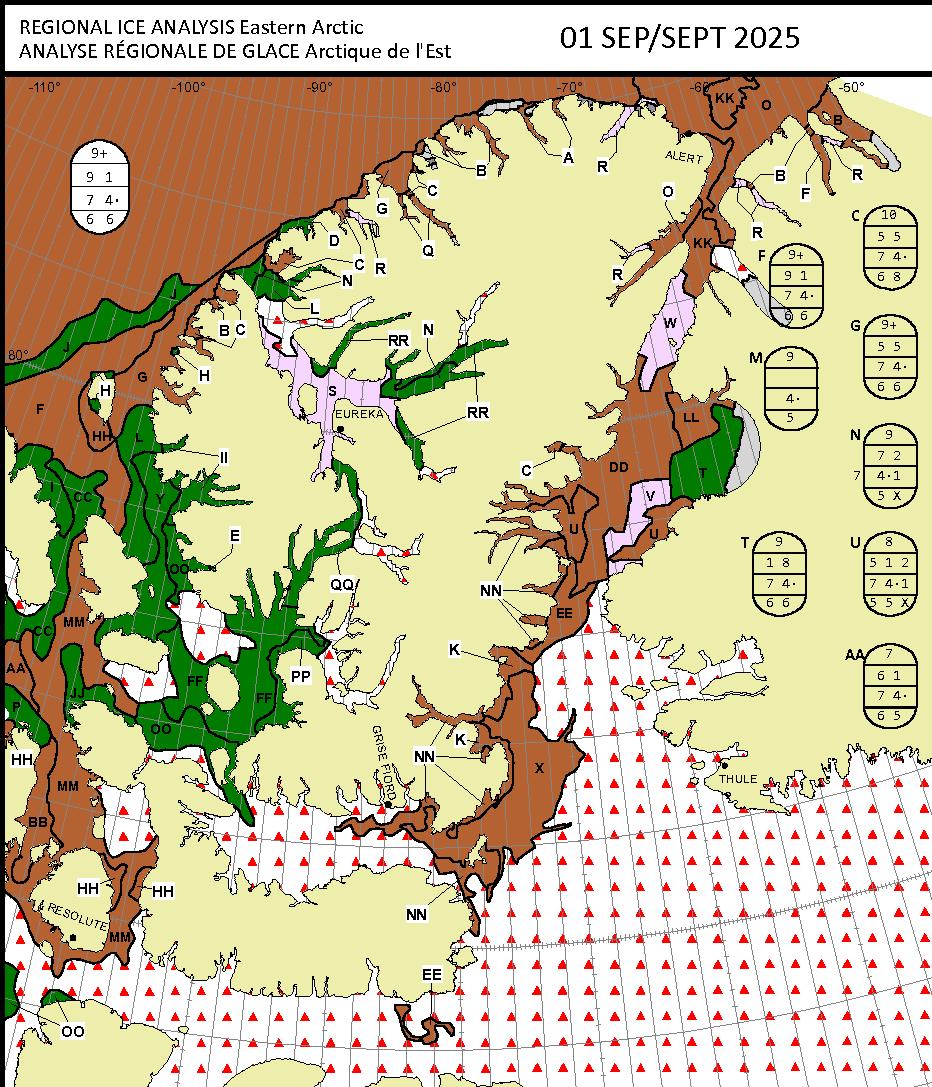
The pale pink areas on another CIS chart, this time showing the ice “stage of development”, reveal that the refreeze has begun in the Nares Strait and Nansen Sound:
Of course at lower latitudes the ice is still melting, including in the Beaufort Sea.
[Update – September 9th]
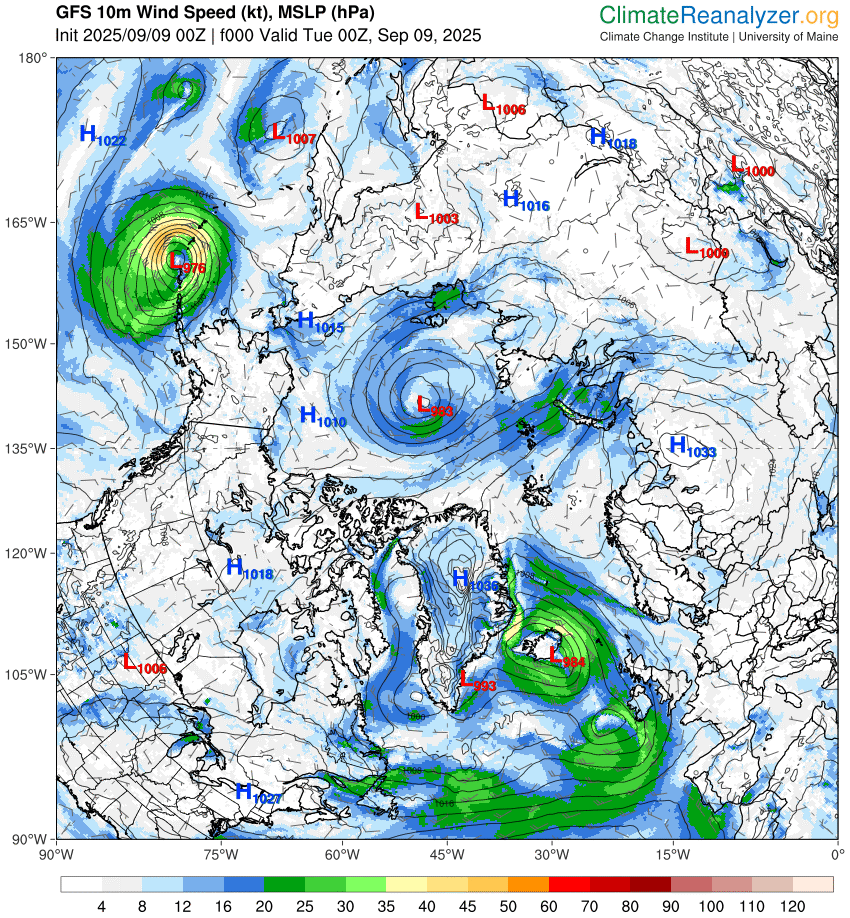
The MSLP of the persistent low pressure area discussed in the comments is back down to 983 hPa:
It’s currently forecast to slowly fill in over the next few days.
[Update – September 11th]
According to the National Snow and Ice Data Center’s “Sea Ice Today“ overview of Arctic sea ice conditions in August 2025:
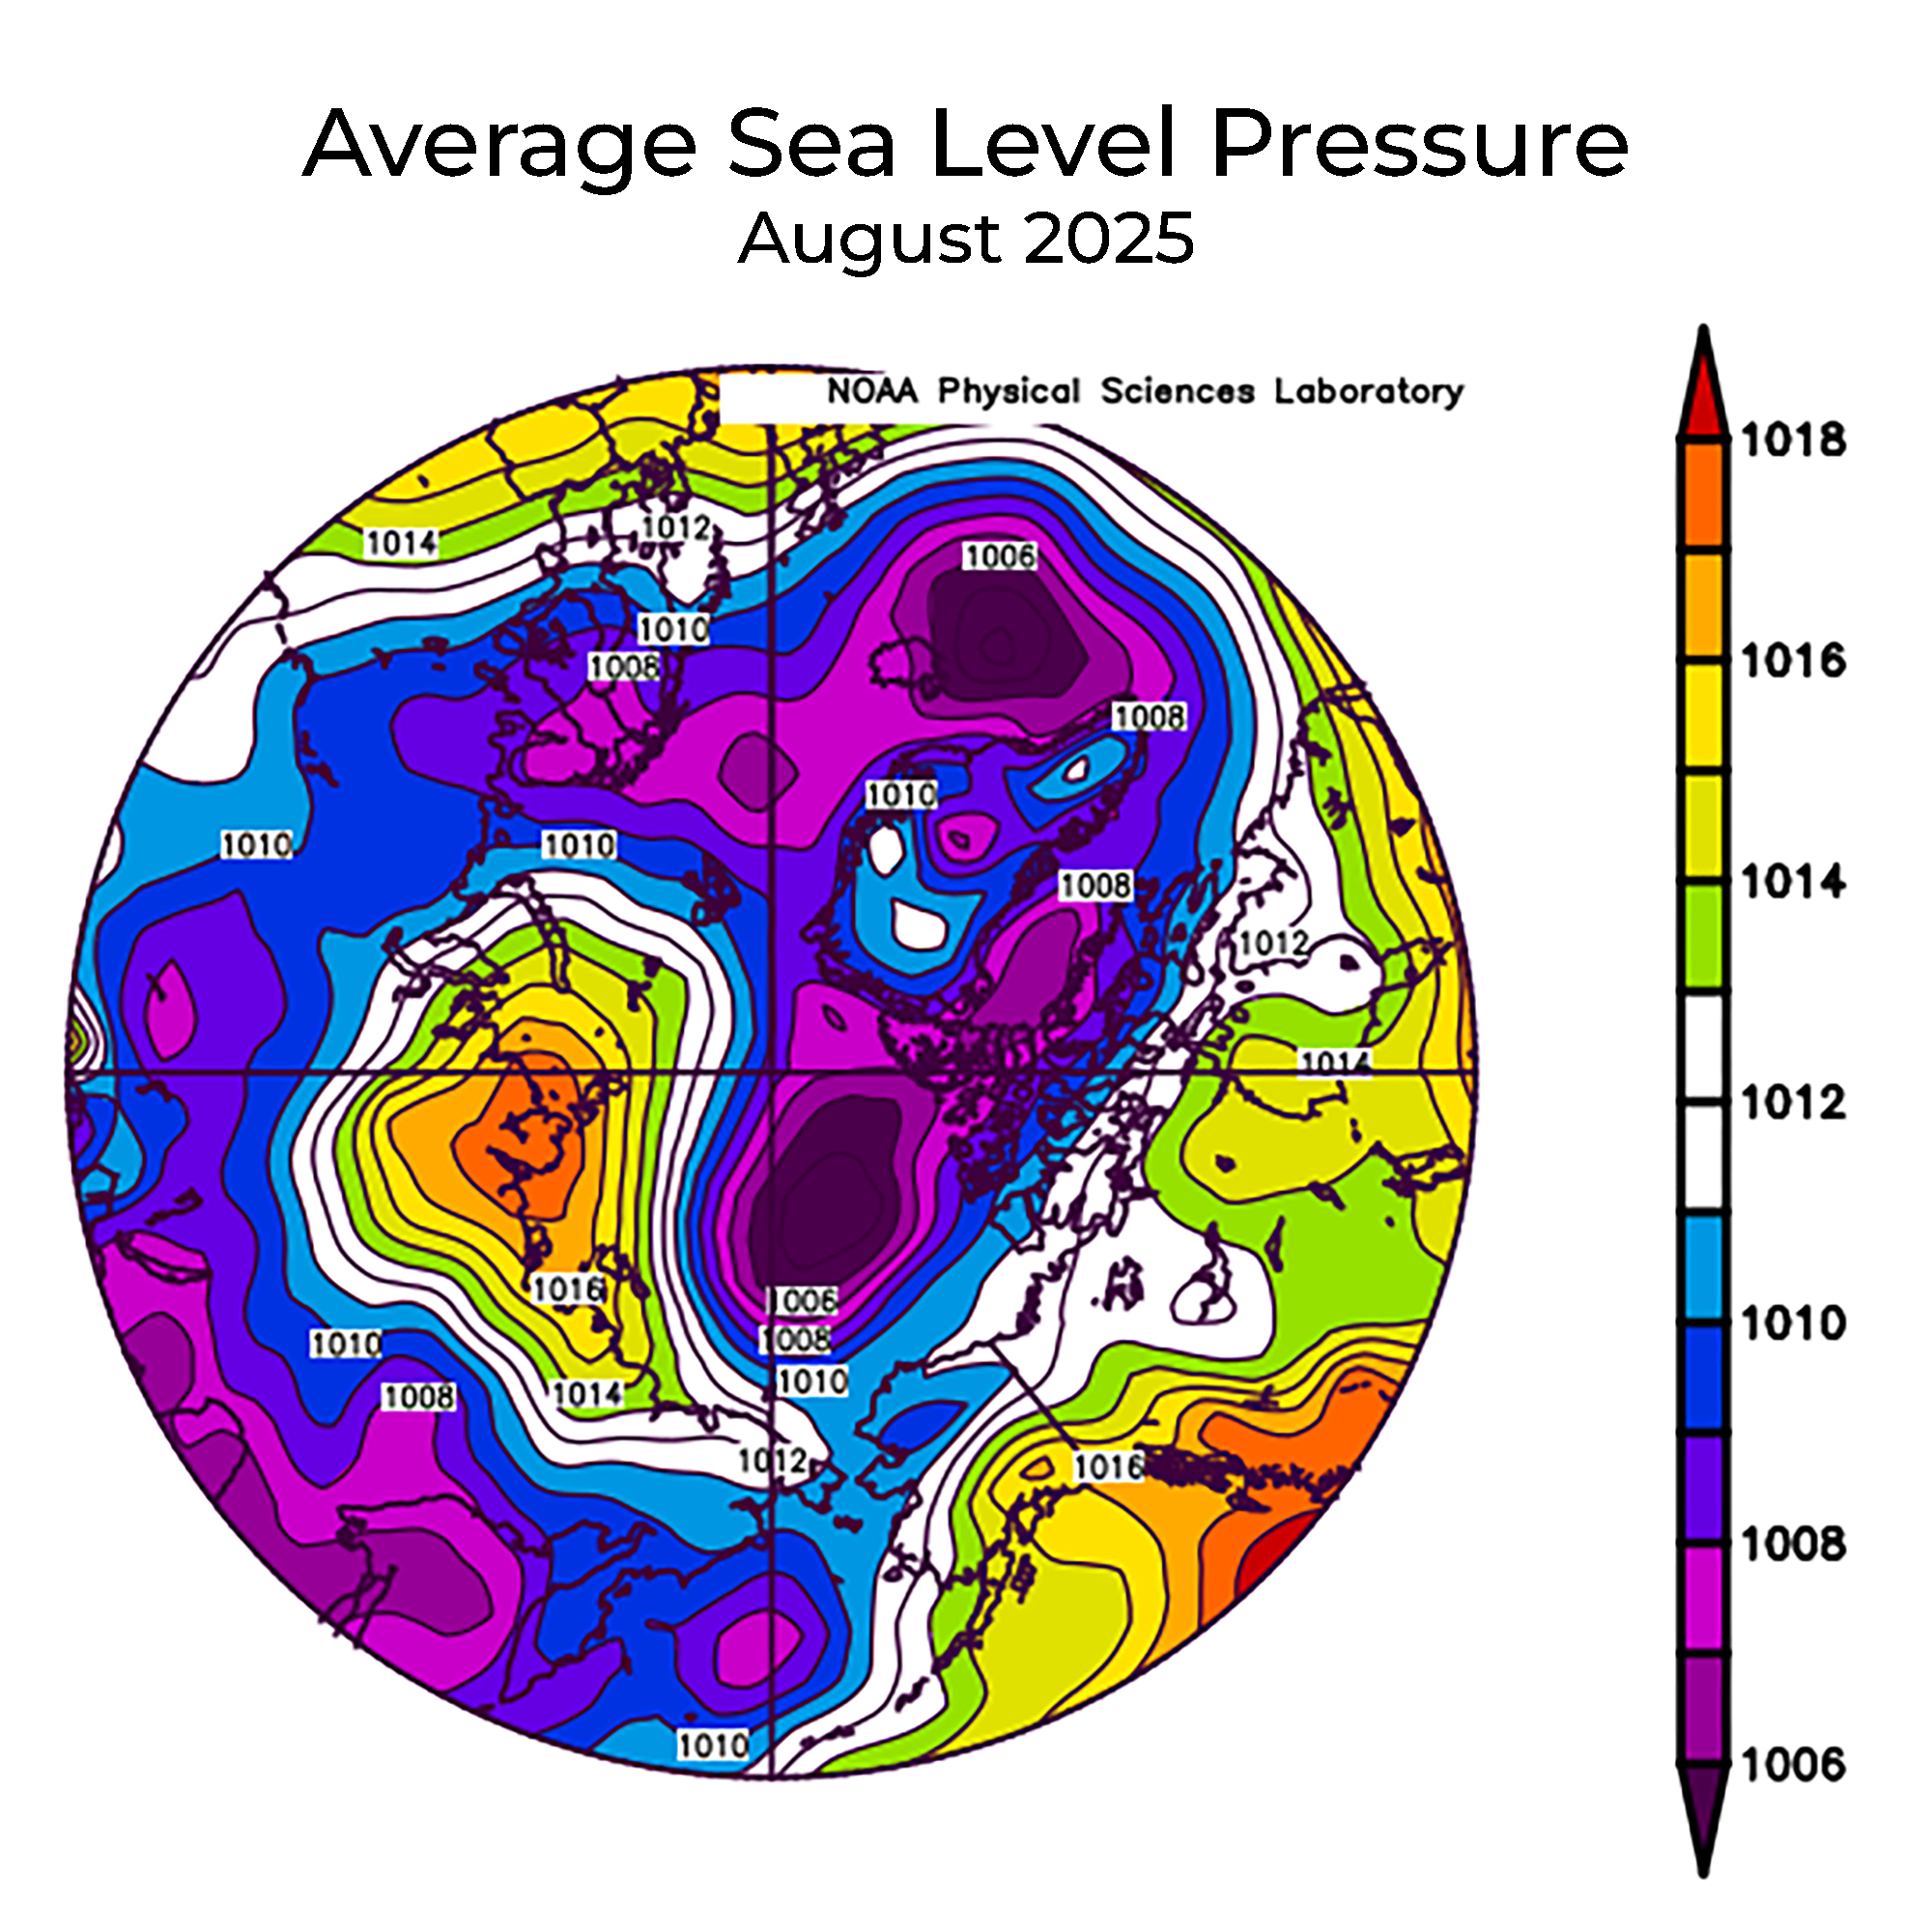
Low sea level pressure dominated the central and western Arctic and the far northern Atlantic Ocean, supporting strong winds from the southwest over the southern Beaufort Sea. This helped drive low sea ice concentration over much of the Arctic Ocean. An area of high air pressure spanned much of the Siberian coast, centered on the Taymyr Peninsula. These conditions likely reduced export of ice through Fram Strait, and indeed the ice edge in the East Greenland Sea, Barents, and Kara Seas remained largely unchanged through the month.
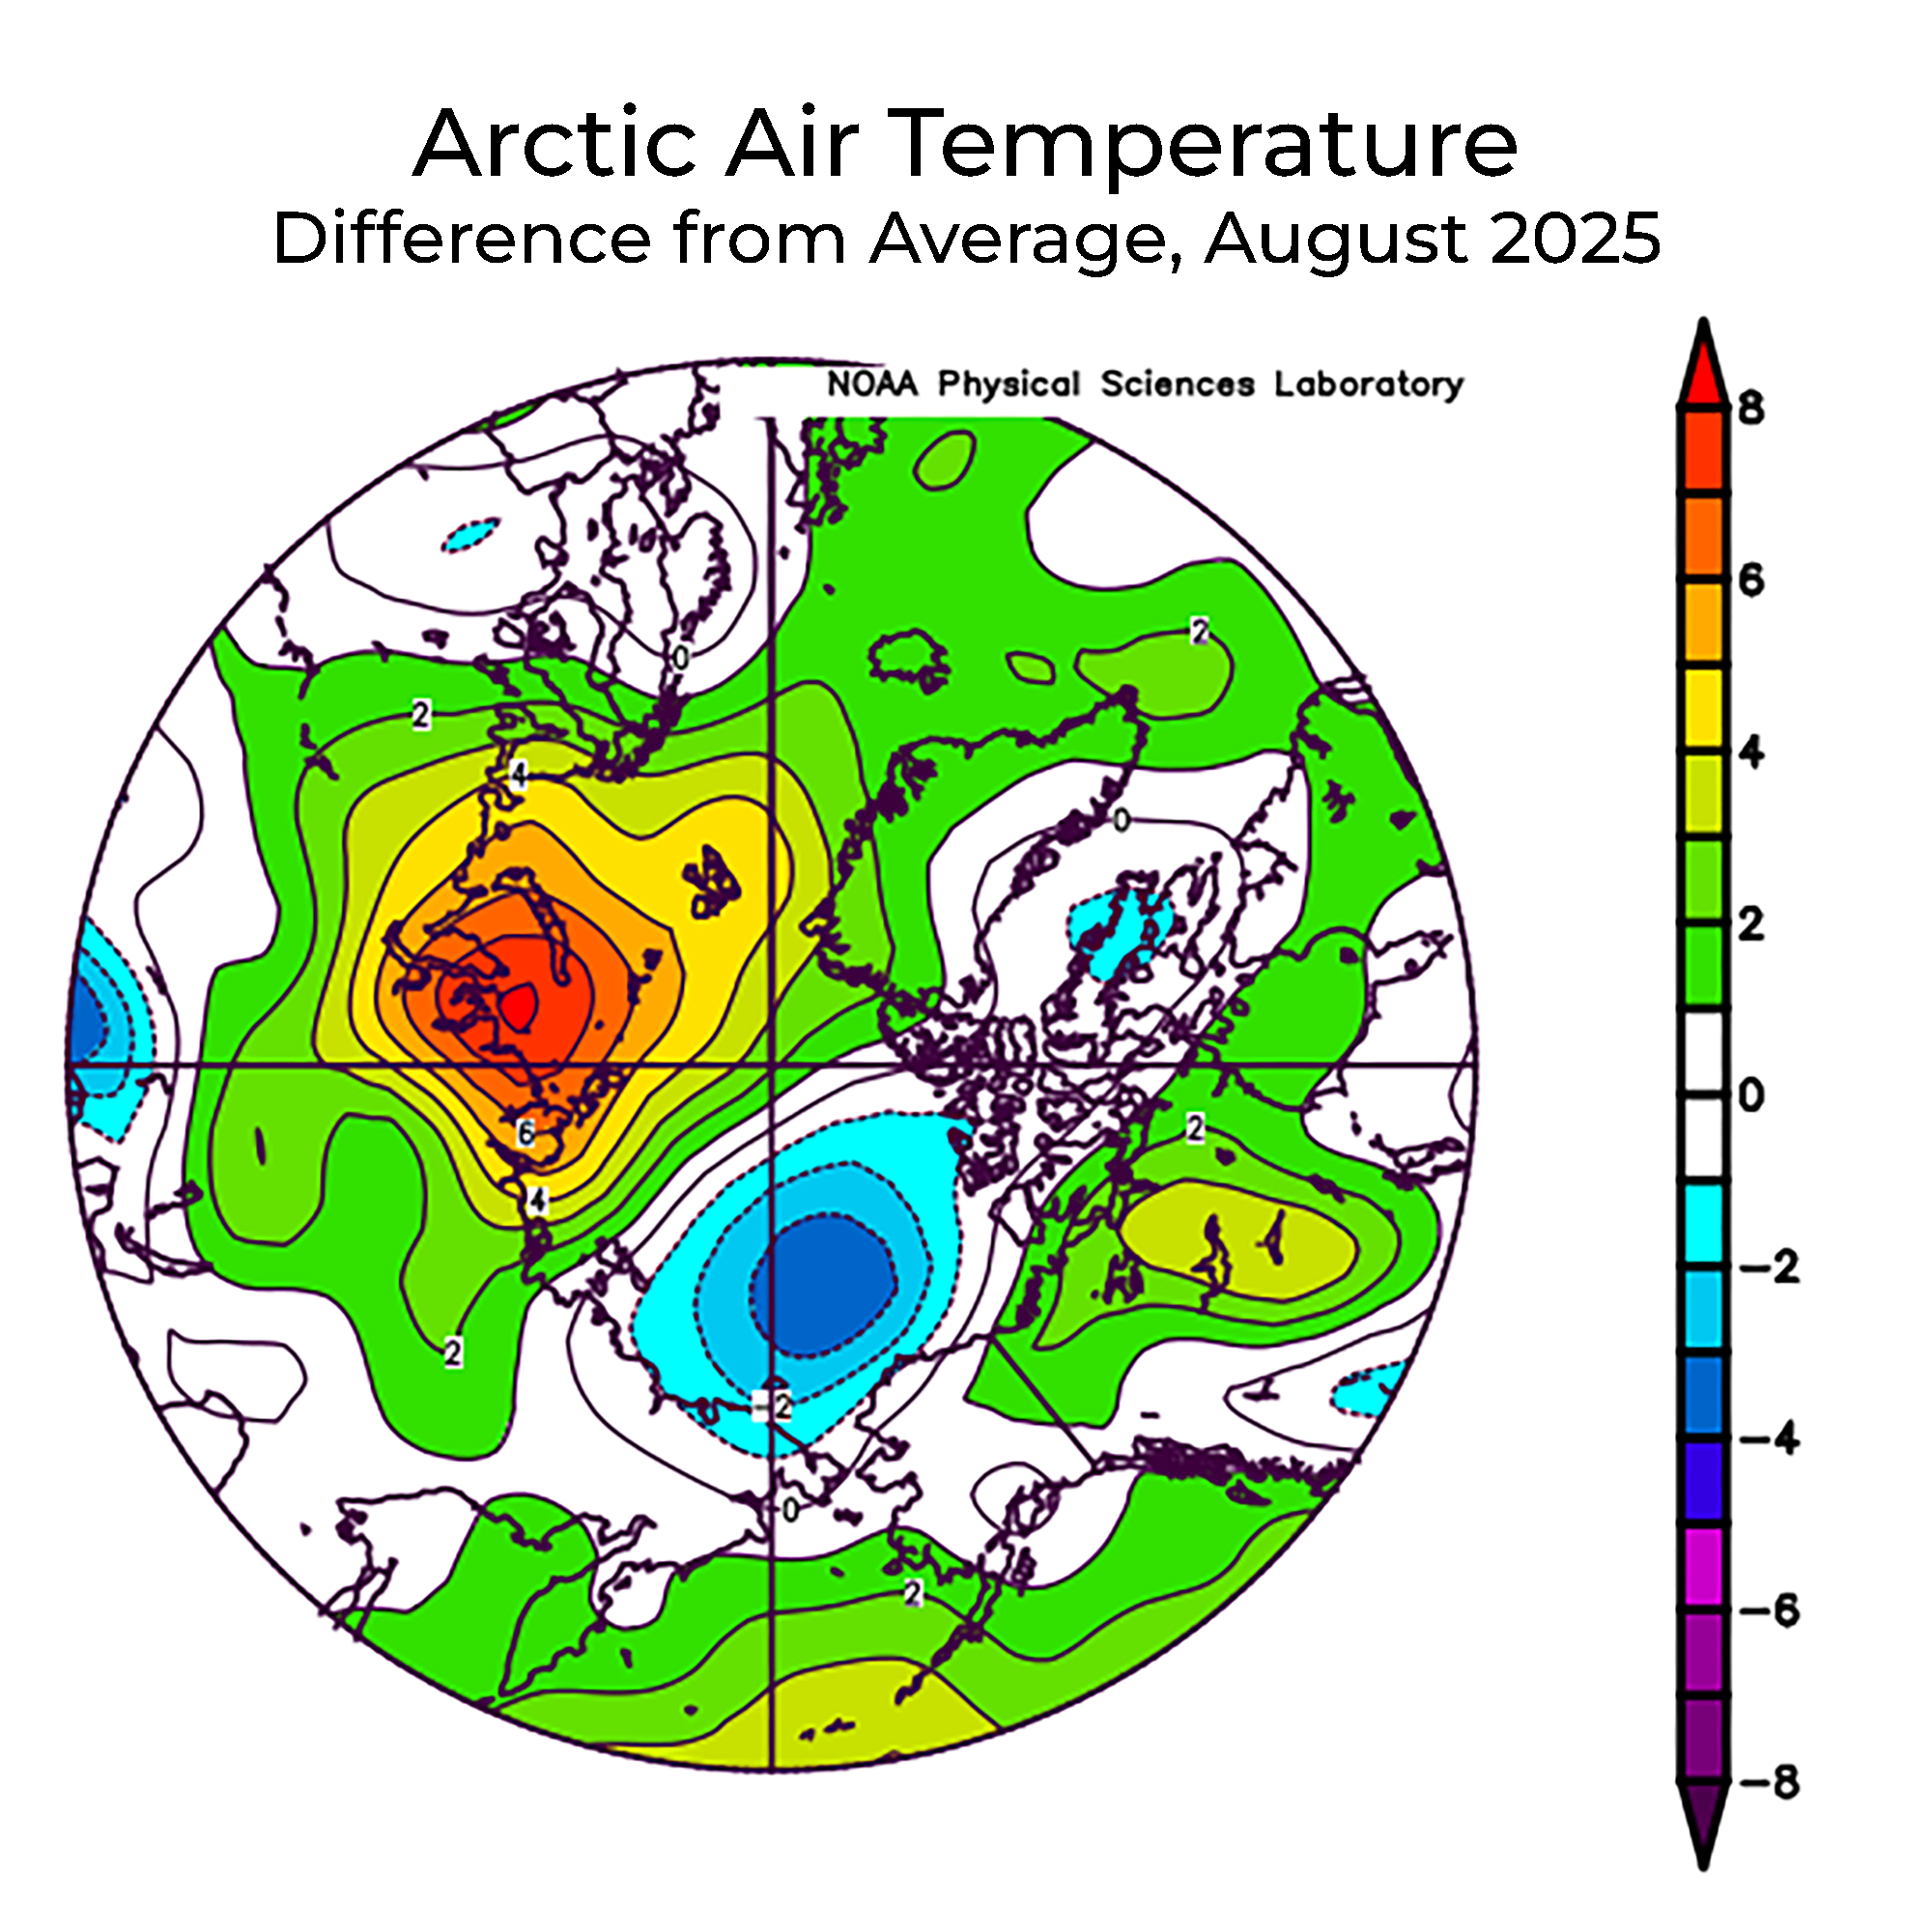
Air temperatures at the 925 millibar level (about 2,500 feet altitude) were 5 to 7 degrees Celsius above average in the high air pressure area and 2 to 4 degrees Celsius below average over the Beaufort Sea. Much of the rest of the Arctic had near-average temperatures for the month.
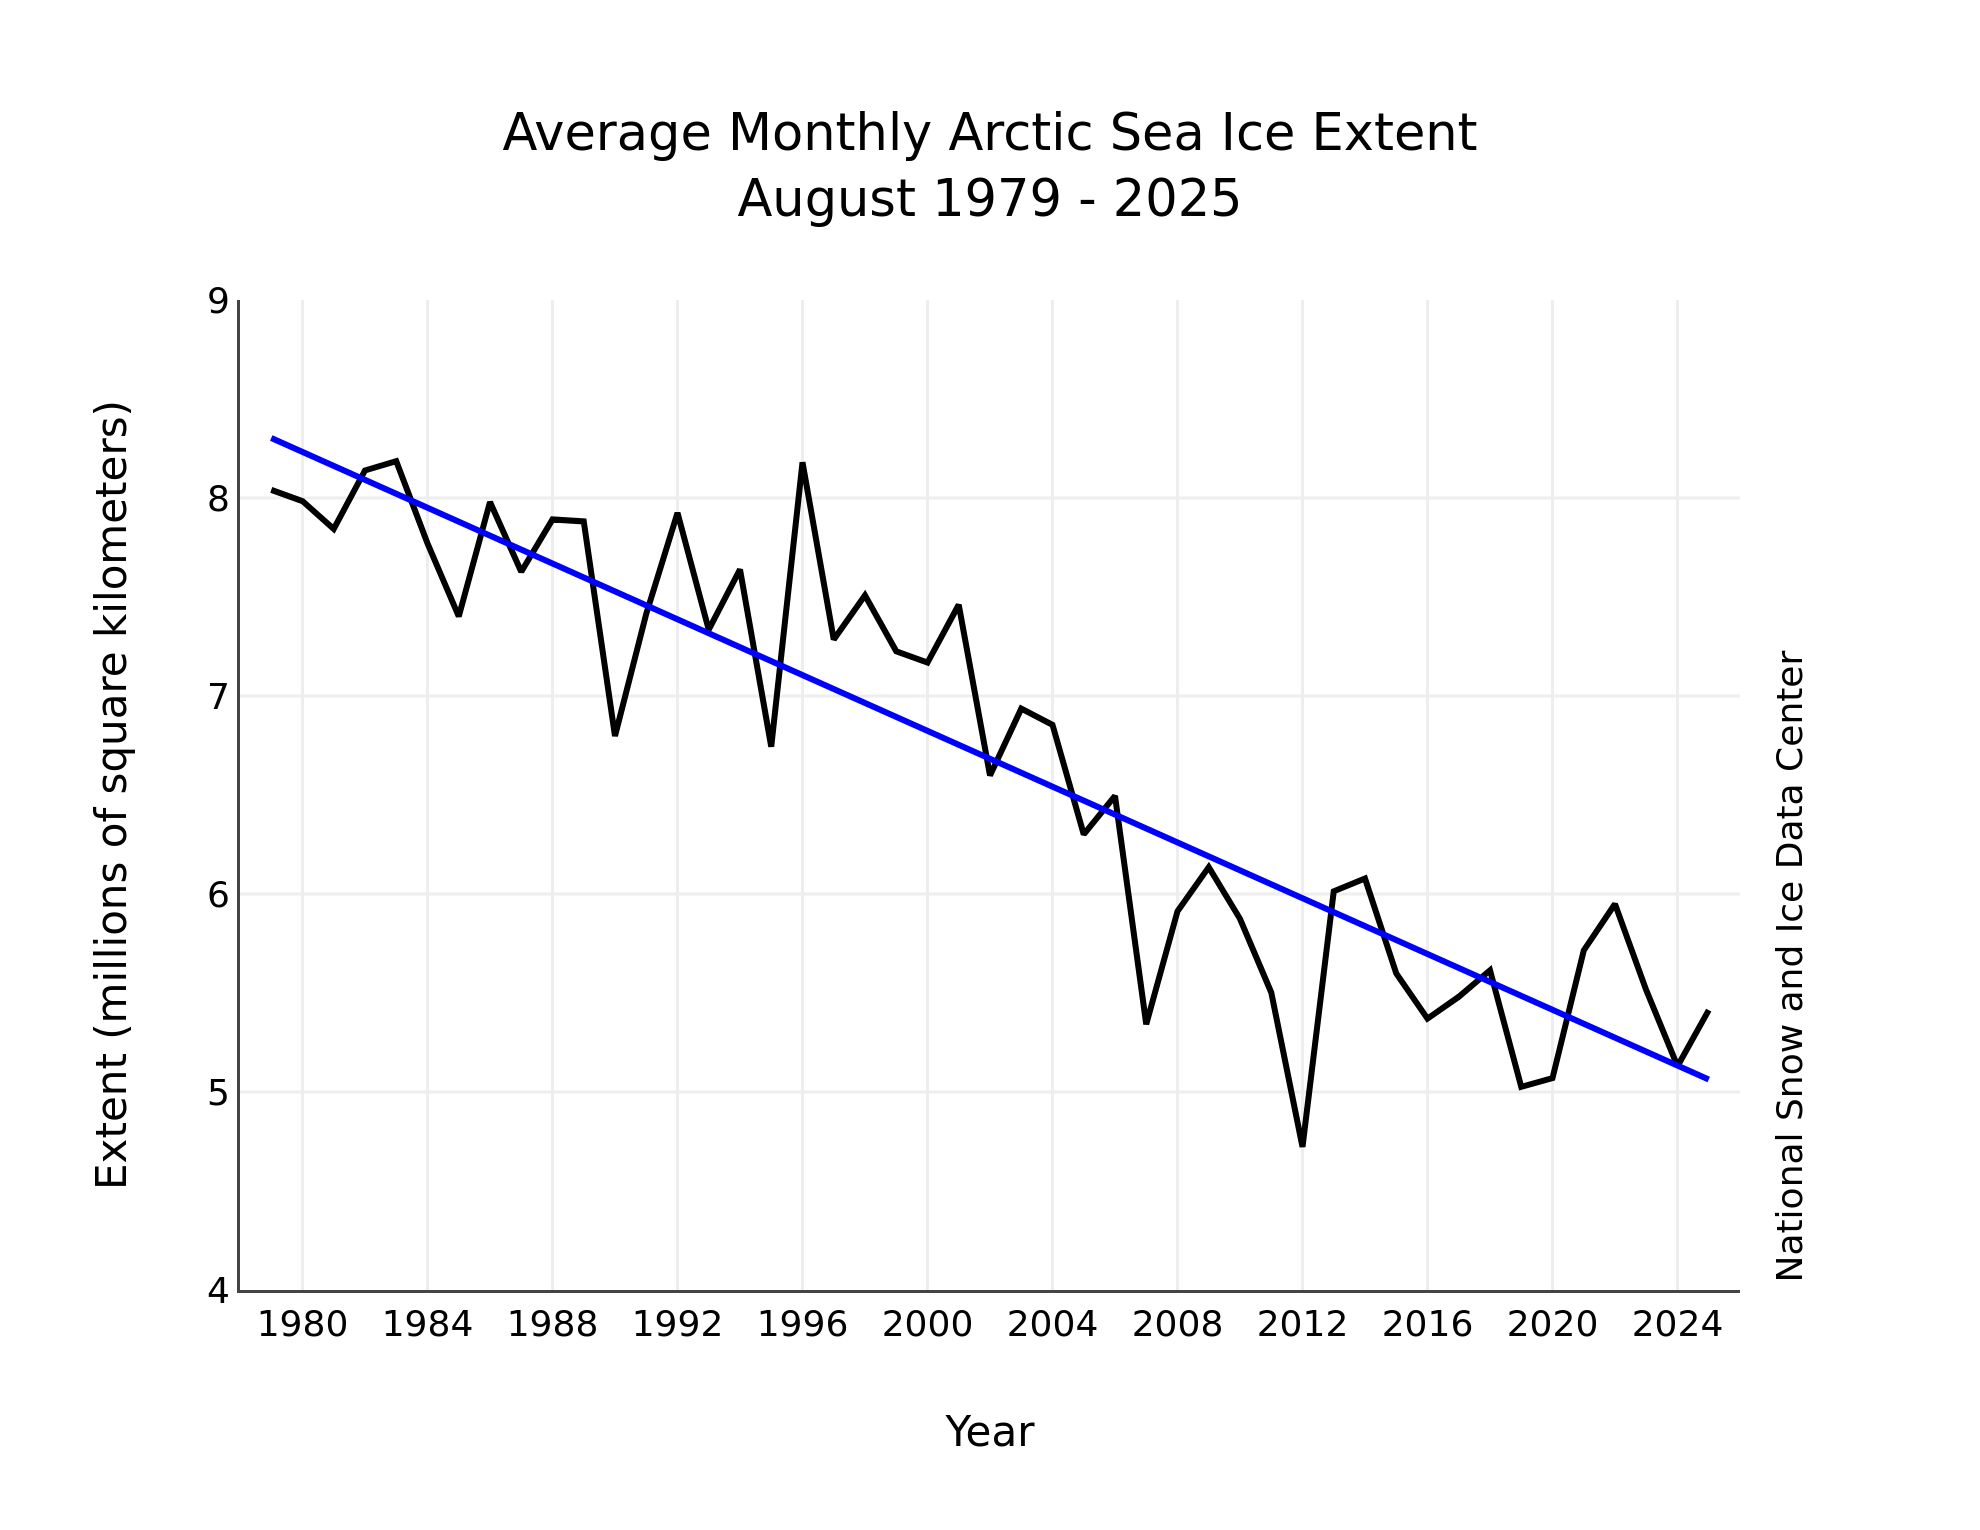
The downward linear trend in Arctic sea ice extent through 2025 for August is 70,500 square kilometers per year or 9.8 percent per decade relative to the 1981 to 2010 average. Based on the linear trend, since 1979, August has lost 3.24 million square kilometers of sea ice. This is equivalent to nearly twice the size of Alaska.
[Update – September 24th]
I return from my summer break to discover much clamour in the GWC moderation queue for the following information! According to the National Snow and Ice Data Center:
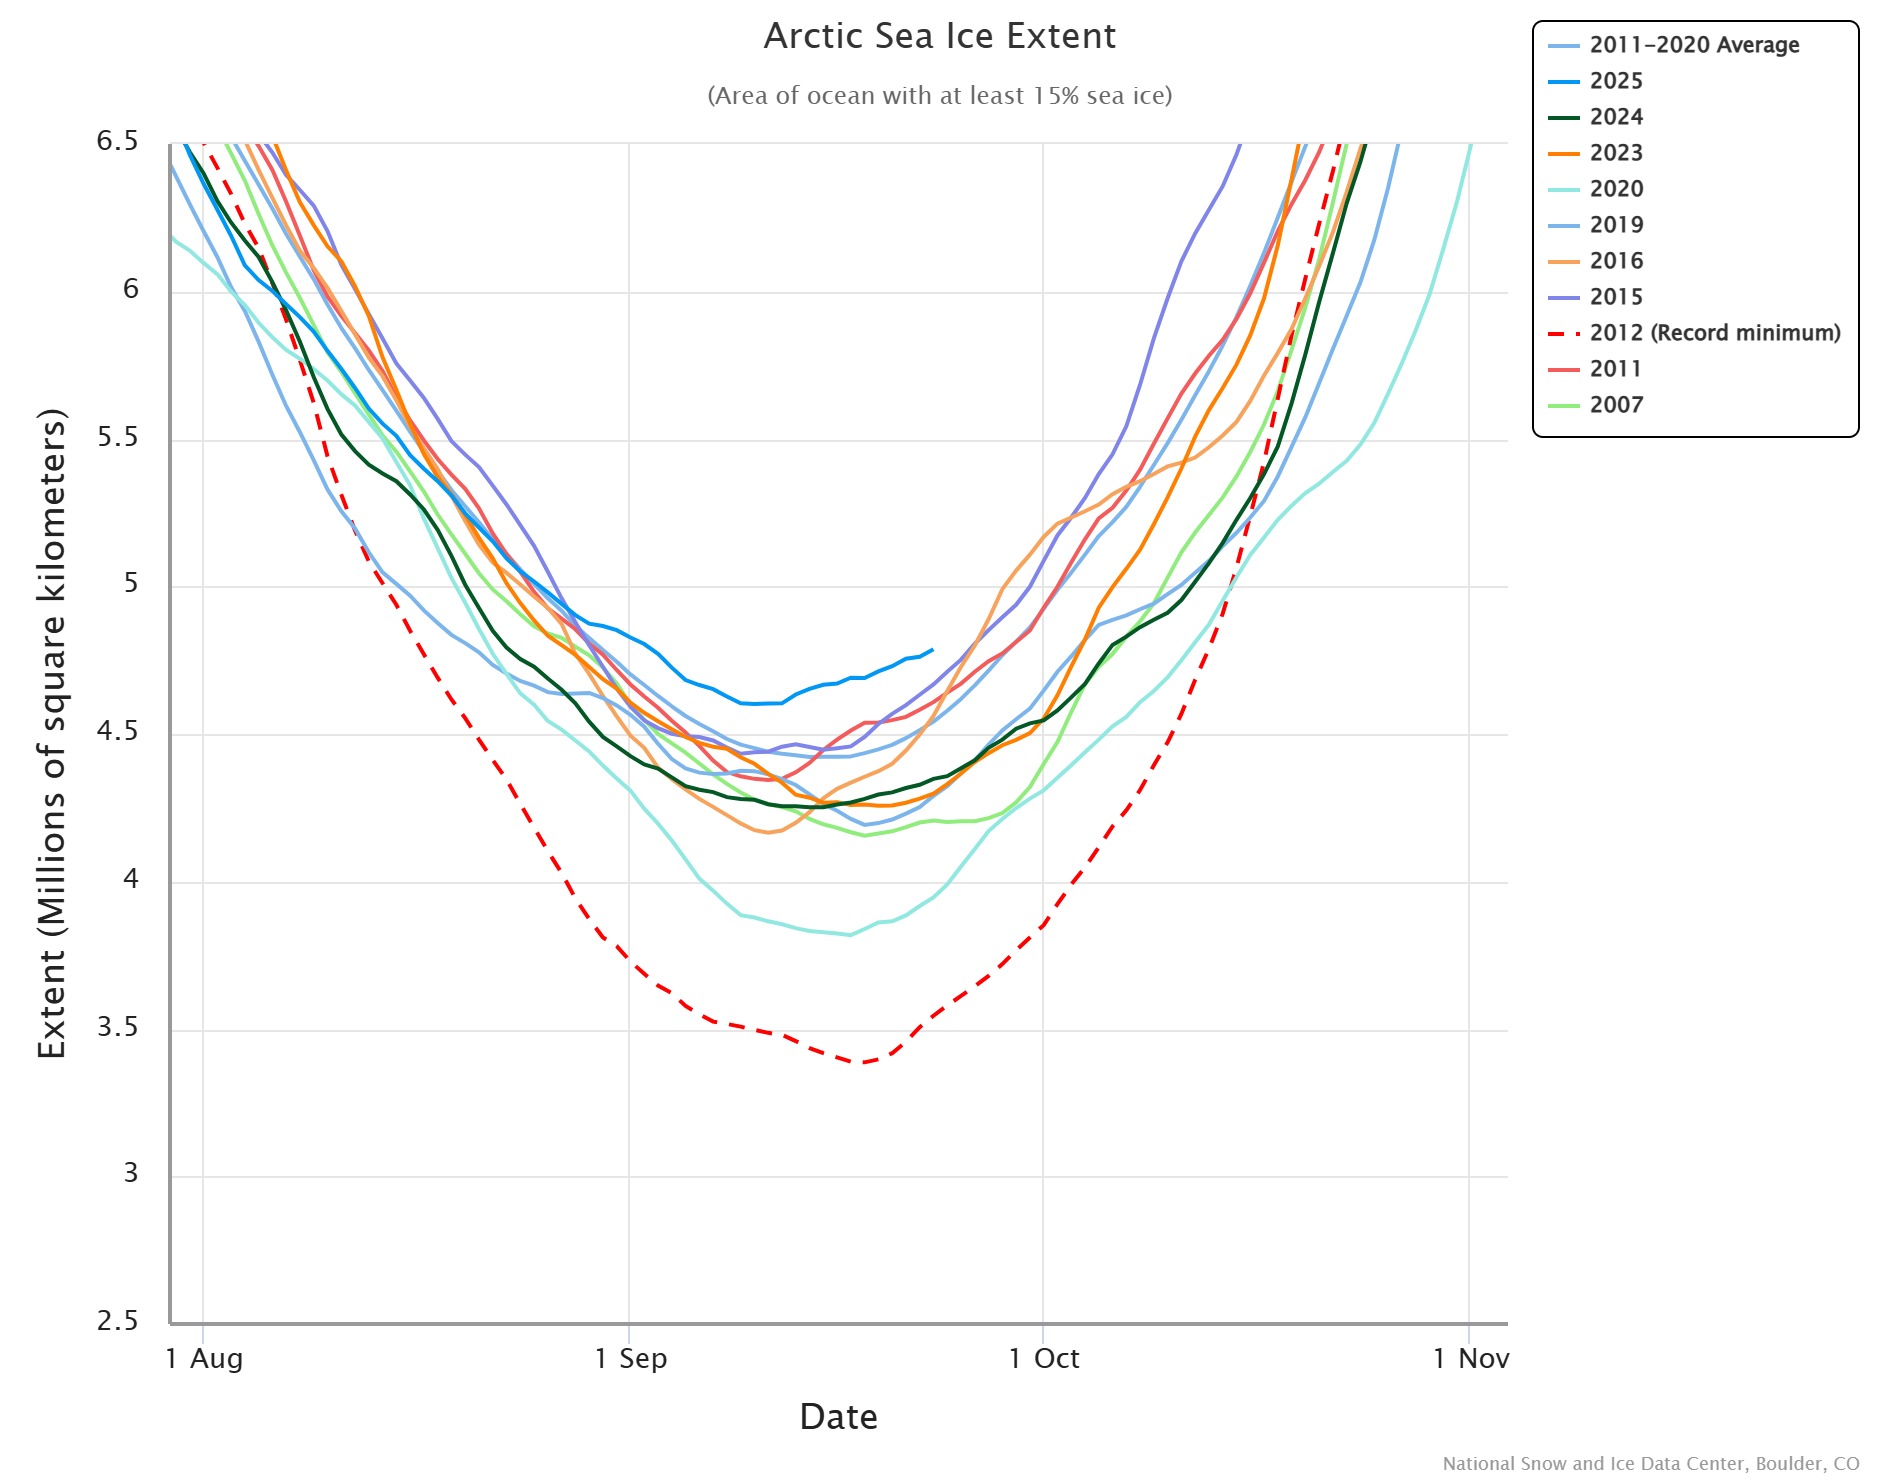
On September 10, Arctic sea ice likely reached its annual minimum extent of 4.60 million square kilometers. The 2025 minimum shares the tenth lowest spot in the nearly 47-year satellite record with 2008 and 2010. While the last 19 years, from 2007 to 2025, are the lowest 19 sea ice extents in the satellite record, there has been no significant trend in September minimum extents over this time. As announced earlier, the minimum is based on Advanced Microwave Scanning Radiometer 2 (AMSR2) data from the Japan Aerospace Exploration Agency (JAXA):
This year’s minimum extent, based on a 5-day average, appears to have been set on September 10. It is 1.21 million square kilometers above the satellite-era record minimum extent of 3.39 million square kilometers, which occurred on September 17, 2012. It is also 1.62 million square kilometers below the 1981 to 2010 average minimum extent, which is equivalent to about the loss in size of Alaska.
The overall, downward trend in the minimum extent from 1979 to 2025 is 12.1 percent per decade relative to the 1981 to 2010 average. From the linear trend, the loss of sea ice is about 74,000 square kilometers per year, equivalent to losing the state of South Dakota or the country of Austria annually.
This overall trend should be viewed with the caveat that there has been no significant downward trend in September minimum extents over the past two decades. Causes for this flattening trend are a matter of active debate in the Arctic science community.
Here’s the Alfred Wegener Institute’s map of sea ice concentration on September 10th 2025:
This tends to happen lately; when sea ice on either pole nears minimum, there’s a “fanning out” which looks undramatic in terms of extent numbers. But in reality, this fanning out is a recipe for faster meltout, due to a larger ice surface contact area with the elements.
Hi Jim!
This Wrangel Island LP (storm) is a very interesting event going forward, considering the state of the long, thin sea ice arm of the Wrangel Island Arm.
I think a certain account on the Forum would dub it a potential ‘flamethrower’ or some such. Ice area could plummet, very fast. Bonus cliché: ‘GAC’ – for Great Arctic Cyclone.
User ‘binntho’ has some interesting tidings about the ‘GAC’ cyclone:
The ESS arm is looking increasingly fragile!
Nullschool has some interesting weather in the next day or two, with a vigorous cyclone literally centered on the shoulder of the arm, pulling strong easterly winds from Siberia to pummel the arm on the western side at speeds of up to 40 km/h which counts as a strong breeze on the Beaufort scale, “Large waves begin to form; the white foam crests are more extensive everywhere; probably some spray”. Another effect of these winds is to push the ice to the south-east, leading to more dispersion (winds will push ice to the right by some 30 degrees from the direction of the wind if I remember correctly, please correct me if I am wrong!)
But the cyclone is also pulling strong southerly winds over the open areas in the Beufort and hitting the ice with winds of up to and even above 50 km/h, near gale-force, “Sea heaps up and white foam from breaking waves begins to be blown in streaks along the direction of the wind; spindrift begins to be seen”.
Looking further, Nullschool has the cyclone moving into the center of the CAB, continuing to pull warm and strong winds from Siberia to pummel the ESS arm but also restarting the southerlies over the Atlantic front.
Temperatures may be getting close to the -11C anectdotal limit for refreeze to start, but not quite there yet according to Nullschool. Of more interest is the persistance and deepening of the cyclone, GFS has it dropping to 970 hPa by Wednesday before dissipating by next weekend. According to GFS, the cyclone pulls some cold air in from Canada and is starting to show end-of-season temperatures in the new year (i.e. Ethiopian new year, we are looking forward to 2018!).
‘Greenbelt’ breathes new life into the vision of a great GAC blow-torch for the remaining ice:
GFS operational now has a 966mb hurricane near the Siberian coast in 144 hours. EC has similar theme though not as radical. That might push ice into the Atlantic, increasing extent! But I think the wave energy would definitely melt ice.
Verily. You are so right.
Oh well, at least now we’re free to excite, or not, without our heart pounding for Yeva and how she’d survive in those waves & winds.
Might’ve been too much excitement, to be quite honest.
a University of Exeter study titled “Minimal Arctic Sea Ice Loss in the Last 20 Years” was published on 16 August 2025 in Geophysical Research Letters science journal. It stated: “Over the past two decades, Arctic sea ice loss has slowed considerably, with no statistically significant decline in September sea ice area since 2005”. The study found this was true for all months.
Loss of Arctic sea ice since 2005 (20 years) was greater than the loss from 1979 to 2005 (25 years).
So if the melting speeds up, and the melt is even bigger over the latest 20 years than the 25 years prior, in total (cumulatively), should we really be talking about a “pause” in sea ice loss? Sounds to me like we’re speeding up.
So no pause, but a strong urge to say the word ‘Pause’ in peer-reviewed scientific papers.
In my opinion, you can now clearly see how Ella on the sailboat Yeva could’ve copied Ousland and sailed counterclockwise, ie Siberia first, and had loads of time to navigate an ice-free Canadian Arctic Archipelago in the autumn on the way home. I’d even argue that she could’ve done Siberia this fall as well, if she hadn’t just thrown in the towel.
Arctic sea ice this week at 4.6 k km³. This week saw daily sea ice volume at 4.6 & its 20-year average at 14.5. This was also an All-Time Low for the latter. The annual average is approaching 12,900 km³. Odds are, COP 30 in the Amazon will change absolutely nothing.
Official PIOMAS September 2025 data is delayed due to a US government shutdown. Latest projections estimate the minimum at around 3,897 km³, making it the 2nd lowest after 2012's 3,673 km³. The 2025 annual mean could still drop below 2017's record low of 12,800 km³, depending on…
This website uses cookies to improve your experience. We'll assume you're ok with this, but you can opt-out if you wish. Cookie settingsACCEPT
Privacy & Cookies Policy
Privacy Overview
This website uses cookies to improve your experience while you navigate through the website. Out of these, the cookies that are categorized as necessary are stored on your browser as they are essential for the working of basic functionalities of the website. We also use third-party cookies that help us analyze and understand how you use this website. These cookies will be stored in your browser only with your consent. You also have the option to opt-out of these cookies. But opting out of some of these cookies may affect your browsing experience.
Necessary cookies are absolutely essential for the website to function properly. This category only includes cookies that ensures basic functionalities and security features of the website. These cookies do not store any personal information.
Any cookies that may not be particularly necessary for the website to function and is used specifically to collect user personal data via analytics, ads, other embedded contents are termed as non-necessary cookies. It is mandatory to procure user consent prior to running these cookies on your website.
Extent is still quite high,to say that the Volume is so low.. we must be heading for a record in regards ice “thiness”!
This tends to happen lately; when sea ice on either pole nears minimum, there’s a “fanning out” which looks undramatic in terms of extent numbers. But in reality, this fanning out is a recipe for faster meltout, due to a larger ice surface contact area with the elements.
Odds are 5th or lower by October 1st (extent)
AMSR2 compaction has gone from a record high in the middle of August to near the lows for date now:
2016 is still the standout year in that department.
Hi Jim!
This Wrangel Island LP (storm) is a very interesting event going forward, considering the state of the long, thin sea ice arm of the Wrangel Island Arm.
I think a certain account on the Forum would dub it a potential ‘flamethrower’ or some such. Ice area could plummet, very fast. Bonus cliché: ‘GAC’ – for Great Arctic Cyclone.
User ‘binntho’ has some interesting tidings about the ‘GAC’ cyclone:
What an end to the 2025 Melt Season!
The current cyclone bottomed out at 983 hPa at 18Z yesterday according to both GFS and the CMC:
This morning’s GFS run doesn’t show it going any lower. I’ll believe in the mythical GAC 2025 when I see it!
‘Greenbelt’ breathes new life into the vision of a great GAC blow-torch for the remaining ice:
One to follow, for sure.
Here’s that chart:
The next run has it at a mere 977 hPa:
Perhaps it would be prudent to wait until things stabilise from one run to the next before getting overly excited?
NSIDC area at a new low for the year 2.760!
I think 4 of the last 6 years have dipped below 2019 by that metric.
Verily. You are so right.
Oh well, at least now we’re free to excite, or not, without our heart pounding for Yeva and how she’d survive in those waves & winds.
Might’ve been too much excitement, to be quite honest.
a University of Exeter study titled “Minimal Arctic Sea Ice Loss in the Last 20 Years” was published on 16 August 2025 in Geophysical Research Letters science journal. It stated: “Over the past two decades, Arctic sea ice loss has slowed considerably, with no statistically significant decline in September sea ice area since 2005”. The study found this was true for all months.
The paper was actually entitled “Minimal Arctic Sea Ice Loss in the Last 20 Years, Consistent With Internal Climate Variability”
Have you read it? I ask in part because you neglected to mention the other “key points”:
Loss of Arctic sea ice since 2005 (20 years) was greater than the loss from 1979 to 2005 (25 years).
So if the melting speeds up, and the melt is even bigger over the latest 20 years than the 25 years prior, in total (cumulatively), should we really be talking about a “pause” in sea ice loss? Sounds to me like we’re speeding up.
So no pause, but a strong urge to say the word ‘Pause’ in peer-reviewed scientific papers.
Since both NASA and NSIDC have now declared a minimum extent for 2025, it would be appropriate for you to write an update, no?
“Loss of Arctic sea ice since 2005 (20 years) was greater than the loss from 1979 to 2005 (25 years).”.
The frightening thing is that Jim and going south believe this. I really see no hope for western civilisation.
I assume that GS was referring to NSIDC annual minimum extent. Here’s a visualisation of the data:
Apparently you prefer annual averages? Here’s a visualisation of that data too:
There’s a few more days left in September 2025, so this year’s number will inevitably end up as lowest in the satellite era
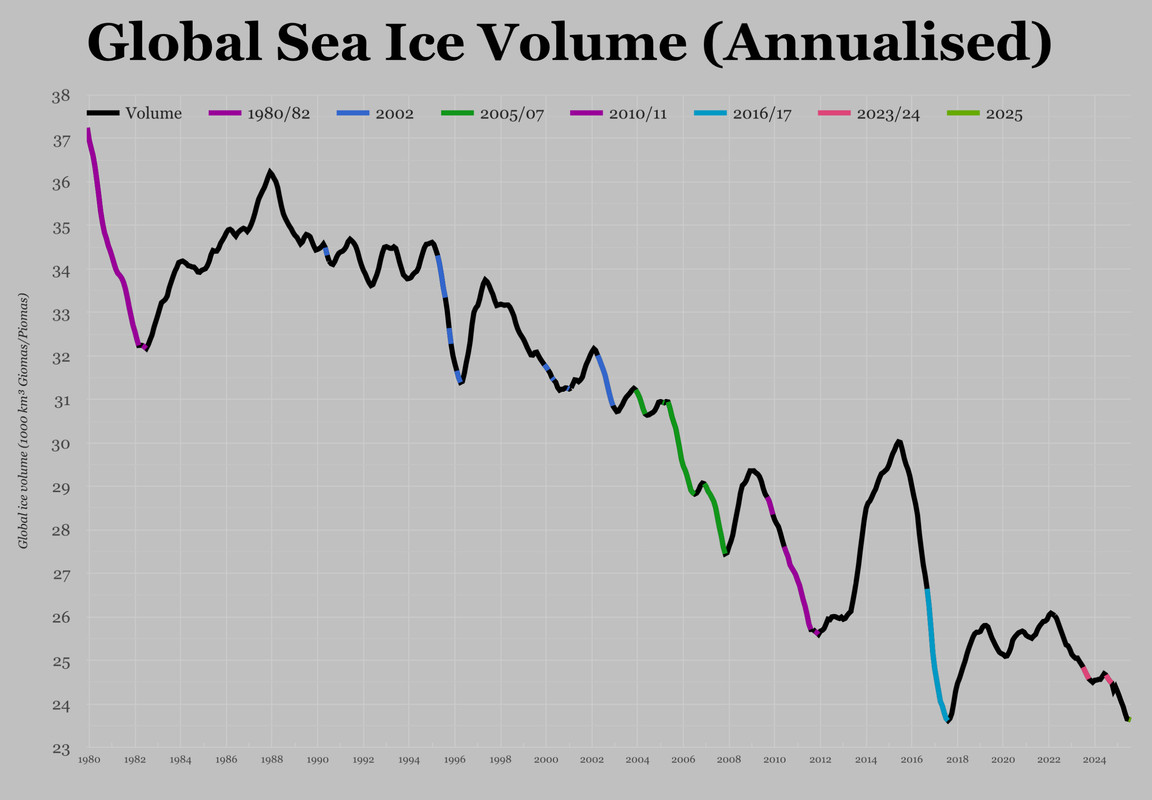
Nice graph, would be interesting to see one of volume when we have the data in!
Your wish is my command…
Presumably, you do know that ‘loss of ice’ is measured in volume, or km3, right?
Just do the math, ice loss is speeding up. Or would you rather prefer a pause?
In which case here’s a visualisation of the volume data:
September 2025 number yet to be determined!
I’m sorry, Jim, my snark there was aimed at Peter, lol 😀
Yes, the volume, in 365-day averages, is where it’s at.
Computers can calculate these average numbers almost without thinking. Now we just have to inform climate scientists about their existence…
“My snark there was aimed at Peter”.
That was my assumption, so no offence taken! The graph was for Peter’s benefit.
“Volume, in 365-day averages, is where it’s at”.
The September PIOMAS data is eagerly anticipated.
“ There’s a few more days left in September 2025, so this year’s number will inevitably end up as lowest in the satellite era”.
[Attempted mind reading and unevidenced assertions snipped – Mod]
Here you go Peter:
“So wouldn’t it be more accurate to use annual average extents rather than minimum extents.”
https://GreatWhiteCon.info/2022/09/the-2022-arctic-sea-ice-minimum-extent/#comment-642473
In my opinion, you can now clearly see how Ella on the sailboat Yeva could’ve copied Ousland and sailed counterclockwise, ie Siberia first, and had loads of time to navigate an ice-free Canadian Arctic Archipelago in the autumn on the way home. I’d even argue that she could’ve done Siberia this fall as well, if she hadn’t just thrown in the towel.
Sadly:
“From September 30, 2025, access to Imgur from the United Kingdom is no longer available”.
Ella’s permission for the NSR only allowed her to use “ice free” near shore regions:
Arctic sea ice this week at 4.6 k km³. This week saw daily sea ice volume at 4.6 & its 20-year average at 14.5. This was also an All-Time Low for the latter. The annual average is approaching 12,900 km³. Odds are, COP 30 in the Amazon will change absolutely nothing.
Here’s your troublesome image:
For some strange reason even with moderator superpowers I cannot embed it in your comment.
Thx, Jim!
I’ll shop around for an adequate Imgur alternative.
GS
Test
https://i.postimg.cc/kMxhjcth/IMG-5229.jpg
Another test
https://postimg.cc/Wt1nz08M
Markdown test
[%5D(https://postimg.cc/Wt1nz08M)
In theory you should be able to embed an image by wrapping the URL in an HTML “img” tag. See below.
However that doesn’t seem to work with the assorted image hosting sites you’ve been testing.
Another test:
Which worked. Embedded from Postimage.
However if I add exactly the same code to one of your comments the image does not appear. Most peculiar!
A test of my own, embedding an image from a recent RealClimate post about Arctic sea ice:
Test
Test 2
It seems to only work when you have admin privileges, Jim?
It doesn’t work for me either, for the image hosting sites you’ve been trying at least.
If all else fails you should be able to upload attachments now. The GWC virtual hard drive had filled up with a vast error log. Now fixed.
OK, let’s test!
A humble image embedding test comment:
[I couldn’t embed an image in here, either as a humble commenter or subsequently with admin privileges – Mod]
Tweet Embed Test:
(old name instead of just X)
That’s the secret